Carbohydrate food sources and the 10-gram meal
Key takeaways · 9 min read
- The recommended minimum is 130 grams of carbohydrate a day, set by what the brain uses.
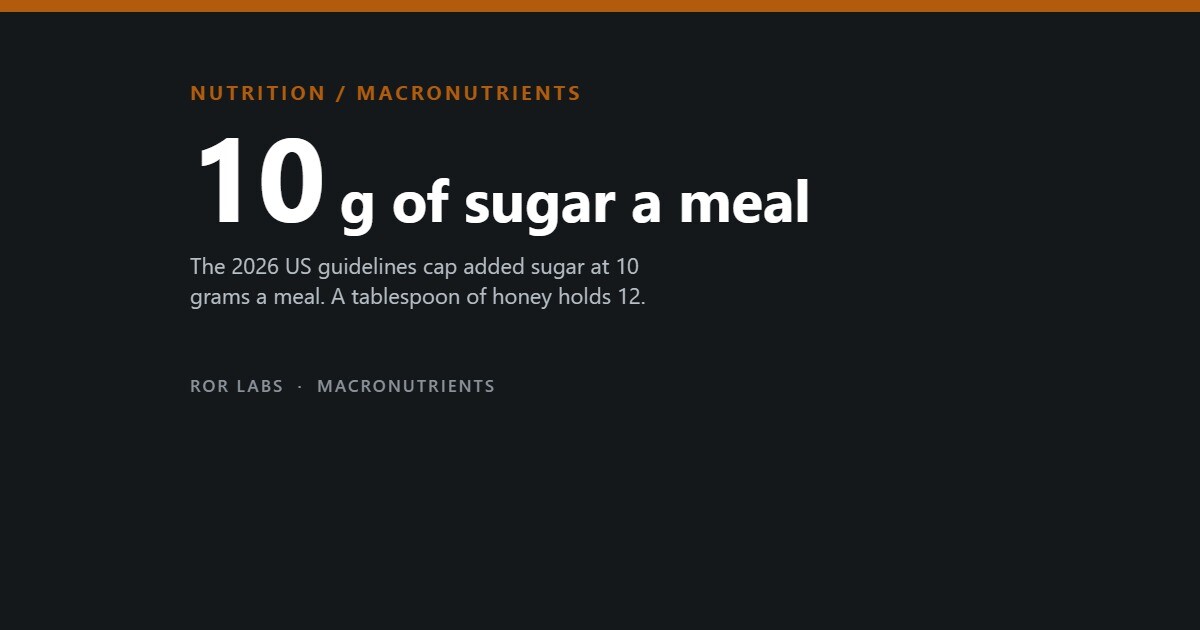
- The 2025 to 2030 US guidelines say no added sugar is needed and cap it at 10 grams a meal. A tablespoon of honey exceeds that.
- In the largest trial, low-carb and low-fat diets tied for weight loss at a year.
- In cohorts, both very low and very high carbohydrate intakes went with higher mortality; what replaced the carbohydrate mattered.
A level tablespoon of honey holds about 12 grams of sugar. Under the US Dietary Guidelines published in January 2026, that is already more than a whole meal is supposed to contain: “one meal should contain no more than 10 grams of added sugars.” Honey counts as an added sugar when it goes into food.
The reference number underneath all of this has not changed in two decades. Adults are advised to eat at least 130 grams of carbohydrate a day — a figure set not by what muscles want but by how much glucose the brain uses.
This article covers what carbohydrates do and the reference numbers, which foods carry them, what the new guidelines changed, what the diet trials and long-term studies found, and why the kind of carbohydrate seems to matter more than the amount.
What carbohydrates do, and the numbers behind them
Carbohydrates are sugars, starches and fibre. Sugars and starches are broken down to glucose, the main fuel for the brain and for hard exercise; fibre mostly passes through undigested and was covered in the fibre article. Unlike protein and fat, no carbohydrate is strictly essential, because the body can make glucose from other sources. The reference numbers exist because of the brain.
The reference numbers for carbohydrate
US dietary reference values and guidance for adults, with average added-sugar intake.
Source: National Academies, DRI macronutrient tables; WHO, Guideline: sugars intake for adults and children (2015); CDC, added sugars data, NHANES 2017–2018.
The 130-gram figure is a minimum tied to the brain, not an ideal. The acceptable range — 45% to 65% of energy — is where most of the argument has been. The World Health Organization’s 2015 guideline adds a separate limit for free sugars: below 10% of energy as a strong recommendation, and below 5%, about 25 grams, as a conditional one. Free sugars include honey, syrups and fruit juice, but not sugar in whole fruit, vegetables or milk.
American adults average about 17 teaspoons of added sugar a day, according to the CDC, with sugary drinks, desserts and sweet snacks the leading sources.
Three foods by the spoonful
The series ranks foods by what one level tablespoon, 15 grams, delivers, using USDA values per 100 grams. For carbohydrate the ranking says less than usual, because the top foods are nearly pure carbohydrate. What differs is what comes with it.
Carbohydrate in one level tablespoon (15 g)
USDA FoodData Central, SR Legacy, nutrients 205, 269 and 291. Sugars and fibre shown for each food.
Source: USDA FoodData Central. Arithmetic on the per-100 g values: 15 g is 0.15 of the listed figure.
Sugar, cornstarch and honey are the three, and none of them is a meal. The spread from first place to sixth is only 5 grams. What changes down the table is the sugar and the fibre: a spoon of cornstarch and a spoon of sugar carry almost the same carbohydrate, but one is starch and one is sucrose, and a spoon of oats carries fifteen times the fibre of a spoon of dates.

That is the whole difficulty with carbohydrate as a category. It groups table sugar with lentils. Most of the useful evidence tries to separate them.
What the new guidelines changed
The previous US guidelines limited added sugars to less than 10% of calories, about 50 grams on a 2,000-calorie diet. The 2025 to 2030 edition is stricter and more direct. It says “no amount of added sugars or non-nutritive sweeteners is recommended or considered part of a healthy or nutritious diet”, sets the 10-gram-per-meal ceiling, and tells readers to “avoid sugar-sweetened beverages”.
It also asks for a significant reduction in highly processed, refined carbohydrates, naming white bread, packaged breakfast foods, flour tortillas and crackers, while recommending two to four servings of whole grains a day. And it adds a line with no precedent in earlier editions: “individuals with certain chronic diseases may experience improved health outcomes when following a lower carbohydrate diet.”
Set against average intake, the gap is large. Seventeen teaspoons is roughly 68 grams a day. The new ceiling, spread over three meals, is 30.
What the diet trials found
The biggest head-to-head test of low-carbohydrate against low-fat eating was DIETFITS, published in 2018. It randomised 609 adults with overweight or obesity to a healthy low-fat or a healthy low-carbohydrate diet for a year, with 22 education sessions that stressed food quality rather than calorie counting.
Low-carbohydrate diets in two trials
Randomised evidence on weight and on type 2 diabetes.
Healthy low-fat: −5.3 kg
Healthy low-carb: −6.0 kg
Difference not significant
Individual results from −30 kg to +10 kg in both arms
Remission at 6 months: 32 more per 100 on low-carb
At 12 months: most benefits faded
Moderate to low certainty
Source: Gardner et al., JAMA 319(7):667–679 (2018); Goldenberg et al., BMJ 372:m4743 (2021).
The two diets tied. Neither a genetic pattern nor insulin secretion predicted who did better on which. The variation within each diet — from losing 30 kilograms to gaining 10 — dwarfed the difference between them.
For type 2 diabetes the picture is similar over time. A 2021 meta-analysis of 23 trials found that low-carbohydrate diets, defined as under 26% of energy, produced more remission at six months, a risk difference of 0.32. By twelve months most of the benefit had faded. Another pooled analysis found blood sugar control better at three months, no different at six and twelve, and slightly worse at two years.
What long-term studies found
Trials rarely last long enough to measure death rates, so the long-term evidence comes from cohorts, with the usual caution that they show associations.
Carbohydrate intake and mortality
Hazard ratios for death. Above 1.00 means higher risk. Observational studies.
Source: Seidelmann et al., Lancet Public Health 3(9):e419–e428 (2018); Dehghan et al., Lancet 390(10107):2050–2062 (2017).
The ARIC study followed 15,428 middle-aged Americans for a median of 25 years. Risk was lowest when carbohydrate supplied 50% to 55% of energy and rose at both ends. A 50-year-old eating less than 30% carbohydrate had a projected 4.0 fewer years of life than one eating 50% to 55%. The authors then pooled 432,179 people from other cohorts. What replaced the carbohydrate mattered: animal protein and fat went with higher risk, plant sources with lower.
The PURE study of 135,335 people in 18 countries found the opposite end: the highest carbohydrate intakes went with 28% higher mortality. Critics noted that the very highest intakes came largely from lower-income settings, where a diet dominated by refined staples is also a marker of poverty. Both studies are consistent with one reading: extremes and poor quality are the problem, not carbohydrate as such.
Quality over quantity

The strongest evidence that the kind of carbohydrate matters comes from studies of glycaemic index, a measure of how fast a food raises blood sugar. A 2013 meta-analysis found type 2 diabetes risk rose 8% for every five-unit increase in the glycaemic index of the diet. Total carbohydrate intake, by contrast, showed no association: a relative risk of 0.97 for every extra 50 grams a day. In the PURE data, published in 2021, people with the highest-glycaemic diets had 51% more cardiovascular events or deaths if they already had heart disease and 21% more if they did not.
A larger 2019 analysis reached the same direction with a steeper slope, 27% more risk for every ten units of glycaemic index. And a 2022 pooled analysis of total carbohydrate found no association with diabetes in Western countries but a 26% higher risk in Asian ones, where intakes are higher and more of it comes from refined rice. The amount only started to matter where it was large and mostly refined.
Public policy has started to act on the sugar end. The UK’s soft drinks levy, introduced in 2018, taxes drinks by sugar content. A 2023 analysis found obesity among girls aged 10 to 11 fell by 1.6 percentage points, about 8%, or roughly 5,234 cases a year, with no change among boys. Children’s free sugar intake fell by 4.8 grams a day and adults’ by 10.9 grams.
Keeping intake where it should be
It is worth remembering how far the official ceilings have moved. The National Academies, writing in 2002, suggested added sugars stay below 25% of energy. The WHO settled on 10% in 2015, with 5% as a further goal. The 2026 US guidelines now say none is needed at all. The biology did not change in that time; the evidence on sugary drinks, weight and dental decay accumulated.
For most people the practical advice is the same as the guidelines’: cut sugary drinks first, since they are the largest single source of added sugar, and shift from refined grains to whole grains, beans, fruit and vegetables. A lower-carbohydrate diet is a reasonable option for some people with type 2 diabetes, but its advantage in trials has been short-lived, and it works best planned with a doctor.
Questions people ask
How many carbohydrates do I need a day?
The recommended minimum is 130 grams, based on brain glucose use. Most guidelines put total carbohydrate at 45% to 65% of energy.
What does the new 10-gram rule mean?
The 2025 to 2030 US guidelines say one meal should contain no more than 10 grams of added sugars. A level tablespoon of honey alone is over that.
Is a low-carb diet better for weight loss?
In the largest trial, no: healthy low-carb and healthy low-fat diets produced similar weight loss at a year.
Are carbohydrates bad for you?
The evidence points to type and extremes. Very low and very high intakes were both associated with higher mortality, and high glycaemic diets with more diabetes and heart disease.
Does fruit count as added sugar?
Sugar in whole fruit does not. Fruit juice counts as a free sugar under the WHO definition.
The short version
- The recommended minimum is 130 grams of carbohydrate a day, set by what the brain uses.
- The 2025 to 2030 US guidelines say no added sugar is needed and cap it at 10 grams a meal. A tablespoon of honey exceeds that.
- In the largest trial, low-carb and low-fat diets tied for weight loss at a year.
- In cohorts, both very low and very high carbohydrate intakes went with higher mortality; what replaced the carbohydrate mattered.
- Glycaemic index predicted diabetes; total carbohydrate did not.
- The UK sugar levy was followed by less obesity in girls, not boys.
This is a summary of published research, not medical advice. If you have diabetes or take medicines that lower blood sugar, changing your carbohydrate intake can change the dose you need — talk to your doctor or a registered dietitian first.
Further reading: Seidelmann et al., Lancet Public Health 3(9):e419–e428 (2018), for the long-term carbohydrate curve. Gardner et al., JAMA 319(7):667–679 (2018), for DIETFITS. Rogers et al., PLoS Medicine 20(1):e1004160 (2023), for the UK sugar levy and childhood obesity.
- Glucose Revolution, Jessie Inchauspé (2022). A popular guide to blood-sugar spikes and food order. Engaging and practical; its claims run ahead of the trial evidence in places, which is worth keeping in mind.
- Why We Eat (Too Much), Andrew Jenkinson (2020). A bariatric surgeon on appetite, metabolism and refined food. Opinionated, and good on why willpower explains so little.
- Thinking 101, Woo-kyoung Ahn (2022). A psychologist on the reasoning errors that make single studies feel conclusive — useful when two large cohorts point in opposite directions.
Sources
National Academies of Sciences, Engineering, and Medicine, Dietary Reference Intakes, macronutrients summary table. — World Health Organization. Guideline: sugars intake for adults and children (2015). — Centers for Disease Control and Prevention, Get the facts: added sugars, NHANES 2017–2018. — USDA FoodData Central, SR Legacy, nutrients 205, 269 and 291; FDC identifiers are printed in the figure. — US Departments of Agriculture and Health and Human Services, Dietary Guidelines for Americans 2025–2030 (January 2026). — Gardner CD, Trepanowski JF, Del Gobbo LC, et al. JAMA 319(7):667–679 (2018). — Goldenberg JZ, Day A, Brinkworth GD, et al. BMJ 372:m4743 (2021). — Silverii GA, et al. Acta Diabetologica (2020). — Seidelmann SB, Claggett B, Cheng S, et al. Lancet Public Health 3(9):e419–e428 (2018). — Dehghan M, Mente A, Zhang X, et al. Lancet 390(10107):2050–2062 (2017). — Greenwood DC, Threapleton DE, Evans CEL, et al. Diabetes Care 36(12):4166–4171 (2013). — Jenkins DJA, Dehghan M, Mente A, et al. New England Journal of Medicine 384(14):1312–1322 (2021). — Livesey G, Taylor R, Livesey HF, et al. Nutrients 11(6):1280 (2019). — Hosseini F, et al. Scientific Reports 12:2491 (2022). — Rogers NT, Cummins S, Forde H, et al. PLoS Medicine 20(1):e1004160 (2023). — Rogers NT, et al. Journal of Epidemiology and Community Health, doi:10.1136/jech-2023-221051 (2023).