
Trend summary
- Over the long run Australia has fewer accidental house fires for its number of homes, but the picture in 2026 is less comforting: a deadly winter in NSW and a steady rise in battery fires.
- Nationally there were 71.0 accidental residential structure fires per 100,000 households in 2024-25, down from a ten-year high of 85.4 in 2017-18 (Productivity Commission).
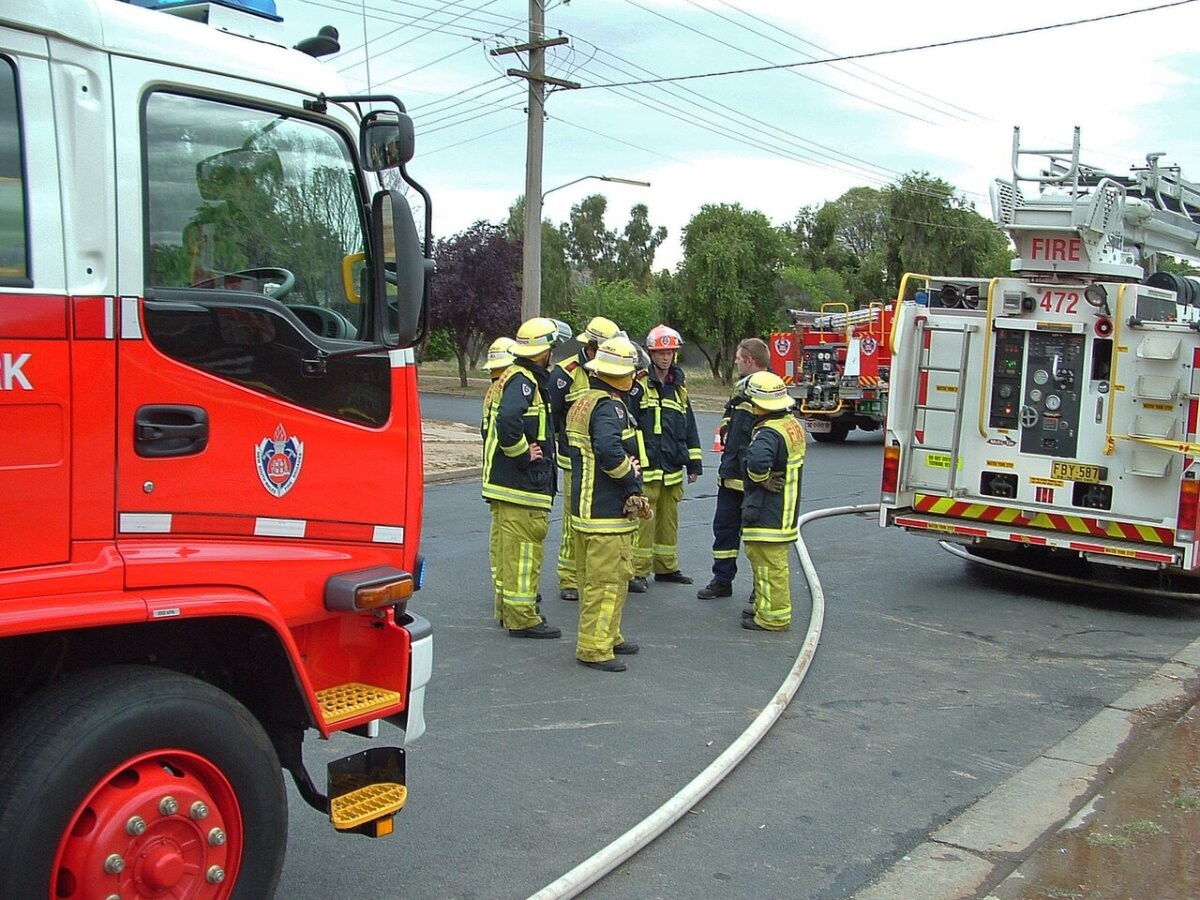
- In NSW, 18 people died in structure fires over winter 2026, double the winter 2025 figure, according to Fire and Rescue NSW.
- Fire and Rescue NSW recorded 332 lithium-ion battery incidents in 2025, about double the 165 of 2022, with e-bikes and e-scooters behind most of them.
What the numbers show
The national benchmark is the Productivity Commission’s Report on Government Services 2026. Fire service organisations attended 472,361 emergency incidents in 2024-25, of which 21.5% were fires. The rate of accidental residential structure fires was 71.0 per 100,000 households, below the ten-year high of 85.4 in 2017-18. Because each state and territory counts incidents in its own way, the national figure is best read as a long-run trend rather than a precise year-to-year change.
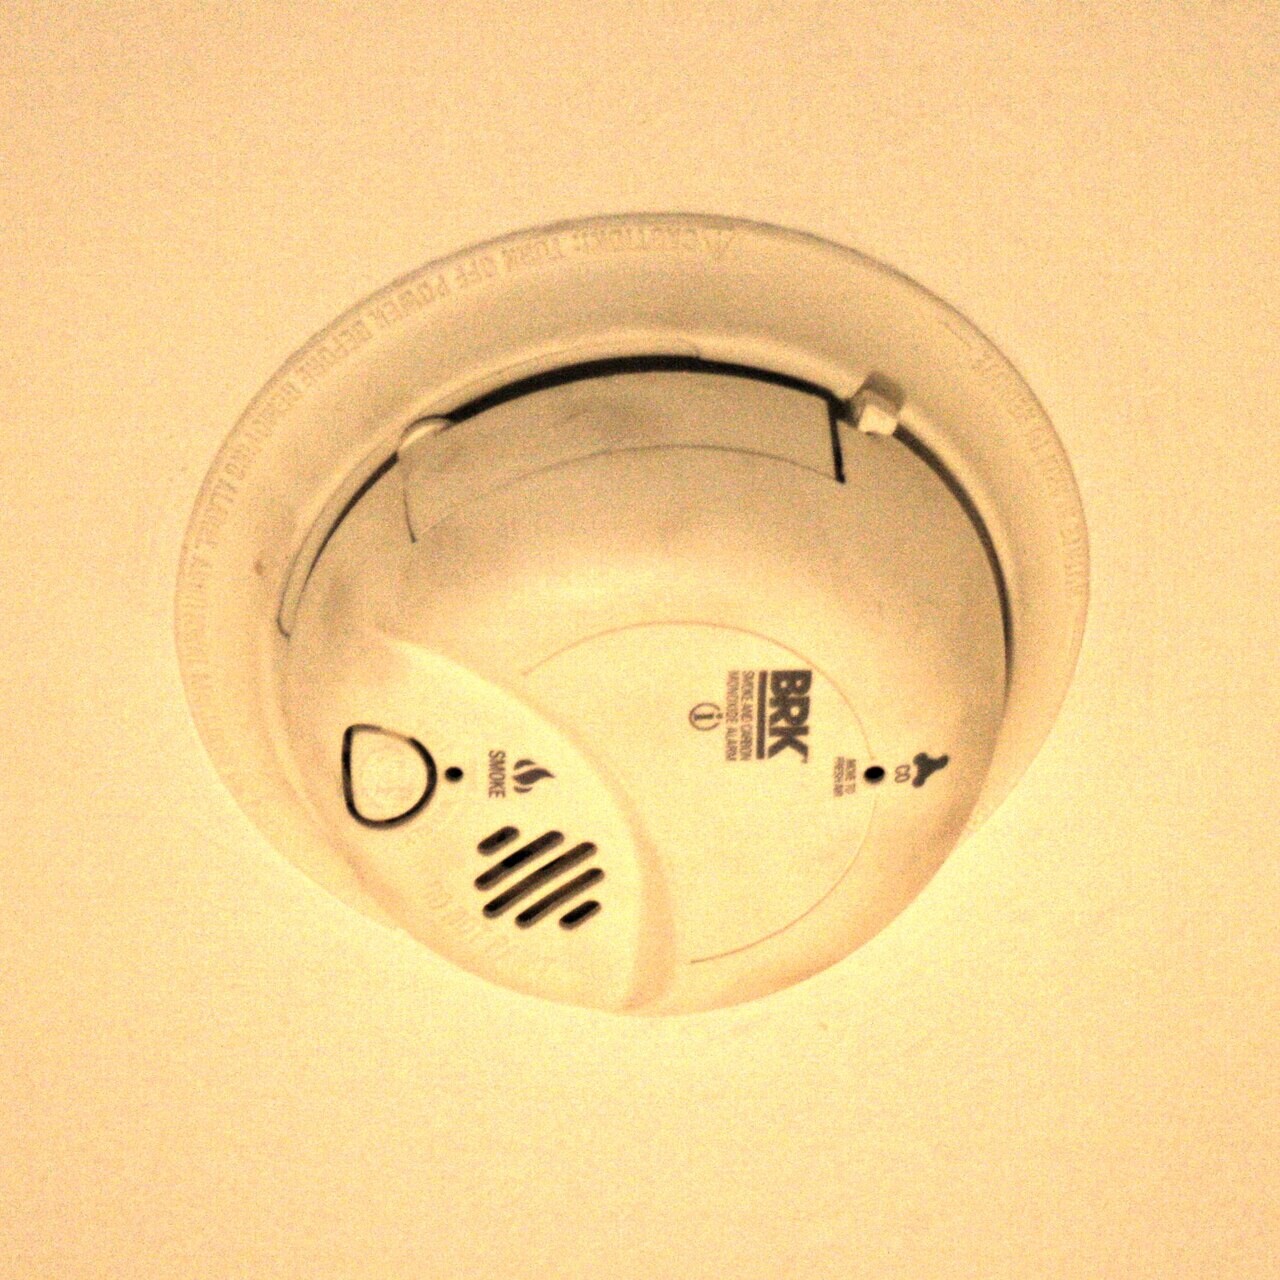
State figures show the human cost. Fire and Rescue NSW reported that 18 people died in dwelling and structure fires across NSW in the three months of winter 2026, double the winter 2025 toll, and that more than four in ten of the homes its crews attended over winter had no working smoke alarm (Newcastle Weekly, reporting FRNSW figures). In Queensland, firefighters responded to more than 1,700 house fires in the 2025-26 financial year (Queensland Fire Department).
What is driving it
Winter is the danger season. Heaters, open fires and overloaded power boards are recurring causes: in May 2026 Fire Rescue Victoria and CFA warned households to keep flammable items away from heaters after a candle left on a wood heater set a Cannons Creek home alight, and in June a Victorian coroner warned about power boards after a fatal house fire at Carisbrook. Missing or broken smoke alarms make these fires deadlier. Queensland’s response is the strictest in the country: from 1 January 2027 every remaining owner-occupied home must have interconnected photoelectric alarms, yet the ABC reported in May 2026 that 1.2 million Queensland homes were not ready.
The newer factor is lithium-ion batteries. The NSW Government says Fire and Rescue NSW recorded 332 battery-related incidents in 2025, and a NSW coronial inquest has heard how exploding batteries caused fires that killed three people, including fires linked to home modifications. Nationally, the government funded the ACCC in May 2026 to develop a consistent safety standard for e-bikes, e-scooters and other e-micromobility devices, with consultation expected by late 2026.
The trend, 2015-16–2024-25
| Year | Per 100,000 households | Change on year before |
|---|---|---|
| 2015-16 | 82.7 | – |
| 2016-17 | 82.1 | −0.7% |
| 2017-18 | 85.4 | +4.0% |
| 2018-19 | 82.5 | −3.4% |
| 2019-20 | 80.2 | −2.8% |
| 2020-21 | 75.4 | −6.0% |
| 2021-22 | 68.6 | −9.0% |
| 2022-23 | 55.6 | −19.0% |
| 2023-24 | 56.4 | +1.4% |
| 2024-25 | 71.0 | +25.9% |
Notes: Financial years. The dip in 2022–23 and 2023–24 is driven largely by Victoria’s figures (its rate fell to about 21–22, then returned to 82 in 2024–25), which looks like a data issue rather than a real fall.
Source: Productivity Commission, Report on Government Services 2026, Table 9A.12
Common questions
Are accidental home fires in Australia going up or down?
In 2024-25 the figure was 71.0 per 100,000 households. That is 14.1% lower than in 2015-16 (82.7) and 25.9% up on 2023-24.
Which year was highest and which was lowest?
In this 2015-16–2024-25 series the highest year was 2017-18 (85.4) and the lowest was 2022-23 (55.6).
Did home fires really fall in 2022–24?
Probably not. Most of the drop comes from Victoria, whose rate fell from 77.4 to about 21 and then bounced back to 82.4 in 2024–25. That pattern points to a change in how fires were recorded, so treat those two years with caution.
Policy and budget changes
The main government measures and money figures behind this risk, newest first. Each item links to the official text we checked; where only a news report was available, the source says so.
Main policy changes
- 1 February 2026 NSW: e-bikes and e-scooters must be certified before sale. NSW: e-bikes, e-scooters and other e-micromobility products must now be certified as meeting safety standards and carry an electrical safety approval mark before they can be sold. (NSW Fair Trading)
- February 2025 NSW: mandatory safety standards for e-mobility batteries. NSW: new mandatory safety standards began to apply to lithium-ion batteries used in e-bikes, e-scooters and other e-mobility devices sold in the state. (NSW Fair Trading)
- 1 January 2022 Queensland: homes sold must have interconnected alarms. Queensland: for sale contracts signed after 31 December 2021, sellers must upgrade the home to interconnected photoelectric smoke alarms before transfer and declare it on the transfer form. (Queensland Fire Department)
- 1 January 2017 Queensland: strictest smoke alarm law begins. Queensland: new smoke alarm rules came into force requiring alarms to meet Australian Standard 3786-2014, with expired or broken alarms replaced by interconnected photoelectric alarms, as the first stage of a ten-year phase-in. (Queensland Fire Department)
Coming up: 1 January 2027 — Queensland: every existing private home, townhouse, unit and manufactured home must have interconnected photoelectric smoke alarms by 1 January 2027. (Queensland Fire Department)
Budget and costs
- 3 February 2026 A$7.4 billion spent on fire and emergency services. Governments spent a total of A$7.4 billion on fire services and state and territory emergency services in 2024–25 (Productivity Commission). (Productivity Commission (Report on Government Services 2026))
- 3 February 2026 Fire service revenue up 4.4% in real terms. Total revenue of fire service organisations was A$6.6 billion in 2024–25, a real increase of 4.4% from 2023–24. (Productivity Commission (Report on Government Services 2026))
Recent cases
- 31 October 2026: lightning strikes the roof of a double-storey home in Macleod, Melbourne, setting the top floor alight; the occupants and neighbours escape unhurt and crews control the fire in 21 minutes (Fire Rescue Victoria).
- 1 October 2026: the Queensland Fire Department, citing a Bulimba house fire where a smoke alarm woke a family in time, says crews attended more than 1,700 house fires last financial year and urges owners to meet the 2027 interconnected alarm deadline (QFD).
- 8 September 2026: Fire and Rescue NSW repeats its “Never Bin A Battery” warning after two garbage truck fires in one day, possibly caused by batteries thrown in household bins (FRNSW).
- 13 August 2026: after two elderly people die in separate house fires in Western Sydney and on the NSW South Coast, the Fire Commissioner urges households to boost their fire protection (FRNSW).
Our read: what the numbers add up to
Two timescales point in different directions here. Over the long run the rate of accidental residential fires has fallen, from a ten-year high of 85.4 per 100,000 households in 2017-18 to 71.0 in 2024-25. In the short run, though, NSW had a grim winter in 2026, with 18 deaths in structure fires, double the winter 2025 toll. I am more confident in the first trend than in the second, because one season’s deaths in one state are small numbers that can swing sharply.
The detail that connects those two trends is the smoke alarm. Fire and Rescue NSW found that more than four in ten homes its crews attended over winter had no working alarm, which suggests the fires that still happen are concentrated where basic protection is missing. A falling fire rate and a deadly winter can coexist if prevention has reached most homes but not the most vulnerable ones. The other shift is the source of ignition. Lithium-ion battery incidents in NSW rose to 332 in 2025, about double the 165 of 2022, and they are tied mostly to e-bikes and e-scooters rather than to heaters or candles. That looks like a new risk added on top of the traditional winter causes, not one replacing them.
The caveats are familiar. States count incidents in their own way, so the national rate is best read as a long-run trend, and the NSW winter figure covers a single season. What I would watch next is Queensland, where every remaining owner-occupied home must have interconnected photoelectric alarms from 1 January 2027, even though 1.2 million homes were reported not ready; it will be a natural test of whether stricter alarm rules cut deaths. My bottom line: the long-term decline in house fires looks genuine, but the fires that remain are deadliest where alarms are missing, and batteries are a growing new source.
Press releases and official reports, 2023–2026
Five key releases a year for the last four years, newest first. Most come from Australian Government agencies, state and territory agencies, regulators, accident investigators and national statistics; a few news reports are included where they are the clearest public record of an event. Releases from 2007–2022 are in the expandable list after 2023.
2026
- 1 Oct 2026Queensland Fire Department“Without that smoke alarm, we don’t wake up”
- 8 Sep 2026Fire and Rescue NSWTwo garbage truck fires prompt reminder: Never Bin A Battery
- 21 Aug 2026Fire and Rescue NSW163 new firefighters join Fire and Rescue NSW during deadly winter for house fires
- 6 Aug 2026Fire and Rescue NSWHome fire escape plans urged after Wiley Park tragedy
- 7 Apr 2026NSW GovernmentNSW leads the country in battery reform to fight fires and pollution
2025
- 15 Dec 2025ABC NewsNSW inquest told how exploding lithium-ion batteries caused volatile fires killing three
- 24 Nov 2025NSW EPAOne battery can spark a blaze: NSW EPA expands statewide safety campaign
- 7 Nov 2025ABC NewsEmerald community grieving after four people die in central Queensland house fire
- 21 Feb 2025ABC NewsFire and Rescue NSW statistics reveal lithium-ion battery fire hot spots across Sydney, e-bikes and e-scooters to blame
- 10 Feb 2025ABC NewsNSW firefighters battling more than one lithium-ion battery fire a day this month, fire commissioner fears more fatalities
2024
- 6 Dec 2024NSW EPAConsumers urged to choose quality batteries this sale season after record number of fires
- 14 Jun 2024Fire and Rescue NSWLucky escape from house fire prompts neighbourhood safety checks
- 29 May 2024Fire and Rescue NSWHouseholds warned against smoke alarm complacency this winter
- 4 Apr 2024Fire and Rescue NSWFire Commander urges extra community vigilance after spate of residential fires
- Jan 2024Productivity CommissionReport on Government Services 2024, Part D: Emergency management
2023
- 5 Oct 2023ACCCConsumers urged to use and store lithium-ion batteries safely to prevent deadly fires
- Oct 2023ACCCLithium-ion batteries and consumer product safety
- 6 Sep 2023Fire and Rescue NSWPasser-by saves neighbour from e-scooter fire
- 26 Jun 2023Fire and Rescue NSWFire and Rescue NSW reinforces Lithium-Ion battery safety warnings after another two dangerous incidents
- 18 Apr 2023Fire and Rescue NSWFire and Rescue NSW warns public to safeguard homes from Lithium-ion battery risks
View 20 years of major Australian home fire press releases (2007–2026)32 more from 2007–2022, up to five a year, newest first
2022
- 17 Sep 2022ABC NewsFears fires caused by lithium-ion batteries will ‘increase considerably’ as popularity of electric scooters rises
- 20 Apr 2022ABC NewsQueensland fire alarm legislation — what home owners need to know
- Jan 2022Productivity CommissionReport on Government Services 2022, Section 9: Emergency services for fire and other events
2021
- 24 Aug 2021ABC NewsSmoke alarm laws still being rolled out a decade after Queensland’s deadly Slacks Creek house fire
- Jan 2021Productivity CommissionReport on Government Services 2021, Section 9: Emergency services for fire and other events
2020
- Jan 2020Productivity CommissionReport on Government Services 2020, Section 9: Emergency services for fire and other events
2019
- Jan 2019Productivity CommissionReport on Government Services 2019, Chapter 9: Emergency services for fire and other events
2018
- 18 Dec 2018ABC NewsFormer fire safety researcher says smoke alarm cover-up allegations are ‘conspiracy theories’
- 6 Aug 2018ABC NewsUS move to beef up smoke alarm laws set to spark more debate in Australia
- 27 Jul 2018ABC NewsAustralians could die unnecessarily in house fires due to smoke alarm policies, claims senior US firefighter
- 22 Jan 2018ABC NewsNSW Fire and Rescue say research settles smoke alarm safety debate, critics disagree
- Jan 2018Productivity CommissionReport on Government Services 2018, Chapter 9: Emergency services for fire and other events
2017
- Jan 2017Productivity CommissionReport on Government Services 2017, Chapter 9: Emergency services for fire events
2016
- 1 Sep 2016ABC NewsTougher Queensland smoke alarm laws to be phased in from next January
- 20 Jul 2016ABC NewsHigh number of WA winter house fires prompts safety warning
- 2 Mar 2016ABC NewsElectrical cable could become fire risk in Australian homes within weeks, ACCC warns
- 23 Feb 2016ABC NewsQueensland Government moves to mandate photoelectric smoke alarms in bedrooms
- Jan 2016Productivity CommissionReport on Government Services 2016, Chapter 9: Fire and ambulance services
2015
- 5 Dec 2015ABC NewsMatt Golinski fire: Christmas tree lights or power board ‘likely cause’ of fatal blaze at TV chef’s home
- 16 Jun 2015ABC NewsBedroom added to ‘unsafe’ apartment before Bankstown fire led to Connie Zhang’s death: inquest
- Jan 2015Productivity CommissionReport on Government Services 2015, Chapter 9: Fire and ambulance services
2014
- 19 Sep 2014ABC NewsLogan fire inquest: Impossible to determine cause of Slacks Creek house blaze that killed 11 people
- 21 Aug 2014ABC NewsLogan fire inquest: Queensland Fire and Rescue Service wants stronger smoke alarm regulations
- 19 Aug 2014ABC NewsLogan fire inquest: Family say there will never be closure as witnesses describe fatal house blaze
- Jan 2014Productivity CommissionReport on Government Services 2014, Chapter 9: Fire and ambulance services
2013
- 31 Jan 2013Productivity CommissionReport on Government Services 2013, Chapter 9: Fire and ambulance services
2012
- 31 Jan 2012Productivity CommissionReport on Government Services 2012, Chapter 9: Fire, road rescue and ambulance
2011
- 28 Jan 2011Productivity CommissionReport on Government Services 2011, Chapter 9: Emergency management
2010
- 29 Jan 2010Productivity CommissionReport on Government Services 2010, Chapter 9: Emergency management
2009
- 30 Jan 2009Productivity CommissionReport on Government Services 2009, Chapter 9: Emergency management
2008
- 31 Jan 2008Productivity CommissionReport on Government Services 2008, Chapter 9: Emergency management
2007
- 31 Jan 2007Productivity CommissionReport on Government Services 2007, Chapter 8: Emergency management
Some early years list fewer than five items. Many older Australian government releases are no longer online at their original addresses, and we only list items we could find and check.
Photo list
How this page is built. Figures come from the official statistical releases linked above; where agencies publish provisional numbers we say so, because they are revised. Australian statistics are often published separately by each state and territory, and financial years run from July to June, so we say which area and period each figure covers. Photos are public-domain or Creative Commons images credited in each caption; file photos are illustrative and are not from the events described unless the caption says so. This page tracks trends and is not personal safety, medical, legal or financial advice.