
This section tracks how often things go wrong in Australia, and whether it is getting better or worse. Each page gives a short trend summary, the numbers behind it, recent cases, 20 years of official press releases and a credited photo list. Figures come from Australian Government agencies, regulators and accident investigators first (BITRE, ATSB, AMSA, Geoscience Australia, ACCC and the National Anti-Scam Centre, ASIC, ABS, AIHW, the Australian CDC and Safe Work Australia), then from state and territory fire, health and transport agencies and national bodies such as AFAC and Royal Life Saving. Many Australian statistics are published by state or territory, or by financial year (July to June), and each page says which area and period a figure covers.
Where the trends point
- Getting worse: road deaths, bushfire risk, flu and whooping cough, falls and drug-induced deaths, battery fires.
- Getting better: accidental house fires per household, light aircraft deaths, work deaths, heart disease and cancer death rates; scam losses are below their 2022 peak.
- No clear trend: earthquakes and maritime accidents, where single events dominate.
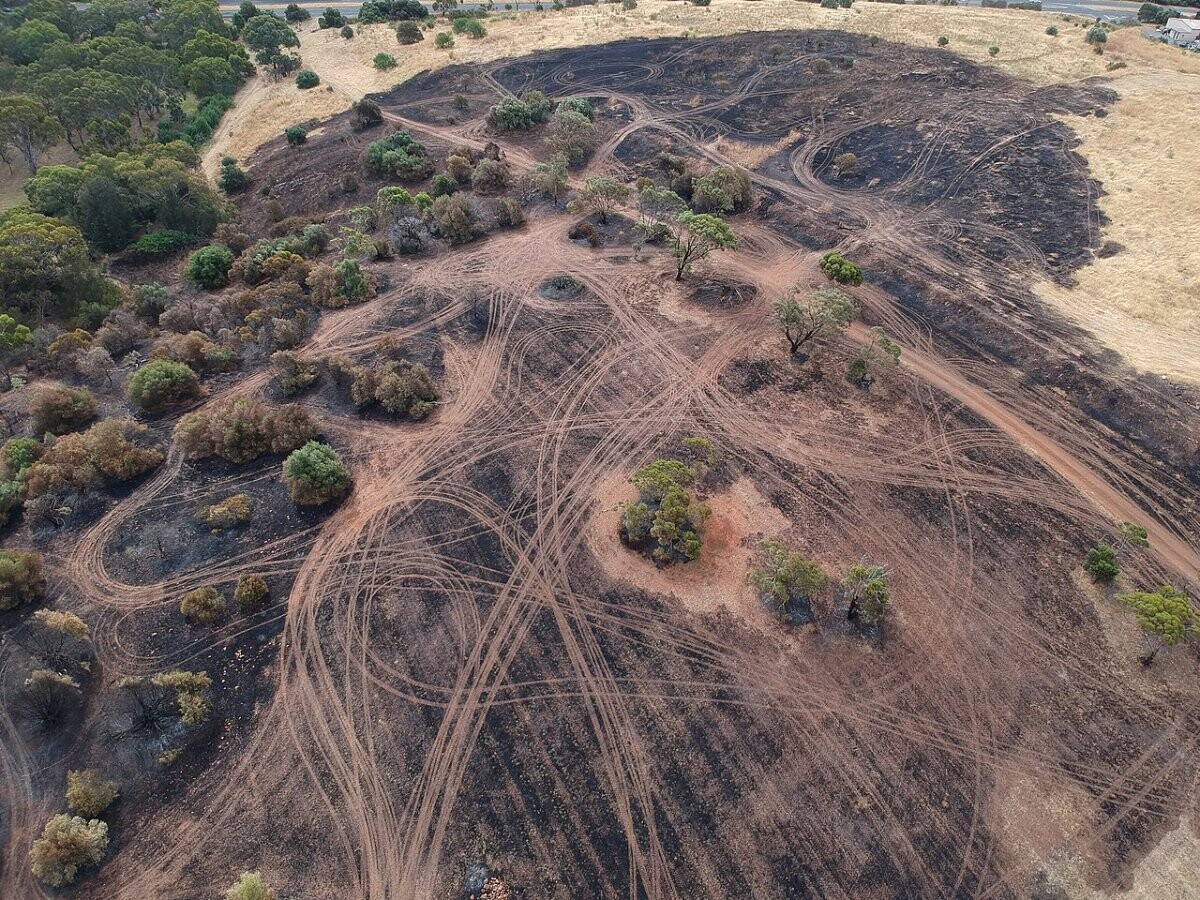 Fewer house fires, bigger bushfires
Fire
Home fires, building fires and bushfires.
 No clear long-term trend
Earthquakes
About 100 quakes of magnitude 3+ a year; a magnitude 5.5 in South Australia in April 2026.
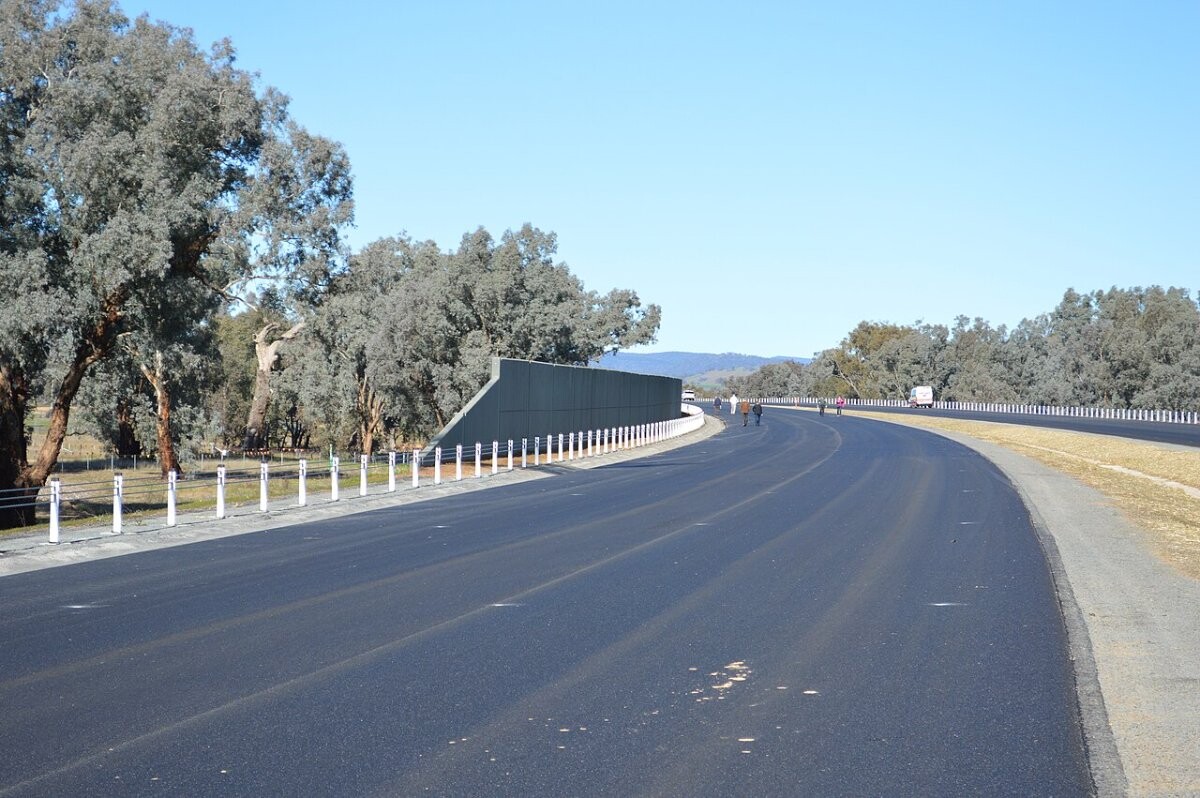 Roads worse
Transport accidents
Road, maritime and aviation.
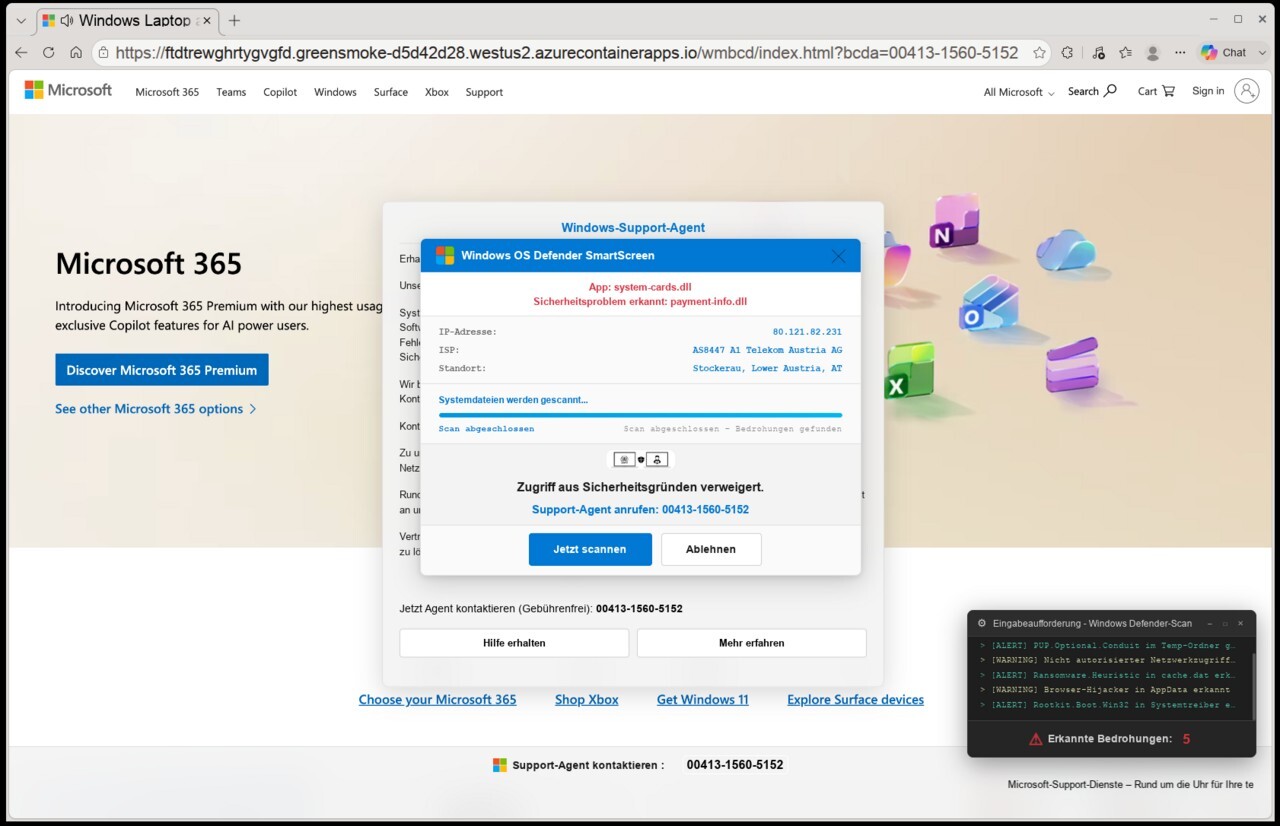 Below peak, rising again
Financial fraud
$2.18 billion lost to scams in 2025, up 7.8%.
 Mixed
Disease
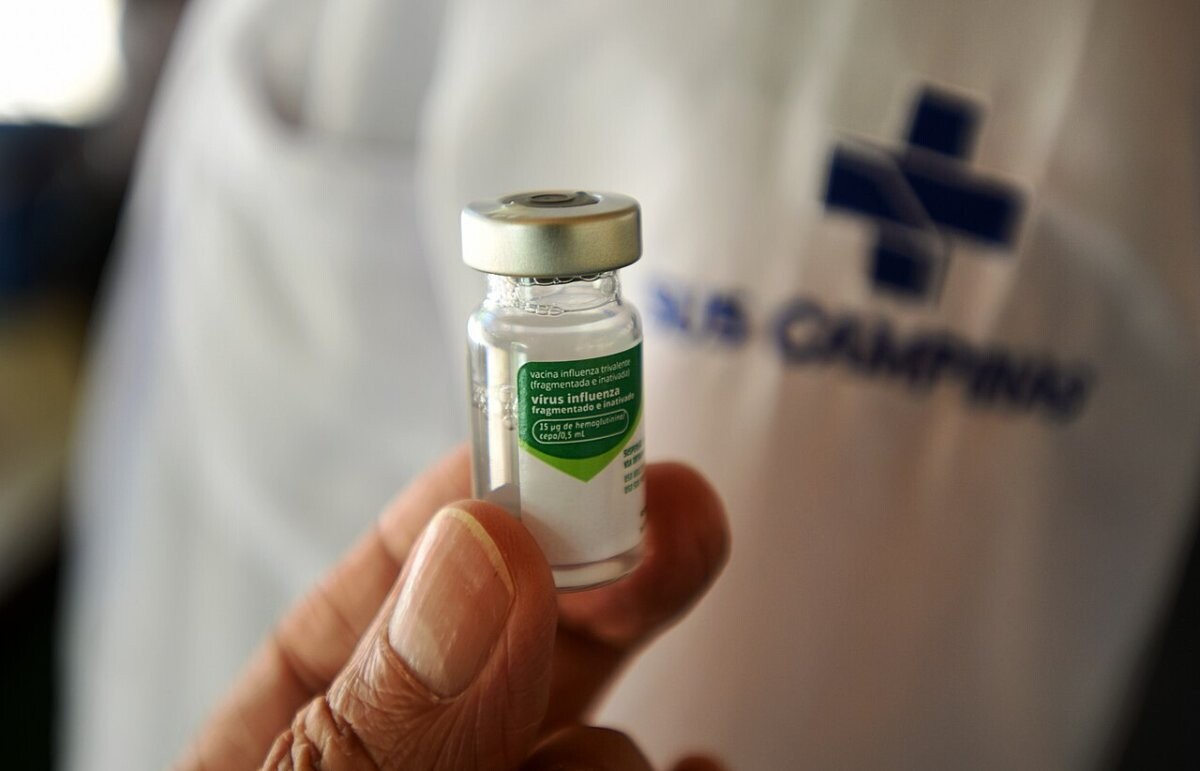
Infectious and chronic disease.
 Falls and overdoses up
Injuries
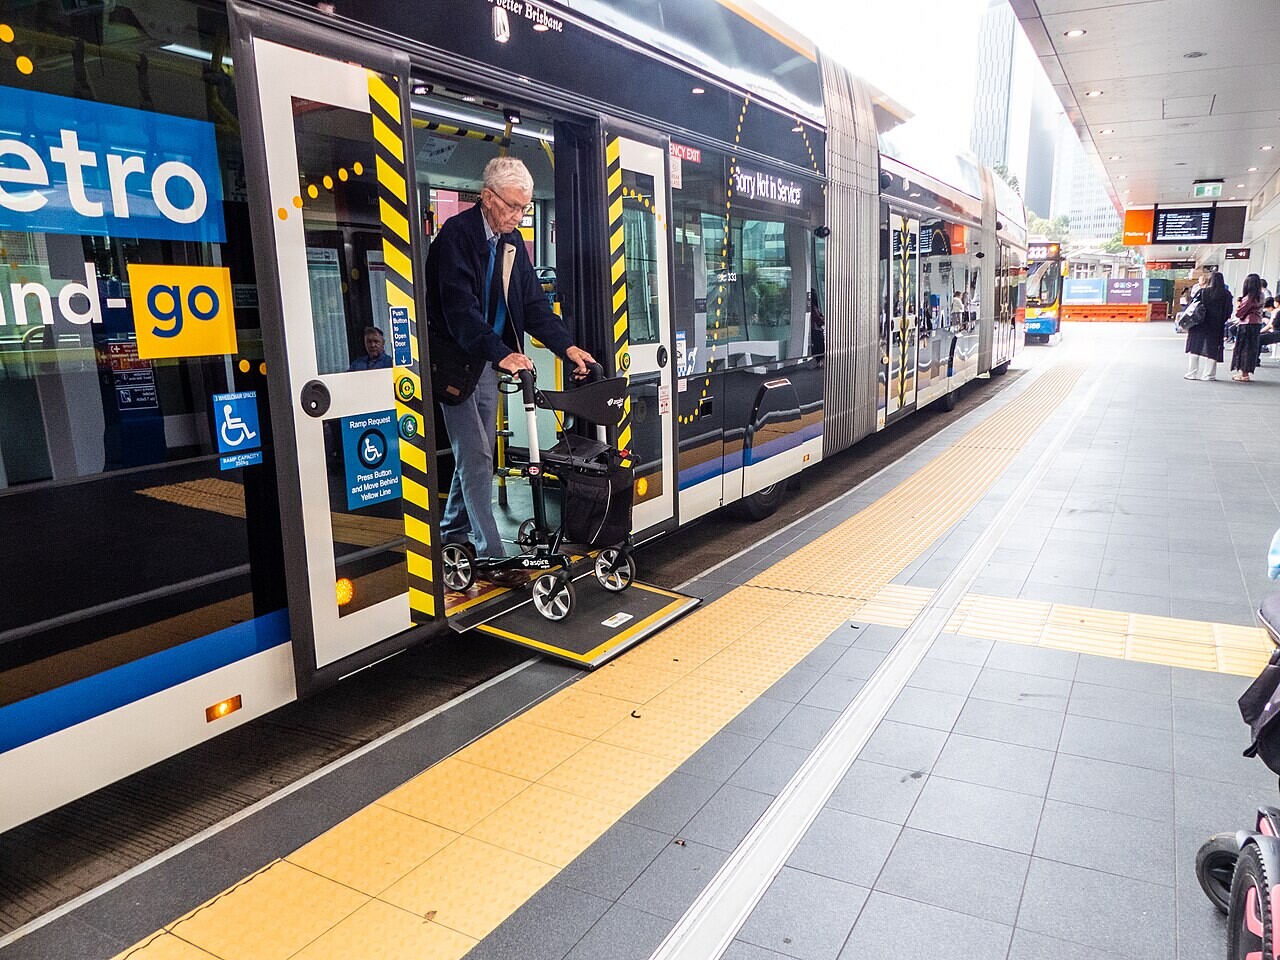
253,800 fall hospitalisations in 2024-25; record drug-induced deaths.
How this page is built. Figures come from the official statistical releases linked above; where agencies publish provisional numbers we say so, because they are revised. Australian statistics are often published separately by each state and territory, and financial years run from July to June, so we say which area and period each figure covers. Photos are public-domain or Creative Commons images credited in each caption; file photos are illustrative and are not from the events described unless the caption says so. This page tracks trends and is not personal safety, medical, legal or financial advice.