
This section tracks how often things go wrong in France, and whether it is getting better or worse. Each page gives a short trend summary, the numbers behind it, recent cases, up to 20 years of official press releases and a credited photo list. Figures come from national sources first: ONISR for road deaths, the Ministry of the Interior’s civil security and crime statistics, Santé publique France and Inserm’s cause-of-death centre (CépiDc), the BEA and BEAmer accident investigation bureaus, BRGM and the national seismic network, and the Banque de France’s payment-security observatory. Parliament, researchers and news reports fill the gaps. Some figures cover metropolitan France only and others include the overseas departments, so each page says which.
Where the trends point
- Getting worse: wildfire area (a record 2026 season), phone and manipulation scams, heat deaths, mosquito-borne disease, measles and whooping cough, and diabetes and obesity.
- Getting better: smoking, card fraud, and the number of fires attended by fire services.
- No clear trend: road deaths (on a plateau since 2013), air and boating deaths, and earthquakes, which are rare but can be damaging.
 Mixed
Fire
Home fires, building fires and wildfires.
 Rare but damaging
Earthquakes
Le Teil’s shallow Mw 4.9 quake in 2019 forced 1,000+ people from homes; the Antilles sit in zone 5.
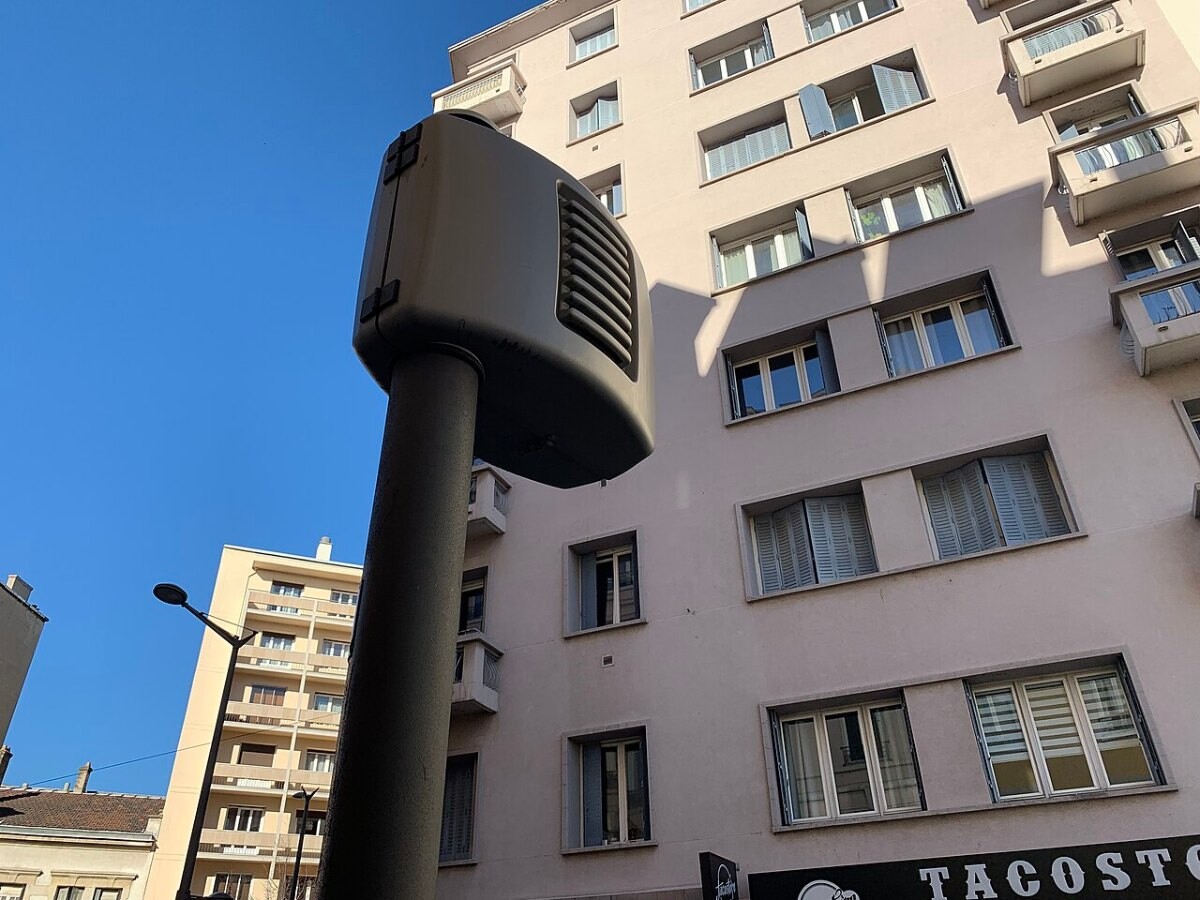 Road deaths flat
Transport accidents
Road, maritime and aviation.
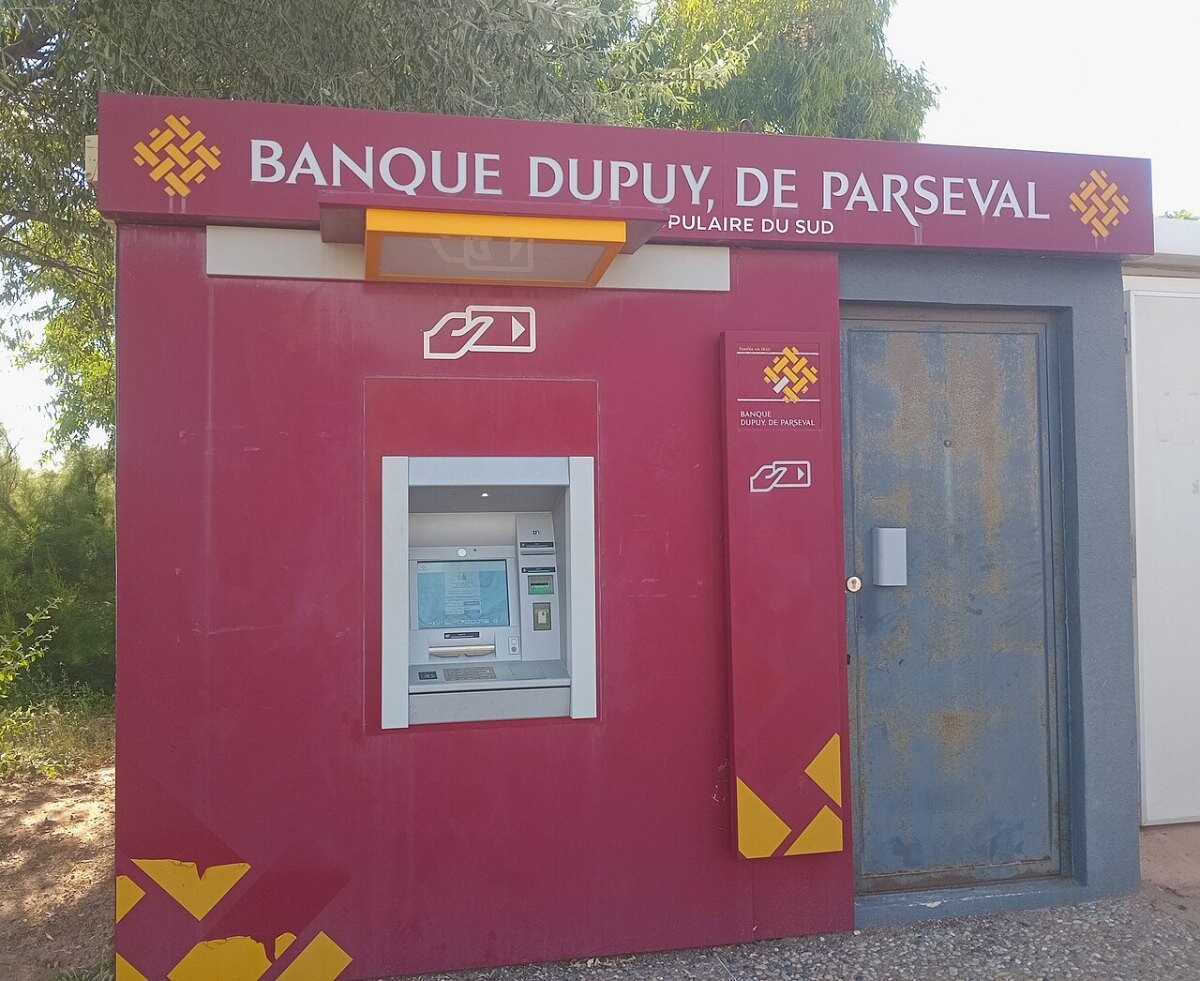 Scams rising
Financial fraud
Payment fraud hit €1.24bn in 2025; manipulation scams rose 34% to €516m.
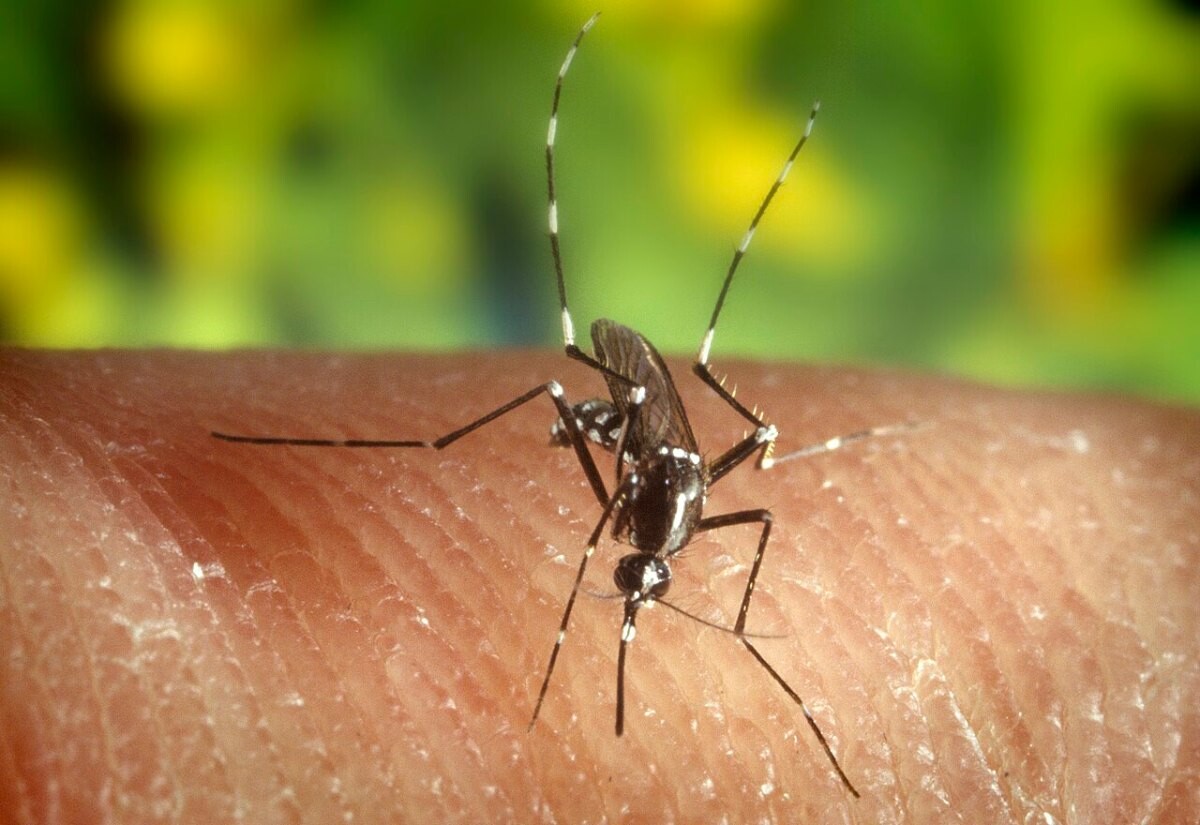 Mixed
Disease
Infectious and chronic disease.
 Deaths rising
Injuries
24,211 everyday-accident deaths in 2016, nearly half from falls; heat deaths are climbing.
How France compares with the EU
A quick benchmark from Eurostat, the EU statistics office. France does far better than the EU on heart disease, roughly matches it on roads and falls, and does worse on overall accidental deaths and card fraud.
| Indicator | France | EU-27 | Year |
|---|---|---|---|
| Road deaths per 100,000 | 4.6 | 4.4 | 2024 |
| Accidental deaths per 100,000* | 39.6 | 34.7 | 2023 |
| Fall deaths per 100,000* | 13.5 | 13.6 | 2023 |
| Circulatory disease deaths per 100,000* | 163.3 | 313.0 | 2023 |
| Cancer deaths per 100,000* | 218.6 | 233.1 | 2023 |
| People hit by card fraud | 5.4% | 2.2% | 2019 |
* Age-standardised rates. Sources: Eurostat sdg_11_40, hlth_cd_asdr2 and isoc_cisci_pb, accessed through the EU open data API on 21 October 2026.
How this page is built. Figures come from the official statistical releases and research linked above; where agencies publish provisional numbers we say so, because they are revised. National death data come from Inserm’s cause-of-death centre (CépiDc) and take two to three years to finalise, and some figures cover metropolitan France only while others include the overseas departments, so we say which year, area and source each figure covers. Money is given in euros. Headlines and quotes are our translations from French. Photos are public-domain or Creative Commons images credited in each caption; file photos are illustrative and are not from the events described unless the caption says so. This page tracks trends and is not personal safety, medical, legal or financial advice.