
This section tracks how often things go wrong in the United Kingdom, and whether it is getting better or worse. Each page gives a short trend summary, the numbers behind it, recent cases, 20 years of official press releases and a credited photo list. Figures come from government departments, regulators and accident investigators first (MHCLG, DfT, MAIB, AAIB, BGS, ONS, UKHSA and HSE), then from national bodies such as UK Finance, RoSPA and the National Water Safety Forum. Many UK statistics are published separately for England, Wales, Scotland and Northern Ireland, and each page says which area a figure covers.
Where the trends point
- Getting worse: wildfire area, fraud losses, measles and whooping cough, falls and drug deaths, serious road injuries.
- Getting better: home fire deaths, road deaths, drowning, workplace deaths, cancer death rates.
- No clear trend: earthquakes and aviation, where single events dominate.
 Homes safer, wildfire up
Fire
Home fires, building fires and wildfires.
 Frequent but small
Earthquakes
327 detected in 2025, 25 felt; the largest onshore was M3.7.
 Mixed
MixedTransport accidents
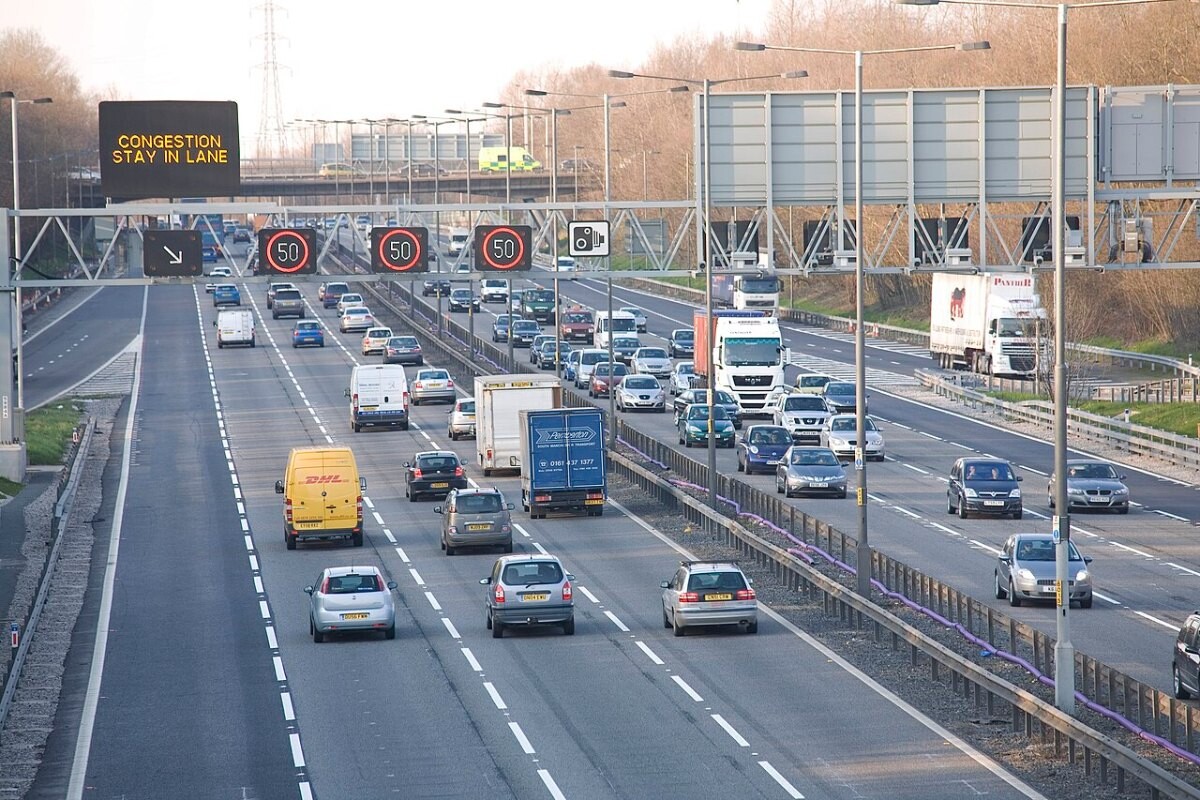
Road, maritime and aviation.
 Losses rising
Financial fraud
£1.28 billion stolen through payment fraud in 2025.
 Mixed
MixedDisease
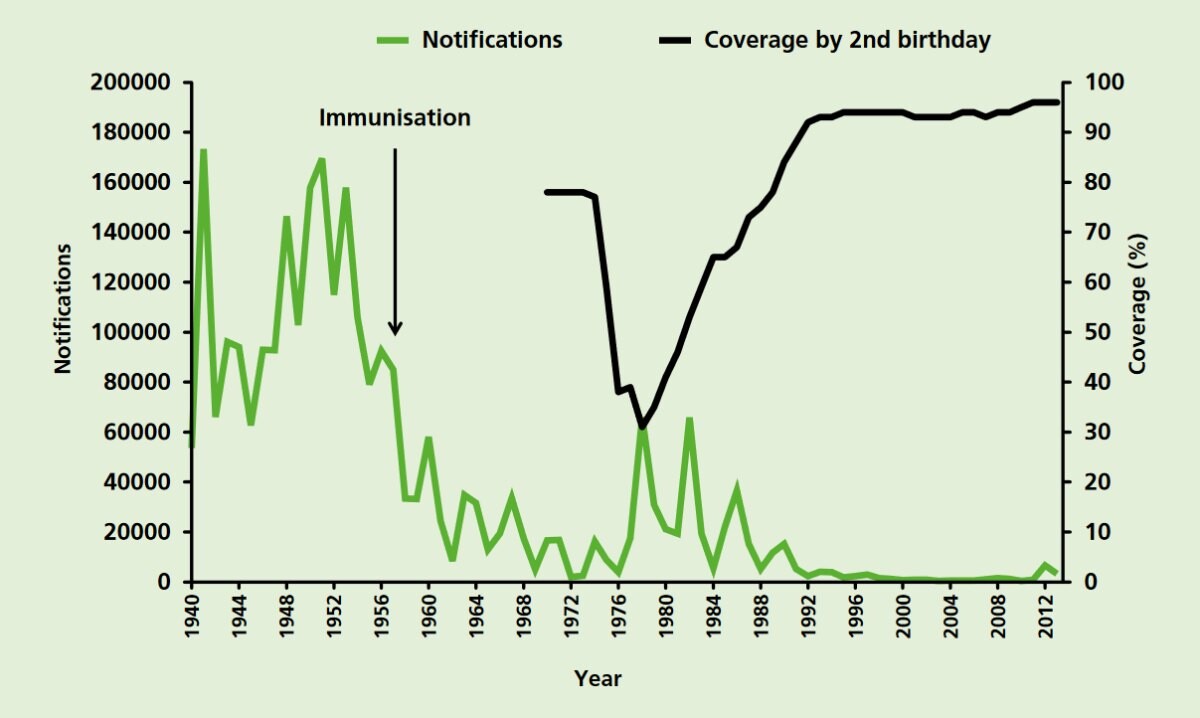
Infectious and chronic disease.
 Home accidents rising
Injuries
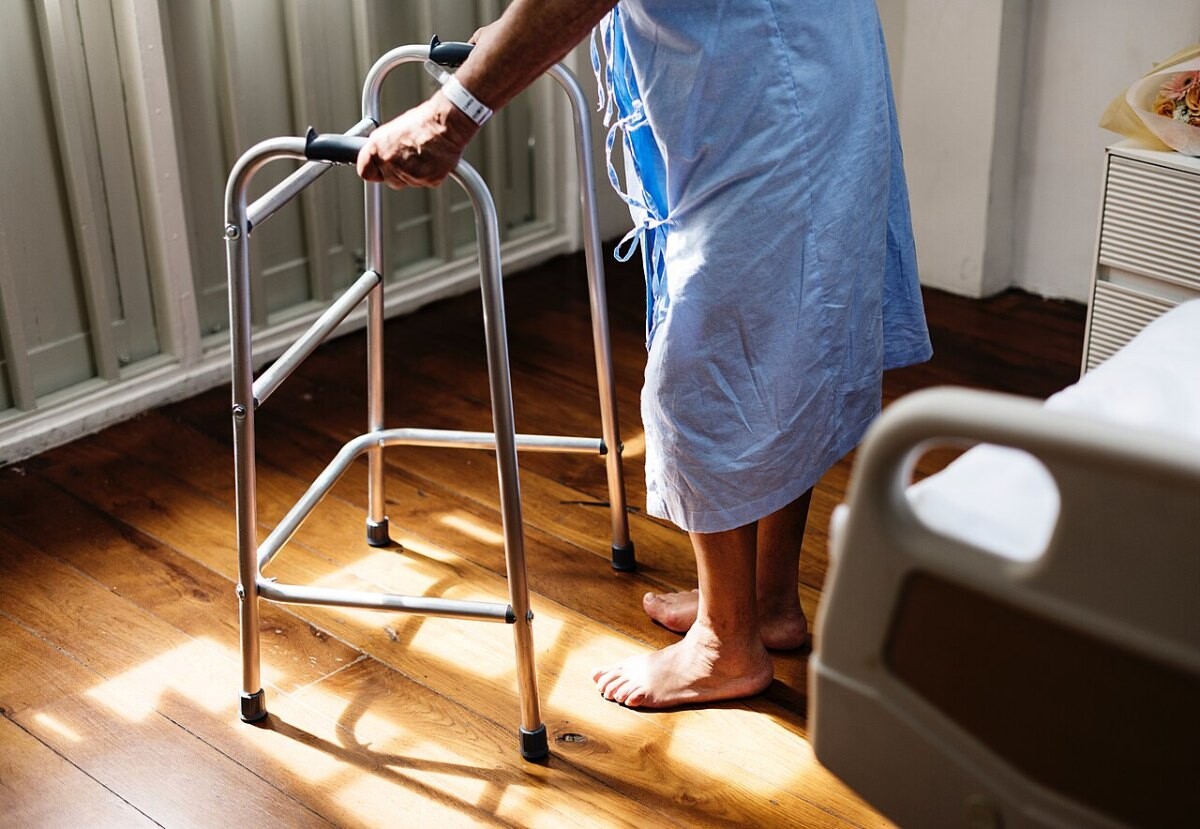
Falls and drug deaths rising; workplace deaths at a record low.
How this page is built. Figures come from the official statistical releases linked above; where agencies publish provisional numbers we say so, because they are revised. UK statistics are often published separately for England, Wales, Scotland and Northern Ireland, so we say which area each figure covers. Photos are public-domain, Creative Commons or Open Government Licence images credited in each caption; file photos are illustrative and are not from the events described unless the caption says so. This page tracks trends and is not personal safety, medical, legal or financial advice.