
This section tracks how often things go wrong in the United States, and whether it is getting better or worse. Each page gives a short trend summary, the numbers behind it, the latest official press releases and a credited photo list. Figures come from federal agencies first (USFA, NIFC, USGS, NHTSA, the Coast Guard, NTSB, FTC, FBI and CDC), then from national bodies such as NFPA and the National Safety Council.
Where the trends point
- Getting worse: fire deaths, wildfire area in 2026, fraud losses, measles, older-adult falls.
- Getting better: road deaths, recreational boating deaths, the overall death rate from chronic disease.
- No clear trend: earthquakes and aviation, where single events dominate.
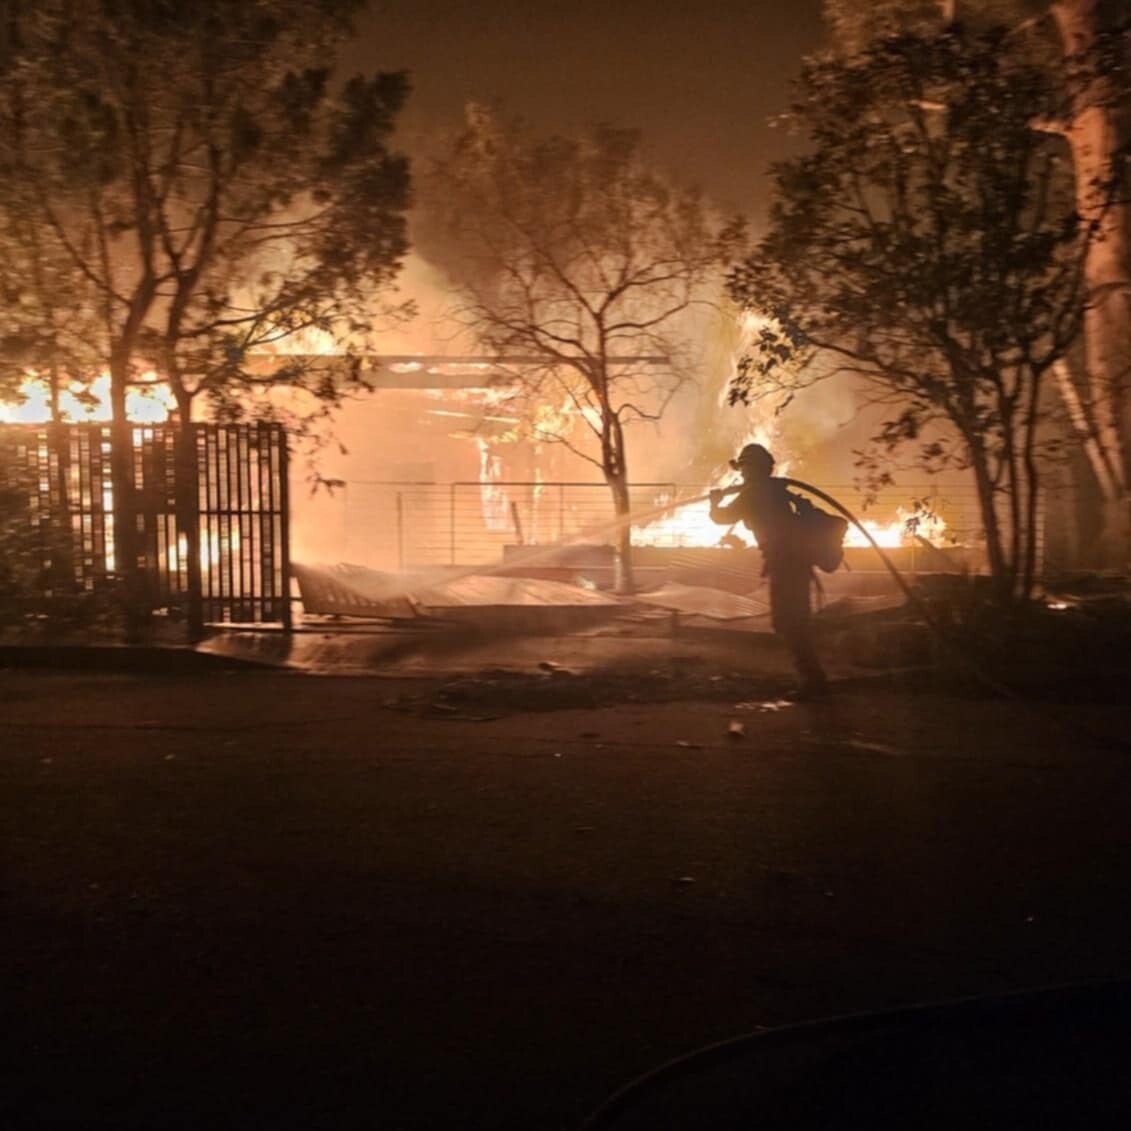 Deaths rising
Fire
Home fires, building fires and wildfires.
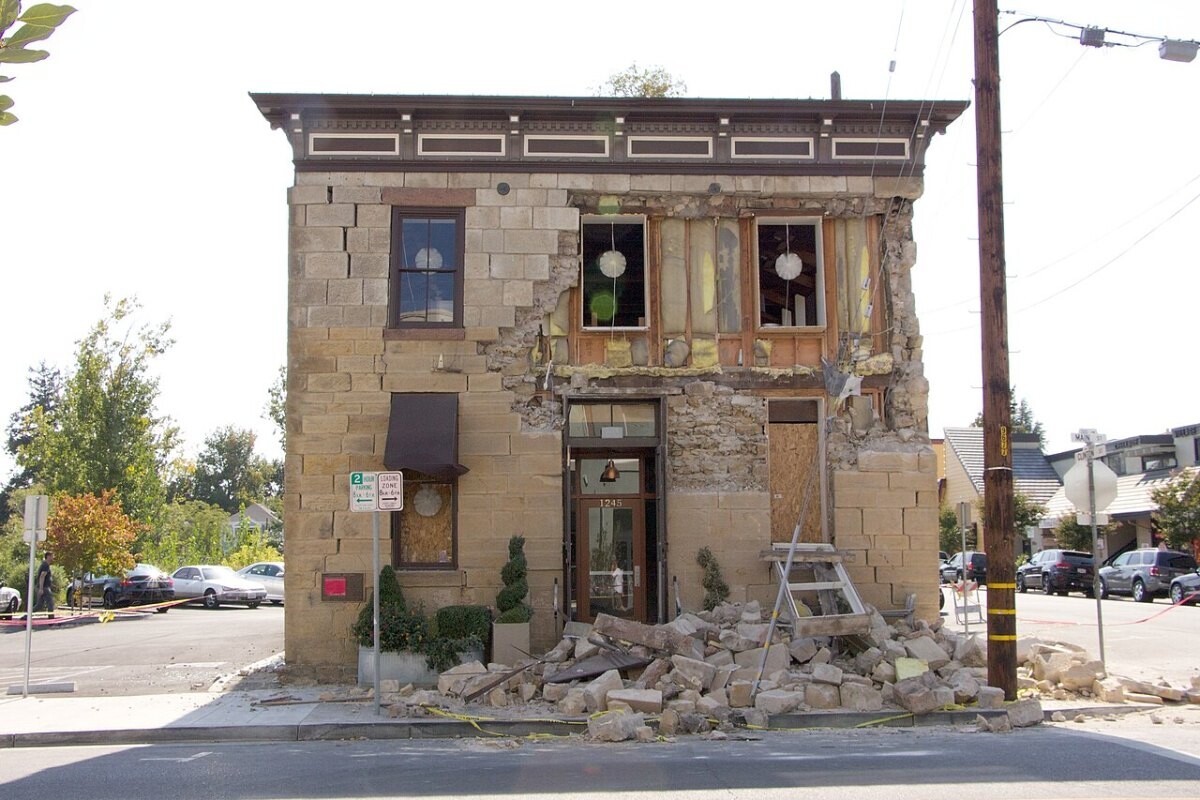 Low activity
Earthquakes
A quiet 2026 on a map where 75% of the country is exposed.
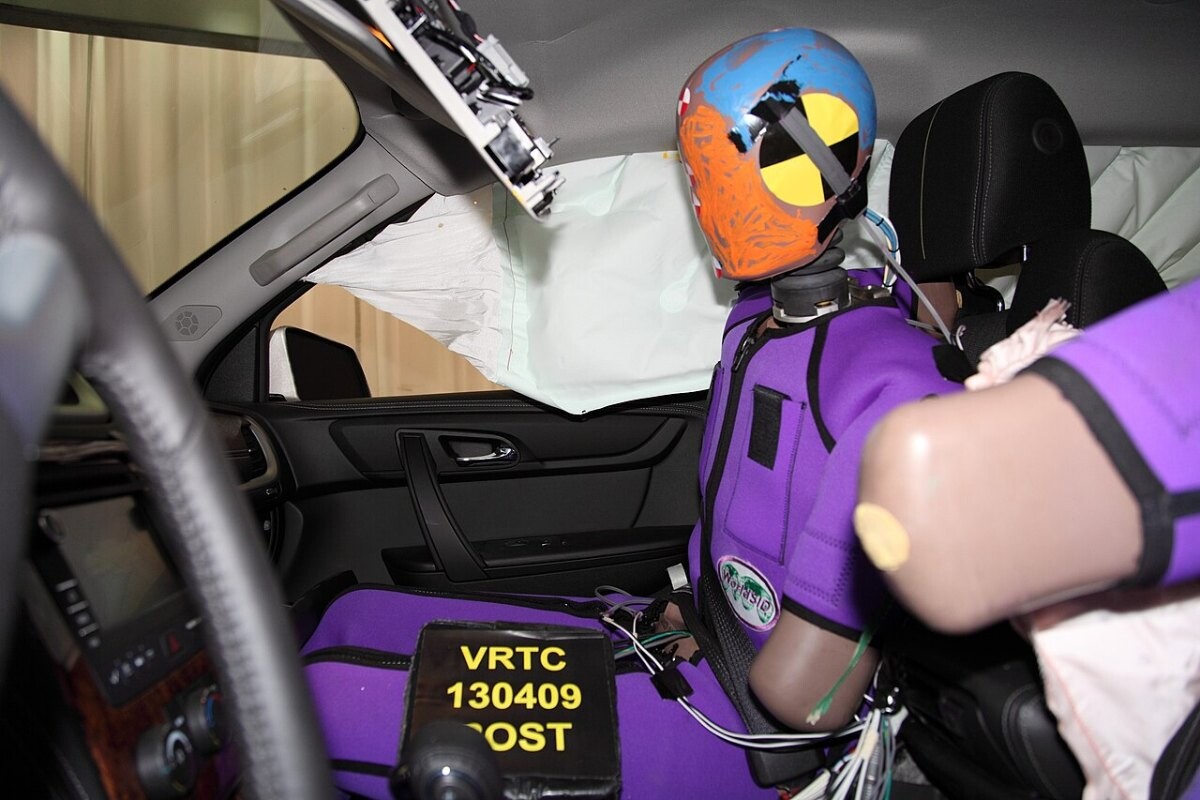 Mostly falling
Transport accidents
Road, maritime and aviation.
 Losses rising
Financial fraud
$15.9 billion reported lost to fraud in 2025.
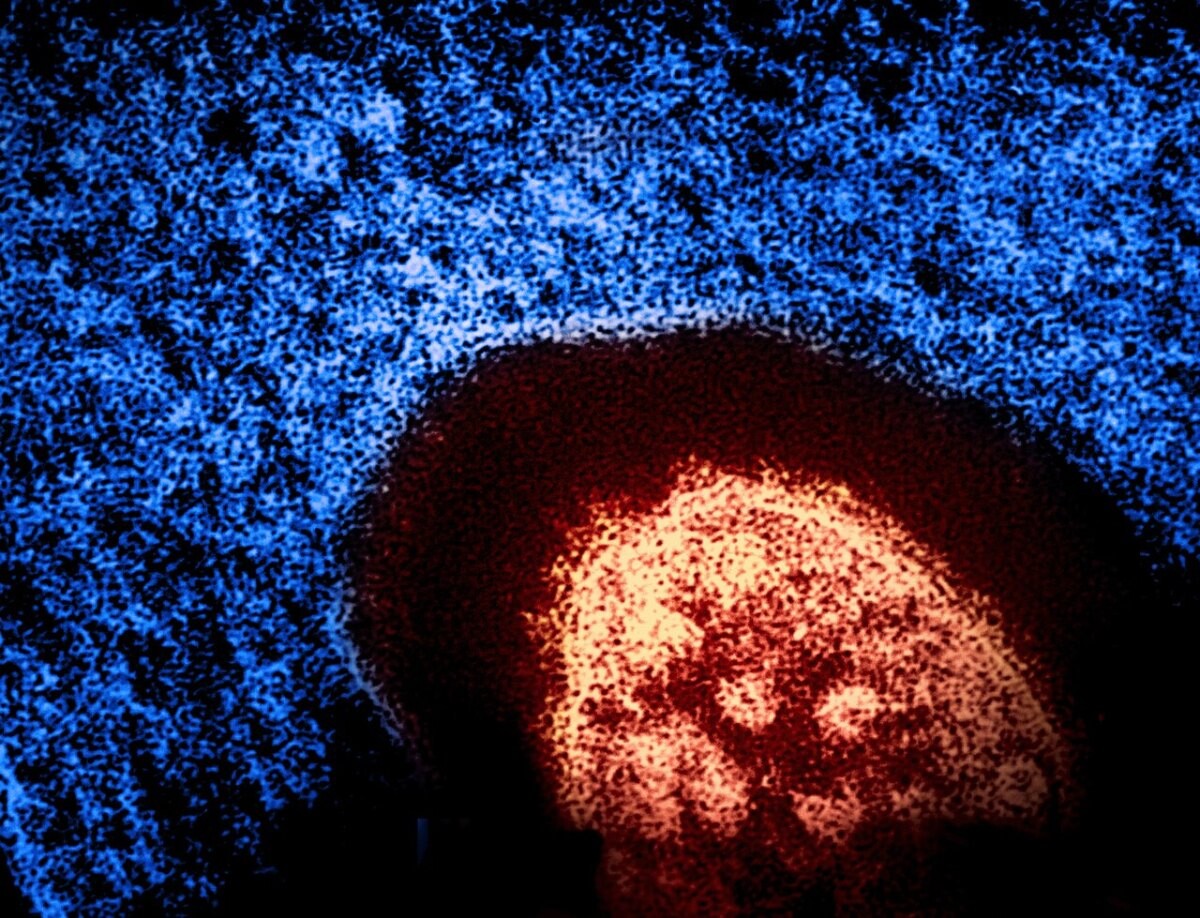 Mixed
MixedDisease
Infectious and chronic disease.
 Mixed
MixedInjuries
Unintentional injuries and the rise in older-adult falls.
How this page is built. Figures come from the official statistical releases linked above; where agencies publish preliminary numbers we say so, because they are revised. Photos are public-domain or Creative Commons images credited in each caption; file photos are illustrative and are not from the events described unless the caption says so. This page tracks trends and is not personal safety, medical, legal or financial advice.