
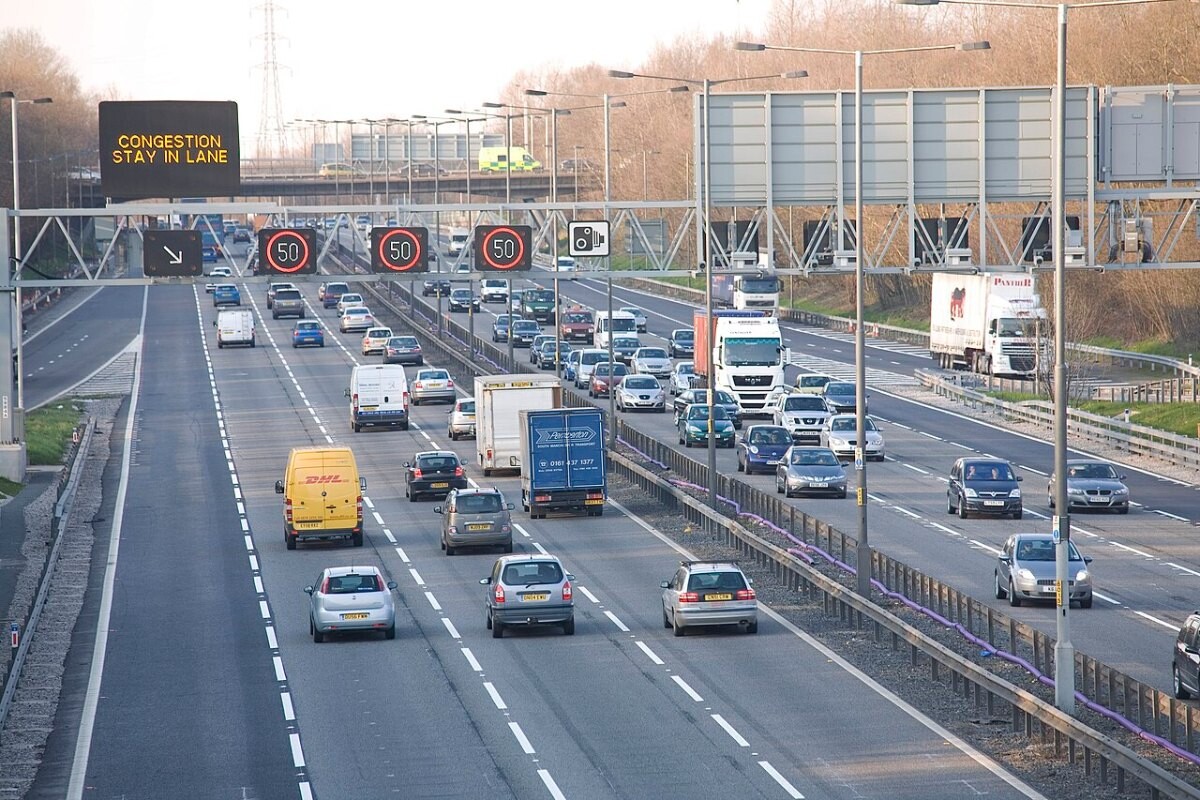
Trend summary
- British roads are among the safest in the world, and they are getting slightly safer for the people most likely to die on them. Not for everyone, though.
- 1,538 people were killed on roads in Great Britain in 2025, down 4% from 1,602. That is the lowest outside the pandemic years and 53% below 2004.
- But the number killed or seriously injured rose 4% to 29,918, and motorcyclist deaths jumped 14%.
- A new national Road Safety Strategy, published in January 2026, aims to cut deaths and serious injuries by 65% by 2035.
What the numbers show
The Department for Transport’s final figures for 2025 show 1,538 deaths and 127,883 casualties of all kinds in Great Britain, about 4 deaths per billion vehicle miles. By road user, car occupant deaths fell 9% to 629 and pedestrian deaths fell 11% to 364, but motorcyclist deaths rose to 386. Motorcyclists make up a quarter of road deaths and about 1% of traffic. An estimated 220 people died in drink-drive collisions in 2024, down 16%.
Northern Ireland reports separately: 56 people died there in 2025, down from 68, although serious injuries rose 11%. In Wales, 91 people died and collisions on 20mph and 30mph roads were 22% lower than in 2022, before the 20mph default came in.
What is driving it
Speed is still the biggest behavioural factor. At least one speed-related factor was recorded in 52% of fatal collisions in 2025 under DfT’s revised coding, which is not comparable with the older series (DfT). Lower urban limits help: a peer-reviewed NIHR study found Edinburgh’s citywide 20mph limits were followed by a 39% fall in casualty rates. Alcohol featured in 13% of fatal collisions and drugs in 12%.
Recent cases
- 30 July 2026: DfT’s final 2025 figures show deaths down 4% but serious injuries up 4% (DfT).
- 27 March 2026: Northern Ireland reports 56 road deaths in 2025, down from 68 (NISRA).
- 6 January 2026: the government publishes its first national Road Safety Strategy in over a decade, with consultations on a lower drink-drive limit and a minimum learning period for new drivers (GOV.UK).
Press releases and official reports, 2023–2026
Five key releases a year for the last four years, newest first. Most come from UK government departments, regulators, accident investigators and national statistics; a few news reports are included where they are the clearest public record of an event. Releases from 2007–2022 are in the expandable list after 2023.
2026
- 30 Jul 2026DfTReported road casualties Great Britain, final results: 2025
- 16 Jun 2026Transport ScotlandKey Reported Road Casualties Scotland 2025
- 4 Jun 2026Welsh GovernmentPolice recorded road collisions and casualties: 2025
- 27 Mar 2026NISRAFifty-six people died on Northern Ireland's roads in 2025
- 6 Jan 2026DfTThousands of lives to be saved under bold new Road Safety Strategy
2025
- 15 Dec 2025DfTNational Highways variable speed camera anomaly
- 27 Nov 2025DfTReported road casualties in Great Britain, provisional estimates: year ending June 2025
- 24 Nov 2025DfTTHINK! launches first drug driving campaign in a decade
- 25 Sep 2025DfTReported road casualties Great Britain, annual report: 2024
- 29 May 2025DfTReported road casualties Great Britain, provisional results: 2024
2024
- 28 Nov 2024DfTReported road casualties in Great Britain, provisional estimates: year ending June 2024
- 26 Sep 2024DfTReported road casualties Great Britain, annual report: 2023
- 25 Jul 2024DfTReported road casualties in Great Britain, involving illegal alcohol levels: 2022
- 18 Mar 2024DfTYoung people urged to wear seat belts in new life-saving campaign
- 17 Mar 2024DfTCrackdown on anti-driver road schemes and blanket 20mph limits to put local consent first
2023
- 2 Oct 2023DfTGovernment launches plan to put drivers back in the driving seat
- 28 Sep 2023DfTReported road casualties Great Britain, annual report: 2022
- 3 Aug 2023DfTGovernment re-launch THINK! campaign in continued drive to improve road safety
- 15 Apr 2023DfT / National HighwaysAll new smart motorways scrapped
- 6 Mar 2023DfTRural roads targeted in new safety campaign to prevent deaths and injuries among young drivers
View 20 years of major UK road safety press releases (2007–2026)80 more from 2007–2022, five a year, newest first
2022
- 15 Dec 2022DfTNational evaluation of e-scooter trials report
- 29 Sep 2022DfTReported road casualties Great Britain, annual report: 2021
- 25 Mar 2022DfTTransport Secretary declares zero tolerance for phone use behind the wheel as law changes today
- 26 Jan 2022DfTThe Highway Code: 8 changes you need to know from 29 January 2022
- 12 Jan 2022DfT / National HighwaysSmart motorway rollout to be paused as government responds to Transport Committee report
2021
- 19 Nov 2021DfTAny use of hand-held mobile phone while driving to become illegal
- 26 Oct 2021DfTE-scooters: public perceptions
- 30 Sep 2021DfTReported road casualties Great Britain, annual report: 2020
- 24 Jun 2021DfTReported road casualties Great Britain, provisional results: 2020
- 17 Jun 2021DfTTHINK! launches major new campaign with a passionate team talk to young drivers
2020
- 17 Oct 2020DfTNext steps announced to boost road safety and close mobile phone loophole
- 30 Sep 2020DfTReported road casualties Great Britain, annual report: 2019
- 30 Jun 2020DfTRental e-scooter trials to be allowed from this weekend
- 12 Mar 2020DfTAction plan announced to boost smart motorway safety
- 18 Feb 2020DfTPivotal THINK! campaign calls on young men to step in and stop their mates from drink driving
2019
- 28 Nov 2019DfTReported road casualties in Great Britain, provisional estimates: year ending June 2019
- 26 Sep 2019DfTReported road casualties in Great Britain, annual report: 2018
- 3 Sep 2019Highways EnglandSafety on smart motorways
- 25 Jul 2019DfTReported road casualties Great Britain, main results: 2018
- 19 Jul 2019DfTRoad safety action plan announced to cut road deaths
2018
- 8 Nov 2018DfTReported road casualties in Great Britain, provisional estimates: year ending June 2018
- 27 Sep 2018DfTReported road casualties Great Britain, annual report: 2017
- 26 Jun 2018DfTRoad safety management capacity review
- 16 May 2018DfTCiTV star Sam Homewood fronts latest THINK! campaign to get children crossing the road safely
- 8 Feb 2018DfTReported road casualties Great Britain, provisional estimates: July to September 2017
2017
- 24 Nov 2017DfTNew THINK! road safety campaign launched to help cut child deaths
- 7 Oct 2017DfTLife-saving drink drive law turns 50
- 28 Sep 2017DfTReported road casualties Great Britain, annual report: 2016
- 27 Aug 2017DfTDrug driving crackdown means more dangerous motorists off roads
- 13 Aug 2017DfTGreen light for driving lessons on motorways
2016
- 30 Dec 2016DfTPlans to let learner drivers have motorway driving lessons revealed
- 29 Sep 2016DfTReported road casualties Great Britain, annual report: 2015
- 26 Sep 2016DfTNew THINK! campaign to improve cyclists' safety
- 28 Feb 2016DfTDrug drive arrests on the rise
- 3 Jan 2016DfTBritain marks 50 years of seatbelt safety
2015
- 21 Dec 2015DfTGovernment unveils host of measures to further improve road safety
- 22 Oct 2015DfTCountry roads revealed as Britain's deadliest
- 24 Sep 2015DfTReported road casualties Great Britain: annual report 2014
- 25 Jun 2015DfTReported road casualties in Great Britain: main results 2014
- 2 Mar 2015DfTNew powers to tackle drug driving
2014
- 7 Nov 2014DfT92% of people feel ashamed to drink and drive as 50th anniversary THINK! campaign is launched
- 9 Oct 2014DfTCountry roads: deadlier than you THINK!
- 25 Sep 2014DfTReported road casualties Great Britain: annual report 2013
- 3 Jul 2014DfTDrug driving guidance issued to healthcare professionals
- 26 Jun 2014DfTReported road casualties in Great Britain: main results 2013
2013
- 26 Sep 2013DfTReported road casualties Great Britain: annual report 2012
- 16 Aug 2013DfTNew penalties for careless driving come into force
- 27 Jun 2013DfTReported road casualties in Great Britain: main results 2012
- 25 Mar 2013DfTGovernment to overhaul young driver rules in bid to improve safety and cut insurance costs
- 7 Mar 2013DfTDriving under the influence of drugs
2012
- 22 Nov 2012DfTTough new measures to tackle drink drivers
- 27 Sep 2012DfTReported Road Casualties Great Britain: annual report 2011
- 28 Jun 2012DfTReported road casualties Great Britain: main results 2011
- 14 Jun 2012DfTNew penalties to tackle careless driving
- 9 May 2012DfTGovernment crack down on drug driving menace
2011
- 7 Nov 2011DfTM5 collision
- 3 Oct 2011DfTGovernment proposes 80 miles per hour motorway speed limit
- 26 Jun 2011DfTNew transparency rules for speed cameras
- 11 May 2011DfTBetter enforcement and education to cut road deaths
- 21 Mar 2011DfTGovernment crackdown on drink and drug driving
2010
- 7 Dec 2010DfTNew road safety evaluation website launched
- 15 Nov 2010DfTMaking seatbelt and number plate penalties consistent for all drivers
- 9 Sep 2010DfTTHINK! safety messages hit the road
- 8 Jun 2010DfTMotorcycle test and training review ordered by Transport Minister
- 4 Feb 2010DfTSeatbelt and mobile phone use surveys: 2009 results
2009
- 3 Dec 2009DfTVehicle MOT non-compliance statistics 2007 and 2008
- 25 Sep 2009DfTTraffic signs regulations: amending regulations and practices
- 27 Apr 2009DVSAMotorcycle and moped test: manoeuvring area diagrams
- 15 Apr 2009DfTUsing railings to make roads safer for pedestrians (LTN 2/09)
- 1 Jan 2009Highways EnglandRoadworker safety: Highways England's Aiming For Zero programme
2008
- 29 Oct 2008House of Commons Transport CommitteeEnding the Scandal of Complacency: Road Safety beyond 2010
- 13 Oct 2008DfTHow to develop safe streets for mixed use (LTN 3/08)
- 15 Sep 2008Home OfficeBreath-testing devices: transport safety
- 28 Aug 2008Home OfficeIntegrated risk management planning: road traffic collision reduction guidance
- 12 Mar 2008DfTTraffic management and streetscape (LTN 1/08)
2007
- 28 Sep 2007VOSAVOSA annual report and accounts, 2006 to 2007
- 24 Jul 2007DSADSA annual report and accounts, 2006 to 2007
- 21 May 2007Home OfficeSpeedmeter Type Approval – RedSpeed cameras
- 26 Mar 2007FCOTreaty concerning a European Vehicle and Driving Licence Information System
- 31 Jan 2007DfTUsing speed and red-light cameras for traffic enforcement: deployment, visibility and signing
Photo list
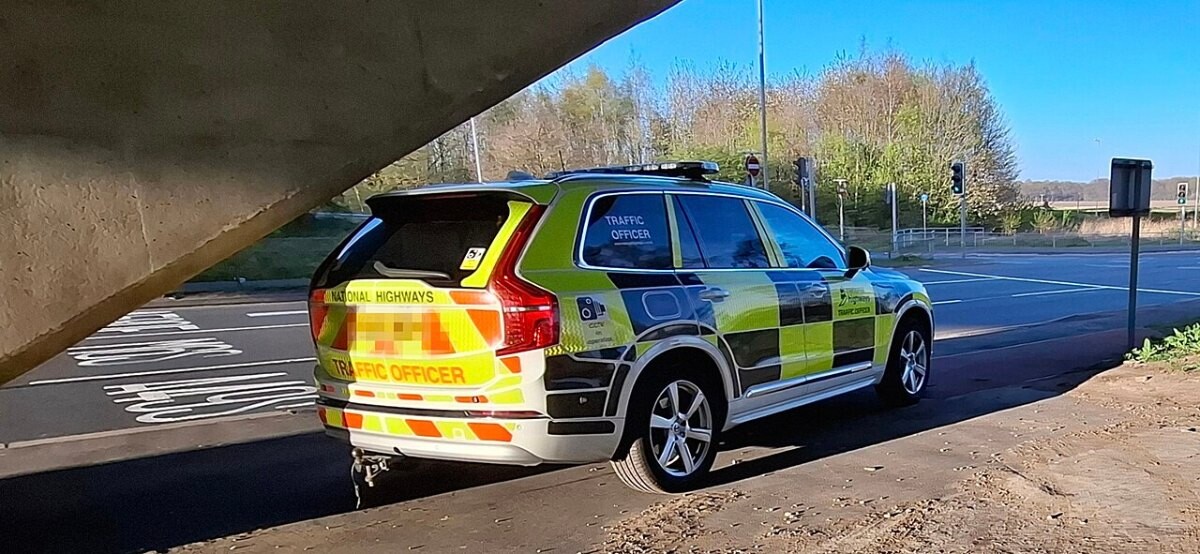
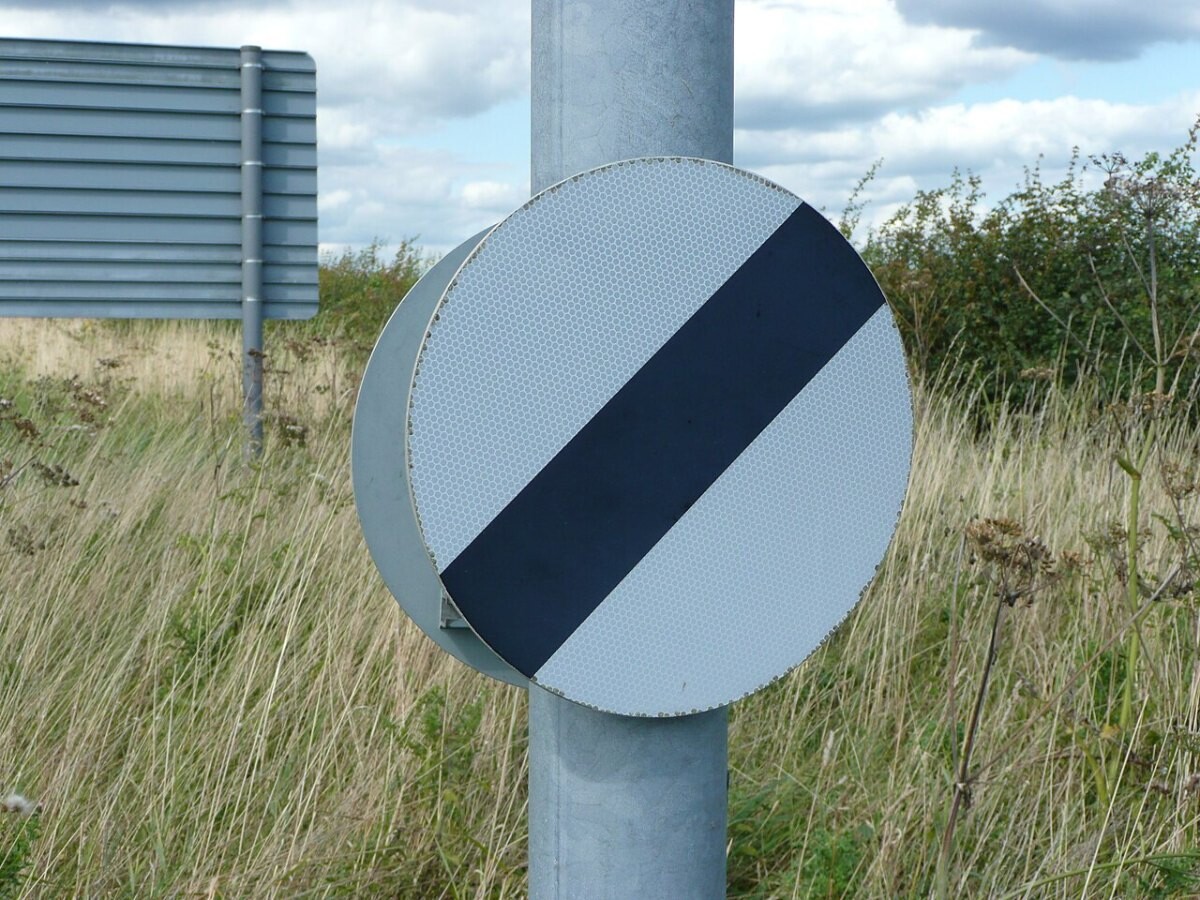
How this page is built. Figures come from the official statistical releases linked above; where agencies publish provisional numbers we say so, because they are revised. UK statistics are often published separately for England, Wales, Scotland and Northern Ireland, so we say which area each figure covers. Photos are public-domain, Creative Commons or Open Government Licence images credited in each caption; file photos are illustrative and are not from the events described unless the caption says so. This page tracks trends and is not personal safety, medical, legal or financial advice.