
Trend summary
- Wildfire used to sound like someone else’s problem. In 2025 it was a British one.
- Satellite monitoring put the UK’s burned area at about 47,000 hectares in January to November 2025, the largest since records began in 2012.
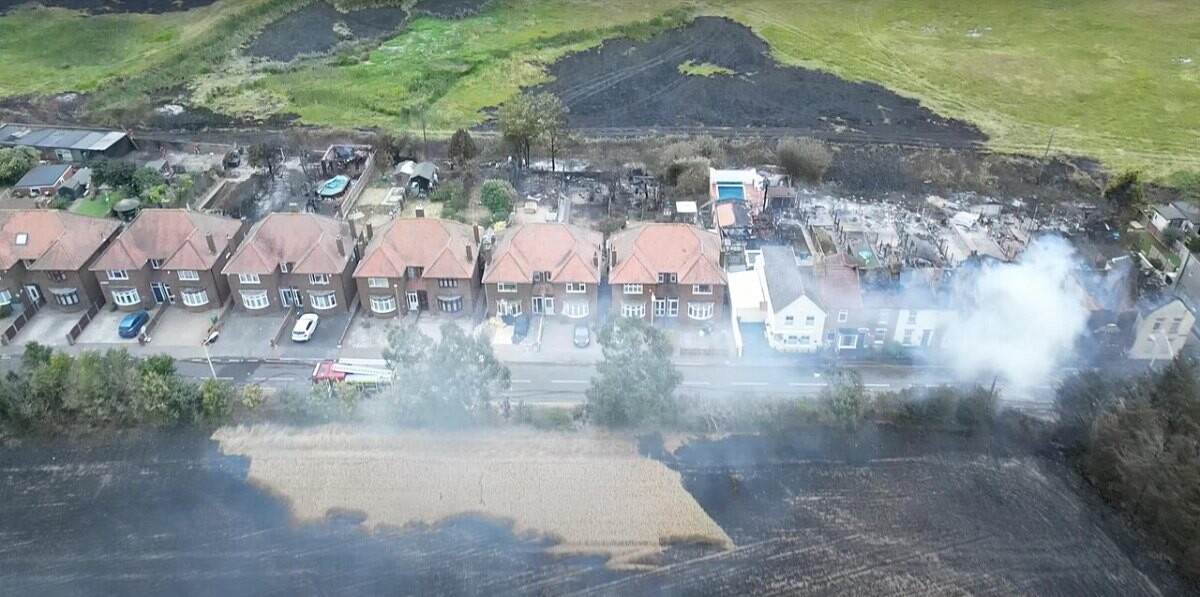
- In England, fire services attended 109,473 outdoor fires in the year to March 2026, up 31% on the year before. Larger outdoor fires rose 48%.
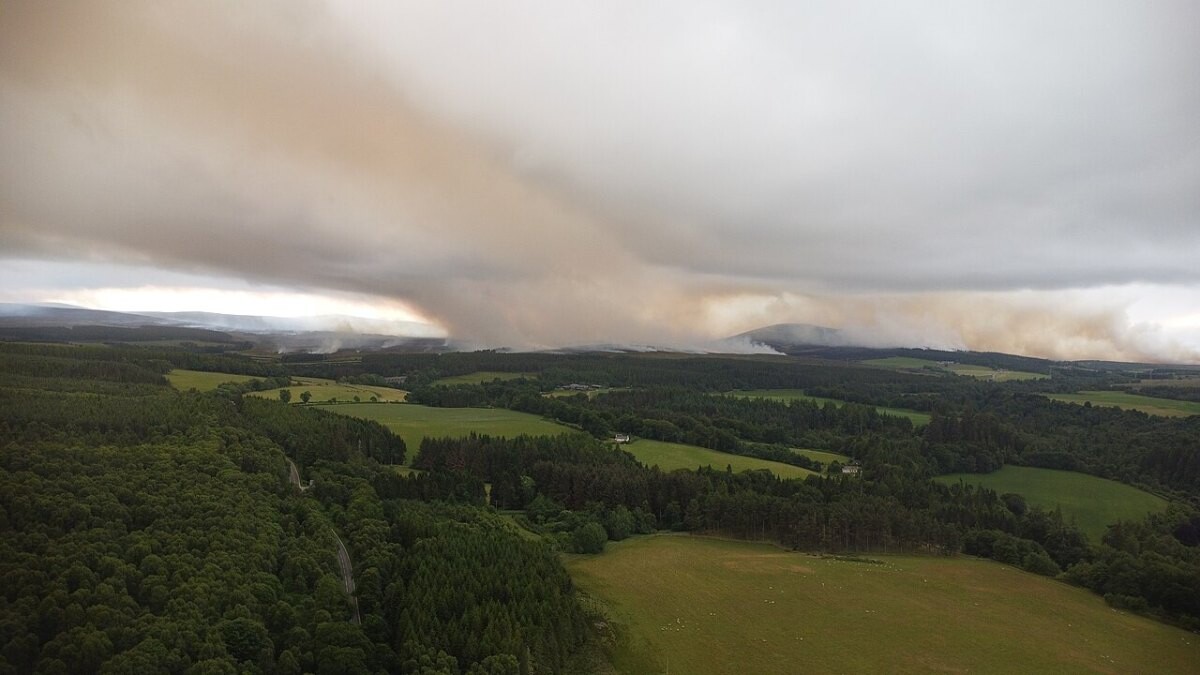
- The Dava Moor fire in Moray burned roughly 10,000 hectares in about four days, and researchers have called it the UK’s first “megafire”.
What the numbers show
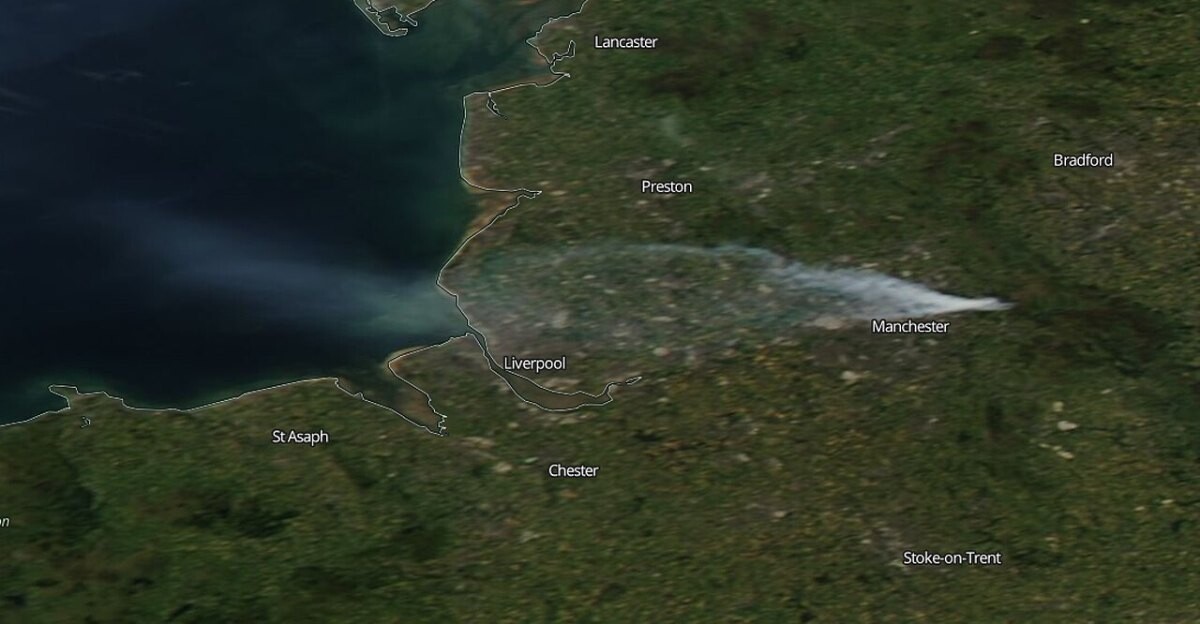
There is no single official count of UK wildfires. Fire services count “outdoor fires”, which include grass and heath but also refuse and other small fires. MHCLG recorded 109,473 of them in England in the year to March 2026, up 31%, and linked the rise to a hot, dry spring and summer in 2025. The National Fire Chiefs Council counted 996 wildfires in England and Wales by 4 September 2025, already above the full-year record of 994 set in 2022.
Area burned comes from satellites. The Global Wildfire Information System measured about 47,000 hectares in January to November 2025, as reported by Euronews, and Carbon Brief found that by early August the total was already nearly four times the 2012-24 average for that point in the year.
What is driving it
Weather sets the stage and people light the match. A Met Office, UKCEH and University of Exeter study found that climate change made the UK’s 2022 fire weather at least six times more likely. Peer-reviewed projections (Perry et al., 2022) suggest summer days of very high fire danger could double at 2°C of global warming. Almost all UK wildfires are started by people, through cigarettes, campfires and barbecues, arson or controlled burns that escape (House of Lords Library).
Recent cases
- July–August 2026, Dunwich Heath, Suffolk: a heathland fire is declared a major incident for about 12 days; crews from all 35 Suffolk fire stations attend (Suffolk County Council).
- April 2026, Elan Valley, mid Wales: moorland fires burn for at least four days near Claerwen Dam (ITV News).
- Summer 2025, Moray: the Dava Moor fire becomes the largest wildfire recorded in Scotland, followed by a major fire at Culbin Forest (Moray Council).
Press releases and official reports, 2023–2026
Five key releases a year for the last four years, newest first. Most come from UK government departments, regulators, accident investigators and national statistics; a few news reports are included where they are the clearest public record of an event. Releases from 2007–2022 are in the expandable list after 2023.
2026
- 19 Aug 2026MHCLGDetailed analysis of fires, England, year ending March 2026
- 14 Aug 2026Cabinet OfficeEmergency Alert to be sent to England and Wales as Government steps up wildfire response with funding, military support and BBQ ban
- 10 Aug 2026Suffolk County CouncilMajor Incident stood down at Dunwich Heath — but people must continue to stay away
- 20 Jun 2026MHCLGGovernment strengthens wildfire resilience heading into summer
- 10 Jun 2026DefraGovernment funds North York Moors wildfire recovery
2025
- 9 Sep 2025DefraBurning banned on England's deep peat to protect wildlife
- 5 Sep 2025NFCCNew wildfire record sparks urgent call for fire service investment
- 27 Aug 2025Moray CouncilMoray Council calls for national action on wildfire risk following devastating summer fires
- 4 Jun 2025House of Lords LibraryWildfires: Reducing the risks and mitigating the effects
- 11 Mar 2025UKCEHClimate change made UK fires in 2022 six times more likely
2024
- 19 Dec 2024Welsh GovernmentGrassland fires, 2023-24
- 19 Sep 2024Home OfficeDetailed analysis of fires, England, April 2023 to March 2024
- 13 Aug 2024Met OfficeClimate change raised the odds of unprecedented wildfires in 2023-24
- 25 Jul 2024Home OfficeFire and rescue incident statistics, year ending March 2024
- 30 Apr 2024Scottish ParliamentWildlife Management and Muirburn (Scotland) Bill
2023
- 30 Nov 2023Welsh GovernmentGrassland fires, 2022-23
- 21 Sep 2023Home OfficeDetailed analysis of fires attended by fire and rescue services, England, April 2022 to March 2023
- 17 Jul 2023DefraGovernment sets out adaptation programme to tackle climate impact
- 16 Feb 2023Forestry CommissionForestry Commission Wildfire statistics for England: Report to 2020-21
- 9 Feb 2023Home OfficeFire and rescue incident statistics: England, year ending September 2022
View 20 years of major UK wildfire press releases (2007–2026)66 more from 2007–2022, up to five a year, newest first
2022
- 29 Sep 2022Home OfficeDetailed analysis of fires attended by fire and rescue services, England, April 2021 to March 2022
- 11 Aug 2022Home OfficeFire and rescue incident statistics: England, year ending March 2022
- 31 Mar 2022Natural EnglandPublic encouraged to take action to prevent wildfires
- 23 Feb 2022Met OfficeUp to 50% increase in wildfires by 2100
- 21 Feb 2022Met Office / NHESSPast and future trends in fire weather for the UK
2021
- 28 Oct 2021Welsh GovernmentGrassland fires, 2020-21
- 30 Sep 2021Home OfficeDetailed analysis of fires attended by fire and rescue services, England, April 2020 to March 2021
- 12 Aug 2021Home OfficeFire and rescue incident statistics: England, year ending March 2021
- 26 Jul 2021MODMOD reminds public to stay safe on the Defence Training estate during the summer holidays
- 29 Jan 2021DefraEngland's 'national rainforests' to be protected by new rules
2020
- 12 Nov 2020Home OfficeFire and rescue incident statistics: England, year ending June 2020
- 1 Oct 2020Home OfficeDetailed analysis of fires attended by fire and rescue services, England, April 2019 to March 2020
- 13 Aug 2020Home OfficeFire and rescue incident statistics: England, year ending March 2020
- 14 May 2020Home OfficeFire and rescue incident statistics: England, year ending December 2019
- 13 Feb 2020Home OfficeFire and rescue incident statistics: England, year ending September 2019
2019
- 14 Nov 2019Home OfficeFire and rescue incident statistics: England, year ending June 2019
- 12 Sep 2019Home OfficeDetailed analysis of fires attended by fire and rescue services, England, April 2018 to March 2019
- 8 Aug 2019Home OfficeFire and rescue incident statistics: England, year ending March 2019
- 4 Jun 2019Environment AgencyNational Drought Group agrees support for farmers and wildlife
- 14 Feb 2019Home OfficeFire and rescue incident statistics: England, year ending September 2018
2018
- 8 Nov 2018Home OfficeFire and rescue incident statistics: England, year ending June 2018
- 20 Sep 2018Environment AgencyEnvironment Agency and Fire Service team up to tackle emergencies
- 6 Sep 2018Home OfficeDetailed analysis of fires attended by fire and rescue services, England, April 2017 to March 2018
- 1 Aug 2018Home OfficeMinister meets and thanks wildfire firefighters
- 27 Jul 2018Natural EnglandChairman of Natural England speaks at the Game Fair
2017
- 12 Oct 2017Home OfficeDetailed analysis of fires attended by fire and rescue services, England, April 2016 to March 2017
- 21 Sep 2017Environment AgencyEnvironment Agency chair to visit Derbyshire's BogFest 2017
- 18 May 2017Home OfficeFire statistics monitor: April to September 2016
- 27 Apr 2017Home OfficeFire Statistics: England April 2015 to March 2016
- 16 Feb 2017Welsh GovernmentGrassland fires: financial year ending March 2016
2016
- 17 Aug 2016Home OfficeFire statistics monitor: April 2015 to March 2016
- 27 Jul 2016Welsh GovernmentFire statistics: financial year ending March 2016
- 29 Jun 2016Home OfficeFire statistics: England April 2014 to March 2015
- 20 May 2016Defra€12 million European Union funding to protect vital UK moorlands
- 31 Mar 2016DCLGFire statistics monitor: April to September 2015
2015
- 19 Nov 2015Welsh GovernmentGrassland fires: financial year ending March 2015
- 20 Aug 2015DCLGFire statistics monitor: April 2014 to March 2015
- 30 Jul 2015Welsh GovernmentFire statistics: financial year ending March 2015
- 26 Feb 2015Welsh GovernmentGrassland fires: financial year ending March 2014
- 29 Jan 2015DCLGFire Statistics Great Britain: 2013 to 2014
2014
- 18 Sep 2014Welsh GovernmentFire and rescue service performance in Wales: financial year ending March 2014
- 30 Jul 2014Welsh GovernmentFire statistics Wales: 2013 to 2014
- 2 Jul 2014DCLGFire statistics monitor: April 2013 to March 2014
- 23 May 2014DCLGFire statistics Great Britain 2012 to 2013
- 28 Jan 2014DCLGFire statistics monitor: April to September 2013
2013
- 29 Nov 2013DCLGFire and rescue authorities: operational statistics bulletin for England 2012 to 2013
- 22 Aug 2013DCLGFire incidents response times: England 2012 to 2013
- 26 Jun 2013DCLGFire statistics monitor: April 2012 to March 2013
- 14 Mar 2013DCLGFire statistics monitor: April to September 2012
2012
- 13 Dec 2012DCLGFire statistics Great Britain 2011 to 2012
- 4 Jul 2012DCLGFire statistics monitor: April 2011 to March 2012
- 31 Jan 2012DCLGFire statistics monitor: April to September 2011
2011
- 25 Nov 2011DCLGFire statistics Great Britain 2010 to 2011
- 24 Jun 2011DCLGFire statistics monitor: April 2010 to March 2011
- 10 May 2011MODSoldiers help battle Brecon fires
- 7 Apr 2011Scottish ParliamentWildlife and Natural Environment (Scotland) Act 2011
- 28 Jan 2011DCLGFire statistics monitor: April to September 2010
2010
- 26 Nov 2010DCLGFire statistics: UK 2008
- 24 Sep 2010DCLGFire and rescue authorities: operational statistics bulletin for England 2009 to 2010
- 20 Aug 2010Home OfficeFire statistics monitor: April 2009 to March 2010
- 14 May 2010Home OfficeFire statistics monitor: April to September 2009
2009
- 1 Jul 2009Environment AgencyReview of emission factors for incident fires
- 25 Jun 2009DCLGIncident recording system for fire and rescue authorities: questions and lists v1.2
2008
- 28 Aug 2008Home OfficeIntegrated risk management planning: wildfire guidance
- 14 Apr 2008Welsh GovernmentThe Heather and Grass etc. Burning (Wales) Regulations 2008
2007
- 11 Jul 2007DefraThe Heather and Grass etc. Burning (England) Regulations 2007
Some early years list fewer than five items. Many UK government releases from that period are no longer online at their original addresses, and we only list items we could open and check.
Photo list
How this page is built. Figures come from the official statistical releases linked above; where agencies publish provisional numbers we say so, because they are revised. UK statistics are often published separately for England, Wales, Scotland and Northern Ireland, so we say which area each figure covers. Photos are public-domain, Creative Commons or Open Government Licence images credited in each caption; file photos are illustrative and are not from the events described unless the caption says so. This page tracks trends and is not personal safety, medical, legal or financial advice.