Sixty-Four Per Cent of Seriously Injured British Bus Passengers Were Never in a Crash. And the Bus Is Still About Four Times Safer Than the Car.
In This Series: Road, Transit & Child Safety
Key takeaways · 12 min read
- 64.3% of bus and coach passengers killed or seriously injured in Great Britain were hurt in incidents involving no collision.
- Of those non-collision casualties, 74.2% were women and 58.0% were aged 60 or over.
- Not being seated roughly doubles the odds of a serious outcome: 8.3% against 4.1%.
- Pooled risk is about 0.3–0.5 injuries per million passenger kilometres for falls inside a moving vehicle, and 0.8–1.7 per million passengers for boarding and alighting.
Per kilometre travelled, riding a city bus down a major road is roughly four times safer than driving a car down the same road — not just for you, but for the people walking and cycling alongside it. That figure comes from a study that measured ten Montreal bus corridors over ten years, and it is about as clean a comparison as this literature gets.
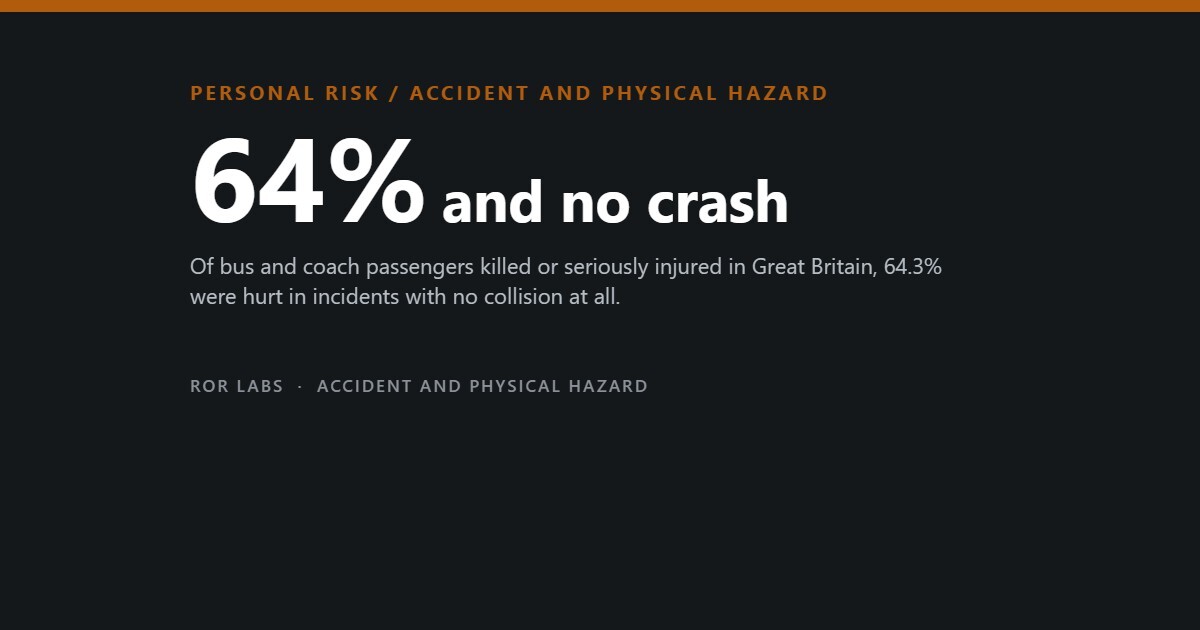
Now the other number. Of all bus and coach passengers killed or seriously injured in Great Britain, 64.3 per cent were hurt in incidents involving no collision at all. Nothing hit the bus. The bus hit nothing. Somebody was standing up when it braked, or stepped down onto a kerb that was not where they expected it.
Both things are true, and they are the whole subject. The mode is safe; the moment is not. What follows is what the injury data actually contain, why the two dangerous moments have different physics, and why the risk falls almost entirely on one group of passengers.

What the casualty data actually contain
British road casualty records are collected by the police under a form called STATS19, and because they are built around road traffic accidents they capture bus passengers as an afterthought. When researchers at Loughborough went through them looking specifically at bus and coach passengers, they found that the non-collision cases were not a footnote. They were the majority.
Among killed or seriously injured passengers, 64.3 per cent were injured without a collision. Nearly three quarters of those casualties — 74.2 per cent — were women, and 58.0 per cent were aged 60 or over. Almost half of all seriously injured passengers, 49.0 per cent, were both not seated and in a vehicle that had not been struck.
The same analysis put a number on what sitting down is worth. A passenger who was not seated had an 8.3 per cent chance of being killed or seriously injured, against 4.1 per cent for a seated one — roughly double.
Killed or seriously injured bus and coach passengers, Great Britain
Not seated: 8.3% chance of a killed-or-seriously-injured outcome. Seated: 4.1%. Bus design changed over this period — low-floor access made buses usable by less mobile passengers, which the authors note may raise exposure at the same time as it improves access.
Kirk, A., Grant, R. and Bird, R., “Passenger casualties in non-collision incidents on buses and coaches in Great Britain”, Loughborough University, 2003, using STATS19 national road accident data.
Two moments, two different mechanisms
Non-collision injury is not one thing. It splits cleanly into falling inside a moving vehicle and falling while getting on or off one, and the two are measured against different denominators, because one is a function of distance and the other is a function of trips.

Rune Elvik reconstructed exposure for eleven studies and produced comparable estimates for both. The mean risk of falling inside a moving vehicle is about 0.3 to 0.5 injuries per million passenger kilometres. The mean risk associated with boarding or alighting is about 0.8 to 1.7 per million passengers — per person getting on or off, not per kilometre they then travel. On a short urban trip, the boarding and alighting is where most of the risk sits.
An older American dataset gives the same shape from the inside. Washington’s transit authority recorded more than 5,000 bus passenger injuries: a third occurred during boarding and alighting, and another quarter occurred while the bus was stopping. Of the injuries on stopping buses, 45 per cent happened to passengers who were getting up, sitting down, or already seated. A third of the alighting injuries were trips and slips.
Where the injuries happen, and against which denominator
| Falling inside a moving vehicle | Boarding or alighting | |
|---|---|---|
| Pooled risk estimate | 0.3–0.5 injuries per million passenger kilometres | 0.8–1.7 injuries per million passengers |
| Trigger | Braking, acceleration, cornering. Standing, or moving to or from a seat. | The step, the gap, the kerb, the doors closing. |
| Share of hospitalised cases (Israel, 2015–17) | 75% | 25% |
| Share of recorded injuries (Washington DC) | ~25% during stopping, of which 45% while getting up, sitting down or seated | ~33%, a third of them trips and slips |
Elvik, R., “Risk of non-collision injuries to public transport passengers”, Journal of Transport & Health, 2019; Siman-Tov, M. et al., Israeli National Trauma Registry, 2019; Fruin, J.J. et al., Washington Metropolitan Area Transit Authority data, 1994.
The physics of standing up
There is a measured threshold here, and buses routinely cross it. A Dublin group instrumented urban buses and recorded real acceleration profiles, then ran a validated human model of a standing passenger holding a handgrip. Peak accelerations reached ±0.32g. The reported threshold at which a standing passenger holding on loses balance is about 0.15g.
That is not a near miss. It is roughly double the level at which a person holding a rail can be expected to stay upright, occurring as a matter of normal driving. Their model could not predict when balance would actually be lost, but it could estimate what happens afterwards: a maximum predicted probability of knee injury of 53 per cent and of head injury of 35 per cent from contact with seats, handrails and walls. The stairwell and the horizontal handles on the backs of seats came out as particularly hazardous, and the authors recommended replacing the latter with vertical handrails.
What a bus does, against what a standing passenger can absorb
Predicted probability of injury once a fall begins: knee 53%, head 35%, from contact with seats, handrails and walls. From a validated human model, not from observed falls.
Palacio, A., Tamburro, G., O’Neill, D. and Simms, C., Accident Analysis and Prevention, 2008.
A Swedish study of three and a half years of emergency department cases refines the mechanism further. Falls under acceleration and falls under braking are not the same event. Under acceleration, older passengers most often fall immediately after boarding — before they have reached anything to hold. And the involvement of women is high not only in the over-65 group but in younger age groups too, which the authors read as a hint that the acceleration thresholds for keeping balance may differ by sex.
Who this actually happens to
Israel’s national trauma registry covers twenty hospitals, and between 2015 and 2017 it recorded 704 people hospitalised after a non-collision bus injury. Seventy-five per cent fell inside the bus and 25 per cent while boarding or alighting. Sixty-seven per cent were aged 60 or over. Seventy-two per cent were women. The commonly injured regions were the lower limbs, the head and the torso.
An earlier prospective study across six Israeli emergency departments found the same profile in less severe cases: 120 patients, 86 of them women, more than half over 55, most of them standing when hurt. No fatalities, and 17 admitted.
A systematic review of ten studies from high-income countries reached the same conclusion: more than 6,000 people a year are injured on public buses in the United Kingdom, about half aged 65 or over. Most injuries happen in daytime hours on weekdays — on ordinary journeys, not at the edges of the timetable.
704 people hospitalised after a bus injury with no crash
Israeli National Trauma Registry, twenty hospitals, 2015–2017.
Siman-Tov, M., Radomislensky, I., Marom, I., Kapra, O., Peleg, K. and Bahouth, H., Journal of Transport & Health, 2019.
And the bus is still much safer than the car
A Montreal study picked ten bus routes along major arterials, estimated car and bus passenger kilometres from vehicle and automatic on-board passenger counts, and pulled ten years of police injury reports for every mode. Per passenger kilometre, the ratio of car occupant to bus occupant injury rates was 3.7, with a confidence interval of 3.4 to 4.0. For fatal or severe injuries the ratio was 6.3. The rate of pedestrian injury associated with car travel was 4.1 times that associated with bus travel, and for cyclists 5.3 times.
Combining all three groups, travelling by car on those roads was associated with 3.8 times the injury rate of travelling by bus. The authors then asked what would happen if every bus passenger kilometre were shifted to cars: across the ten routes over ten years, bus travel had avoided an estimated 2,437 injuries, 105 of them severe or fatal.
Car travel versus bus travel, per passenger kilometre
Injury rate ratios on ten Montreal arterial bus corridors, 2001–2010. Above 1 means car travel is worse.
The authors note they are more likely to have over-estimated car passenger kilometres than under-estimated them, which would make these ratios conservative. Exposure came from counts taken on a single day and was not varied over the ten-year period — their main stated limitation.
Morency, P., Strauss, J., Pépin, F., Tessier, F. and Grondines, J., “Traveling by Bus Instead of Car on Urban Major Roads”, Journal of Urban Health, 2018.
How well we actually know any of this
Badly, and the researchers say so. Elvik was able to reconstruct exposure for only eleven studies, and rated half of those exposure estimates as very or somewhat uncertain. The risk estimates vary substantially from study to study, and his summary of why is unusually blunt: largely for unknown reasons.
There is a structural reason for the fog. Non-collision injuries mostly do not reach police road accident data, because no accident in the legal sense has occurred. They surface in emergency departments, in an operator’s liability file, or nowhere. A Swedish group argues that assessing bus travel properly requires a travel chain view — the walk to the stop, the wait, the boarding, the ride, the alighting — and that police data covers almost none of it.
One consequence is that the risk factors themselves differ between the two kinds of incident. A Hong Kong analysis of 17,383 injured franchised bus passengers over ten years found that the factors raising injury severity in non-collision incidents were substantially inconsistent with those in collisions. Whatever governs how badly you are hurt when a bus is struck is not what governs how badly you are hurt when it merely brakes.
Three sentences that are all supported

Questions people ask
Is it really safer to take the bus?
On the evidence, yes, and by a wide margin per kilometre travelled — for you, and for the people around the vehicle. The non-collision injuries are real and under-counted, but they are overwhelmingly non-fatal. In the Israeli emergency department study there were no deaths among 120 casualties; in the Montreal data the fatal injury rate for bus occupants was zero across ten years on ten routes.
What is the single most useful thing a passenger can do?
Sit down, and stay seated until the bus has stopped. That is the one behaviour the data speaks to directly: not seated doubles the odds of a serious outcome, and 45 per cent of the injuries recorded on stopping buses happened to people who were getting up, sitting down, or seated but unbraced. Standing up early to be ready at the door is the specific move the numbers argue against.
If I have to stand, what should I hold?
Something vertical, if there is one. The modelling study found horizontal handles on the backs of seats to be among the more hazardous features and recommended replacing them with vertical handrails; stairwells came out badly too. The honest caveat is that this comes from simulation rather than from a trial of handrail designs, and no such trial exists.
Why are so many of the casualties women?
Nobody knows. It shows up in Britain, Israel, Sweden, Denmark and the United States alike. Part of it is exposure — women use buses more in most of these countries, and older women more still — but the Swedish work found the over-representation in younger age groups too, which exposure alone does not obviously explain. The authors raise the possibility that balance thresholds under acceleration differ by sex; that is a hypothesis, not a finding.
Is this getting better or worse?
Both, in different places. Washington’s passenger injury rate fell by about a third between 1976 and 1990. Against that, low-floor buses and accessibility rules have brought less mobile passengers onto services they previously could not use, which is a public good that also raises exposure among exactly the group most likely to be hurt. The British researchers make this point explicitly rather than treating it as an argument against accessibility.
The short version
- 64.3% of bus and coach passengers killed or seriously injured in Great Britain were hurt in incidents involving no collision.
- Of those non-collision casualties, 74.2% were women and 58.0% were aged 60 or over.
- Not being seated roughly doubles the odds of a serious outcome: 8.3% against 4.1%.
- Pooled risk is about 0.3–0.5 injuries per million passenger kilometres for falls inside a moving vehicle, and 0.8–1.7 per million passengers for boarding and alighting.
- Measured urban bus accelerations reach ±0.32g. The reported balance-loss threshold for a standing passenger holding a handgrip is about 0.15g.
- In an Israeli registry of 704 hospitalised cases, 75% fell inside the bus, 67% were 60 or over and 72% were women.
- Per passenger kilometre, car travel on the same roads carried 3.7 times the occupant injury rate of bus travel, 6.3 times for severe and fatal injuries, and 4.1 and 5.3 times the associated pedestrian and cyclist injury rates.
- The exposure data underlying all of this is weak: half the estimates in the largest synthesis were rated uncertain, and the author attributes the variation between studies to unknown reasons.
This article summarises published research on injuries to public transport passengers. It is not medical advice, and it describes population averages rather than any individual’s risk. Where estimates are uncertain, the uncertainty is stated rather than smoothed over.
Further reading: Elvik’s synthesis in the Journal of Transport & Health is the best single entry point, and the Montreal study by Morency and colleagues is open access. Your own transit operator may publish passenger incident counts; most do not.
- Killed by a Traffic Engineer, Wes Marshall (2024). A traffic engineering professor’s inside critique of how little evidence underlies standard road-design practice.
- Right of Way, Angie Schmitt (2020). A data-driven look at why US road deaths are rising, with a focus on design and equity.
- How to Read Numbers, Tom Chivers & David Chivers (2021). Common statistical traps explained through news examples.
Sources
- Kirk, A., Grant, R. and Bird, R., “Passenger casualties in non-collision incidents on buses and coaches in Great Britain”, Loughborough University, 2003. (STATS19 data. 64.3% of killed or seriously injured bus and coach passengers were injured in non-collision incidents; of those, 74.2% female, 58.0% aged 60 or over. 49.0% of KSI casualties were both not seated and in a vehicle with no impact. Not seated: 8.3% likelihood of a KSI outcome against 4.1% seated. The authors note low-floor access has widened the population able to use buses and may increase the exposure of more vulnerable passengers.)
- Elvik, R., “Risk of non-collision injuries to public transport passengers: Synthesis of evidence from eleven studies”, Journal of Transport & Health, 2019. (Twelve risk estimates for boarding and alighting and twelve for falls onboard, from eleven studies. Mean risk of falling in a moving vehicle about 0.3–0.5 per million passenger kilometres; boarding or alighting about 0.8–1.7 per million passengers. Half the exposure estimates were rated very or somewhat uncertain, and the author states estimates vary substantially between studies largely for unknown reasons.)
- Morency, P., Strauss, J., Pépin, F., Tessier, F. and Grondines, J., “Traveling by Bus Instead of Car on Urban Major Roads: Safety Benefits for Vehicle Occupants, Pedestrians, and Cyclists”, Journal of Urban Health, 2018. (Ten Montreal arterial bus routes, 2001–2010. Car-to-bus occupant injury rate ratio 3.7, 95% CI 3.4–4.0; 6.3 for fatal or severe, 3.4–13.3. Pedestrian 4.1, 3.5–4.9; cyclist 5.3, 3.8–7.6; all modes combined 3.8, 3.6–4.1. Bus travel estimated to have avoided 2,437 injuries over ten years across the ten routes, 105 of them severe or fatal. Bus occupant fatal injury rate 0.00 per 100 million passenger kilometres.)
- Siman-Tov, M., Radomislensky, I., Marom, I., Kapra, O., Peleg, K. and Bahouth, H., “A nation-wide study on the prevalence of non-collision injuries occurring during use of public buses”, Journal of Transport & Health, 2019. (Israeli National Trauma Registry, twenty hospitals, 2015–2017. 704 hospitalised non-collision bus casualties: 75% fell inside the bus, 25% while boarding or alighting; 67% aged 60 or over; 72% women. Lower extremities, head and torso most frequently injured.)
- Palacio, A., Tamburro, G., O’Neill, D. and Simms, C., “Non-collision injuries in urban buses — strategies for prevention”, Accident Analysis and Prevention, 2008. (Measured urban bus acceleration profiles peaking at ±0.32g against a reported balance-loss threshold of 0.15g for a standing passenger using a handgrip. Maximum predicted probability of knee injury 53% and head injury 35%. Stairwells and horizontal seatback handles identified as particularly hazardous, with vertical handrails recommended in their place. Balance loss itself could not be predicted by the model.)
- Silvano, A.P. and Ohlin, M., “Non-collision incidents on buses due to acceleration and braking manoeuvres leading to falling events among standing passengers”, Journal of Transport & Health, 2019. (Three and a half years of Swedish emergency department cases, all passengers standing when they fell. Under acceleration, passengers aged 65 and over most often fell immediately after boarding; braking showed a different pattern. Female involvement was high in younger age groups as well, which the authors suggest may indicate different balance thresholds by sex.)
- Fruin, J.J., Huang, H.F., Zegeer, C. and Smith, N.E., “Recommendations for reducing noncollision bus passenger injuries”, Transportation Research Board, 1994. (More than 5,000 bus passenger injuries from the Washington Metropolitan Area Transit Authority. One third occurred during boarding and alighting, a further quarter during stopping; 45% of injuries on stopping buses occurred while passengers were getting up, sitting down or seated; one third of alighting injuries were trips or slips. The rate fell by about a third between 1976 and 1990.)
- Kendrick, D., Drummond, A., Logan, P., Barnes, J. and Worthington, E., “Systematic review of the epidemiology of non-collision injuries occurring to older people during use of public buses in high-income countries”, 2015. (Ten studies. More than 6,000 people a year injured on public buses in the UK, about half aged 65 or over. Older people and women over-represented; most injuries in daytime hours on weekdays, while standing and moving around the bus, boarding or alighting, and while the bus was accelerating or decelerating.)
- Halpern, P. et al., “Non-collision injuries in public buses: a national survey of a neglected problem”, Emergency Medicine Journal, 2005. (Prospective study across six Israeli emergency departments. 120 patients, 86 women, over half older than 55. Main mechanism acceleration or deceleration, most standing. No fatalities; 17 admitted to hospital.)
- Zhou, H., Chen, Y., Dong, N., Wong, S.C. and Xu, P., “Severity of passenger injuries on public buses: A comparative analysis of collision injuries and non-collision injuries”, Journal of Safety Research, 2020. (Police-reported data on 17,383 passengers injured on franchised public buses in Hong Kong over ten years. Random parameters logistic modelling found substantial inconsistencies in the effects of risk factors between non-collision and collision injury models.)
- Berntman, M., Wretstrand, A. and Holmberg, B., “Bus travel safety — a travel chain perspective”, Lund University, 2010. (Argues that police-reported accident data covers bus occupant safety only, rarely the whole travel chain, and combines police and hospital registrations from four Swedish emergency departments to capture injuries to and from the stop as well as on board.)