Medical Error Is Probably Not the Third Leading Cause of Death. In a Thousand Reviewed Hospital Deaths, 5.2 Per Cent Were Preventable.
Key takeaways · 12 min read
- The US claim that medical error is the third leading cause of death rests on 251,454 deaths a year, extrapolated from a small number of chart reviews. Two senior patient-safety researchers have published that it is very likely to be wrong.
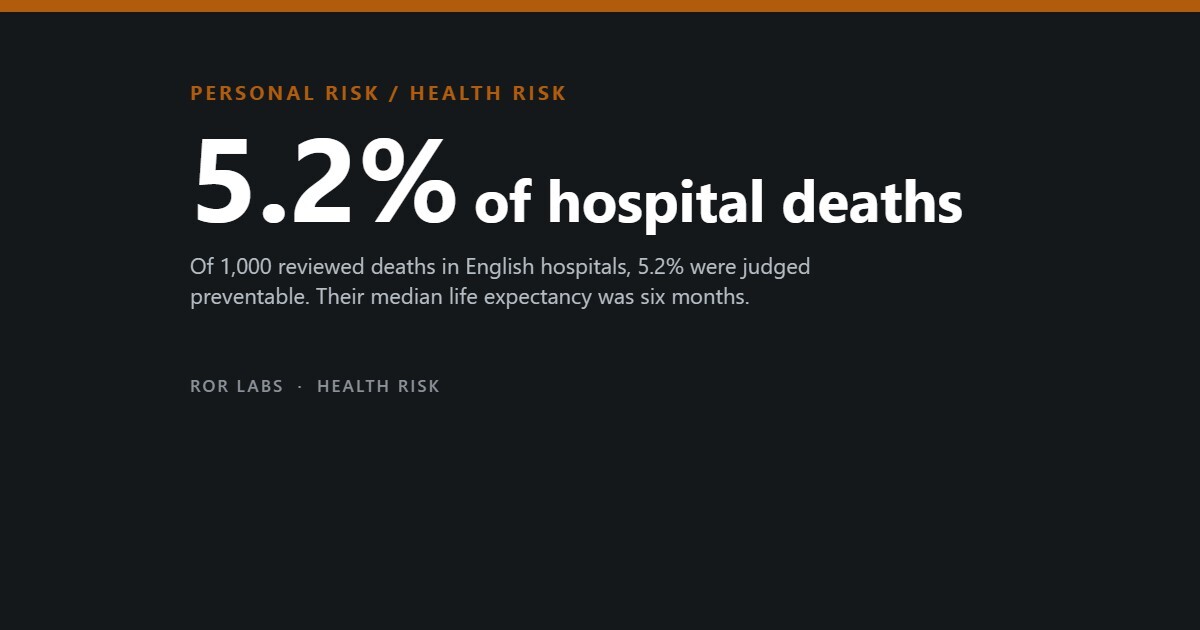
- Reviewers read 1,000 randomly selected English hospital deaths one by one and judged 5.2% (95% CI 3.8–6.6) preventable. A US study of 111 deaths found 6.0%.
- Those patients had a median remaining life expectancy of six months, and 60% had less than a year.
- US reviewers were asked whether the patient would have lived even three more months in good cognitive health. They said yes for 0.5% of deaths, about one per 10,000 admissions.
In this article
- Where the number came from
- What happens when you review the deaths themselves
- The part nobody quotes
- Now the number that is real
- Why “preventable” is the weak joint
- The argument has moved to diagnosis
- What patients can do: the AHRQ’s 20 tips
- What the official pages say about medical error deaths
- Questions people ask
- The short version
- Sources
In 2016 the BMJ published an analysis putting deaths from medical error in the United States at 251,454 a year, which would rank it third among causes of death after heart disease and cancer. The figure went everywhere, and almost a decade later it is still quoted in journal introductions, medical school curricula and news coverage.
Two of the field’s most careful methodologists replied that the estimate is, in their words, very likely to be wrong. Meanwhile someone had done the obvious thing: taken a thousand randomly chosen hospital deaths and had physicians read every record to decide whether better care would have prevented each one. The answer was 5.2 per cent.
This article does not argue that hospitals are safe. The best current measurement finds an adverse event in nearly a quarter of admissions. What it separates is a harm rate, which is real and large, from a death toll, which is an extrapolation, and it asks why the second keeps coming out so much bigger than anyone can find by counting.

Where the number came from
The chain starts with the Harvard Medical Practice Study, which reviewed 30,121 records from 51 New York hospitals in 1984. Adverse events occurred in 3.7 per cent of hospitalisations, 27.6 per cent of them were judged due to negligence, and 13.6 per cent of adverse events led to death. Applied to national admissions, those percentages produced the Institute of Medicine’s 1999 estimate of 44,000 to 98,000 deaths a year.
An audit published the following year found thinner foundations than the citation implied. The two studies did support the claim that adverse events occur in 2.9 to 3.7 per cent of admissions. For the assertion that about half were preventable, support was less clear in the reviewers’ assessment: the original studies did not define preventable adverse events, and the reliability of subjective judgements about preventability was never formally assessed. The methods behind the 98,000 upper bound were described as highly subjective, with unknown reliability.
The estimates then climbed. A 2013 review using the Global Trigger Tool put a lower limit at 210,000 and a true figure above 400,000, and Makary and Daniel’s 251,454 followed in 2016. Each step applied rates from a few chart reviews to the whole national admission count.
The estimates went up. The counting did not.
| Year | Claim | How it was produced |
|---|---|---|
| 1991 | Adverse events in 3.7% of admissions; 13.6% of them led to death | Review of 30,121 records from 51 New York hospitals, 1984 data |
| 1999 | 44,000–98,000 deaths a year | Those rates applied to national admissions |
| 2013 | 210,000 lower limit, “more than 400,000” | Weighted average of four Global Trigger Tool studies |
| 2016 | 251,454 deaths a year, third leading cause | Rates from a small set of studies applied to 35 million admissions |
| 2012 | 5.2% of hospital deaths preventable | 1,000 randomly selected deaths, each record read by a physician |
The last row is out of chronological order deliberately. It is the only one in the table that counted deaths rather than inferring them.
Brennan, T. et al., NEJM, 1991; Institute of Medicine, To Err Is Human, 1999; James, J.T., Journal of Patient Safety, 2013; Makary, M. and Daniel, M., BMJ, 2016; Hogan, H. et al., BMJ Quality & Safety, 2012.
What happens when you review the deaths themselves
Helen Hogan and colleagues took ten English acute hospital trusts, stratified by region, size and teaching status, and drew 100 consecutive deaths from each for the year 2009. They excluded paediatric, obstetric and psychiatric admissions, and patients admitted explicitly for palliative care. Seventeen experienced physician reviewers read the whole record for each case, including nursing notes, drug charts and test results. They judged first whether a problem in care had contributed to the death, and then whether the death itself was preventable.

They used “problem in care” rather than “adverse event” because it captures failures to act as well as things actively done wrong. Preventability was scored on a six-point scale; a death counted as preventable only if the reviewer thought there was a better than even chance that better care would have prevented it.
Fifty-two of the thousand deaths met that bar: 5.2 per cent, with a confidence interval of 3.8 to 6.6. A problem in care contributed to death in 131 cases, so about two in five of those did not translate into a preventable death. Scaled to English hospital deaths, that gives roughly 11,859 preventable deaths a year, against the 60,000 to 255,000 that had been the working figure.
The answer moves with where you put the line
Share of 1,000 English hospital deaths judged preventable, by the threshold used on a six-point scale.
The authors argue their known biases — single-reviewer judgement and hindsight bias — would push the estimate up rather than down, so 5.2% is more likely too high than too low.
Hogan, H., Healey, F., Neale, G., Thomson, R., Vincent, C. and Black, N., BMJ Quality & Safety 21:737–745, 2012.
The part nobody quotes
The usual comparison is the jumbo jet: a plane full of people falling out of the sky every day. Hogan’s study contains the finding that breaks that image, and it is not in the abstract of anything you will have read.
Patients whose deaths were judged preventable had a median estimated remaining life expectancy of six months, with an interquartile range of four months to two years. Sixty per cent had less than a year. In the main, these were people who were already dying.
An American study made the same point more sharply. Among 111 in-hospital deaths at seven Veterans Affairs centres, reviewers rated 6.0 per cent as probably or definitely preventable, close to Hogan’s figure. A second question followed: in the absence of any problem in care, would this patient have lived at least three more months in good cognitive health? Reviewers said yes for 0.5 per cent of the deaths, with a confidence interval of 0.3 to 0.7 per cent, or roughly one patient per 10,000 admissions.
Two questions about the same deaths
This does not make those deaths acceptable, and the commentary that assembled these figures says so explicitly. It makes the aviation comparison wrong, and it makes hospital mortality a poor instrument for finding unsafe care.
Hayward, R. and Hofer, T., JAMA, 2001, as reported in Shojania, K.G., “Deaths due to medical error: jumbo jets or just small propeller planes?”, BMJ Quality & Safety, 2012; Hogan et al., 2012.
Now the number that is real
None of the above says hospital care is safe. The best modern measurement of harm, as opposed to death, is a 2023 study in the New England Journal of Medicine of a random sample of 2,809 admissions to eleven Massachusetts hospitals in 2018. Trained nurses screened the records using trigger methods and physicians adjudicated what they found.
At least one adverse event was identified in 23.6 per cent of admissions. Of the 978 adverse events, 222 (22.7 per cent) were judged preventable and 316 (32.3 per cent) were serious. That is roughly one admission in four involving some harm from care, against 3.7 per cent in the Harvard study more than three decades earlier, a difference that mostly reflects how much harder people are now looking.
Harm is common. Death from harm is rare.
| Rate | Source | |
|---|---|---|
| Admissions with at least one adverse event | 23.6% | 2,809 admissions, 11 Massachusetts hospitals, 2018 |
| Adverse events judged preventable | 22.7% of 978 events | Same study |
| Adverse events judged serious | 32.3% of 978 events | Same study |
| Hospital deaths judged preventable | 5.2% (95% CI 3.8–6.6) | 1,000 deaths, 10 English trusts, 2009 |
| Deaths where 3 more good months were lost | 0.5% (95% CI 0.3–0.7) | 111 deaths, 7 US Veterans Affairs centres |
Bates, D.W. et al., “The Safety of Inpatient Health Care”, New England Journal of Medicine, 2023; Hogan et al., 2012; Hayward and Hofer, 2001.
Why “preventable” is the weak joint
Every one of these estimates rests on a judgement that a trained person makes by reading a record, and the judgements differ greatly in reliability. A Dutch team had a committee re-review the same records twice and measured the agreement. Detecting whether an adverse event occurred was reproducible. Deciding whether it was preventable showed only fair reliability, which the authors attributed to the absence of any agreed definition of preventability.
That is not a small technicality. Every headline number turns on it. Hogan’s estimate moves from 2.3 per cent to 8.5 per cent depending purely on where the threshold sits on the same six-point scale, applied to the same thousand records by the same reviewers. And a French comparison of three different detection methods on one patient sample found that they identify different numbers of cases and different preventable proportions, with no gold standard to arbitrate between them.
Two judgements, two different qualities of evidence
Klein, D.O. et al., PLOS ONE, 2018; Hogan et al., 2012.
The argument has moved to diagnosis
The live version of this dispute concerns diagnostic error and has exactly the same shape. A 2023 analysis combining disease-specific error rates with national incidence data estimated that nearly 800,000 Americans a year die or are permanently disabled by diagnostic error. That figure is now widely quoted, including in Science.
Against it stands a systematic review that pooled 22 studies covering 80,026 hospitalised adults, in which physicians had read case series of admissions and identified harmful diagnostic errors directly. The pooled rate was 0.7 per cent, with a confidence interval of 0.5 to 1.1 per cent.
The two do not measure quite the same thing: the first covers all settings and includes permanent disability, while the second covers hospitalised adults and counts what reviewers could find in the notes. The pattern still repeats: modelled estimates come out far above counted ones, and the modelled ones are what travel.
What patients can do: the AHRQ’s 20 tips
The research above argues about how many deaths are preventable. Whatever the number, the US Agency for Healthcare Research and Quality (AHRQ) publishes a short list of things a patient can do. This section groups its 20 tips (publication 11-0089, September 2011). The PDF is older, so treat it as a checklist rather than current policy.
| Situation | What to do |
|---|---|
| Medicines | Tell every doctor about all your medicines, including over-the-counter drugs, vitamins and herbs, and bring them to appointments. Tell them about allergies and bad reactions. Make sure you can read the prescription. For each medicine ask its purpose, how and how long to take it, side effects, interactions, and foods or activities to avoid |
| At the pharmacy | Confirm the medicine matches what was prescribed. Ask what a confusing dosing schedule means in actual hours. Ask for a proper tool for liquid medicine, since household spoons hold the wrong amount, and for written information on side effects |
| In hospital | Ask everyone who touches you whether they have washed their hands. At discharge, have the doctor explain the home plan: new medicines, follow-up, when to resume activities, and which earlier medicines to keep taking |
| Surgery | Make sure you, your doctor and your surgeon agree on exactly what will be done, and that the surgeon marks the site. If you have a choice, pick a hospital that does your procedure often |
| Throughout | Speak up; you have the right to question anyone involved in your care. Have one person coordinate your care. Do not assume your doctors share your key information. Bring a family member or friend. Ask why a test or treatment is needed, since more care is not always better. Do not assume no news means normal results; ask how and when you will hear |
What we could not confirm. We could not load the AHRQ web version of the tips, so the date is the 2011 PDF’s. We did not review the Joint Commission’s “Speak Up” campaign. The PDF says to tell and show your doctors your medicines and to bring a family member or friend; it does not use the words “medication list” or “advocate”.
What the official pages say about medical error deaths
US and global agencies give very different counts, and they measure different things. The 250,000-a-year figure is described as flawed by the US patient safety agency. This section sets out what each source says.
| Source | What it says |
|---|---|
| AHRQ PSNet, Agency for Healthcare Research and Quality (US government), Measuring and Responding to Deaths From Medical Errors (March 22, 2016) | Notes the 2016 BMJ estimate of over 250,000 US deaths a year as the third leading cause, which drew significant criticism. The Institute of Medicine estimated 44,000–98,000, and a former AHRQ director about 75,000 preventable in-hospital deaths. It concludes that the toll is tens of thousands a year, and possibly higher. |
| World Health Organization (intergovernmental), Patient safety fact sheet (September 11, 2023) | More than 3 million deaths a year are attributed to unsafe care, about one in 10 patients is harmed in health care, and over half of that harm is preventable. Up to 4 in 100 die in low- and middle-income countries. Harm may cut global growth by 0.7% a year. |
| Shojania and Dixon-Woods, BMJ Quality & Safety (non-government journal), Estimating deaths due to medical error: the ongoing controversy and why it matters (date not shown on the fetched page) | Calls the 251,454-a-year estimate very likely to be wrong. Studies that directly assessed preventability found about 1–3%, the largest recent one 3.6%, and 3.6% of roughly 700,000 hospital deaths is about 25,000. |
| Our comparison | The numbers range from about 25,000 (Shojania) through 44,000–98,000 (IOM) and tens of thousands (AHRQ) to over 250,000 (BMJ 2016). WHO’s 3 million is global and covers all unsafe-care deaths, so it is not comparable to a US count. The 25,000 figure is the journal’s arithmetic on one study, not an official statistic. |
We could not confirm the year of the Shojania paper (the URL suggests volume 26, issue 5 and we did not verify the year), later medical-error studies, or a current US government death count. Figures were read through automated page fetches, so confirm exact numbers on the live pages.
Questions people ask
So is medical error the third leading cause of death or not?
Almost certainly not, on the available evidence. The claim rests on extrapolation from small chart-review studies. Studies that reviewed deaths directly find around 5 per cent of hospital deaths preventable, and the patients concerned were mostly within months of death anyway. Two leading patient-safety methodologists concluded in print that the 251,454 estimate is very likely to be wrong.
Does that mean hospital safety is not a problem?
No, and the researchers behind the argument above say so first. Roughly a quarter of admissions involve an adverse event, and a third of those events are serious. Most patient safety problems do not kill anyone; they cause pain, anxiety, temporary or permanent disability, longer stays and more treatment. Using deaths as the measure understates the problem and points at the wrong things.
Should this change whether I go to hospital?
No. Nothing in this literature compares being admitted with the counterfactual of staying at home with the condition that put you there, and the studies exclude people admitted for palliative care precisely because the comparison would be meaningless. This is research about how to make hospital care safer, not about whether to accept it.
What actually goes wrong most often?
In the English preventable deaths, the three commonest problems were clinical monitoring (failing to act on a test result or a change in condition) at 31.3 per cent, diagnosis at 29.7 per cent, and drug or fluid management at 21.1 per cent. More than one problem was identified in 73.1 per cent of preventable deaths.
Is there anything a patient or family can usefully do?
The evidence here is much thinner than the advice industry around it suggests, so we are not going to invent a checklist. What the data does say is that the common failure is nobody acting on information already in the record, and that most preventable deaths involved more than one problem. Asking what a result means and what happens next is not a proven intervention, but it is aimed at the right place.
The short version
- The US claim that medical error is the third leading cause of death rests on 251,454 deaths a year, extrapolated from a small number of chart reviews. Two senior patient-safety researchers have published that it is very likely to be wrong.
- Reviewers read 1,000 randomly selected English hospital deaths one by one and judged 5.2% (95% CI 3.8–6.6) preventable. A US study of 111 deaths found 6.0%.
- Those patients had a median remaining life expectancy of six months, and 60% had less than a year.
- US reviewers were asked whether the patient would have lived even three more months in good cognitive health. They said yes for 0.5% of deaths, about one per 10,000 admissions.
- Hogan’s figure moves between 2.3% and 8.5% depending only on where the threshold sits on the same six-point scale.
- Detecting an adverse event by record review is reproducible. Judging it preventable is not, and there is no agreed definition of preventability.
- The harm rate is real and large: at least one adverse event in 23.6% of a random sample of 2,809 US admissions in 2018; 22.7% of the events preventable, 32.3% serious.
- The same dispute is now running over diagnostic error: a modelled estimate of nearly 800,000 deaths or permanent disabilities a year, against a pooled chart-review rate of 0.7% of hospitalised adults.
This article summarises published research on patient safety measurement. It is not medical advice, it is not guidance about any individual’s care, and nothing in it should be used as a reason to delay, decline or change treatment. If you have a concern about care you or a family member received, the place to raise it is with the clinical team or the hospital’s own complaints or patient safety process.
Further reading: Hogan and colleagues’ 2012 study and Shojania’s accompanying commentary are both open access and are the two documents that changed how this question should be asked. The 2023 NEJM paper is the current benchmark for how much harm there is.
Sources
- Hogan, H., Healey, F., Neale, G., Thomson, R., Vincent, C. and Black, N., “Preventable deaths due to problems in care in English acute hospitals: a retrospective case record review study”, BMJ Quality & Safety 21:737–745, 2012. (1,000 deaths, 100 each from 10 English acute trusts, year 2009; paediatric, obstetric, psychiatric and palliative admissions excluded. 52 deaths, 5.2%, 95% CI 3.8–6.6, judged preventable at better than an even chance; 39.7% of the 131 cases with a problem in care contributing to death. Stricter threshold 2.3%, looser 8.5%, requiring two reviewers to agree 2.8%. Commonest problems: clinical monitoring 31.3%, diagnosis 29.7%, drugs or fluids 21.1%; more than one problem in 73.1% of preventable deaths. Median life expectancy of those patients six months, IQR four months to two years, 60% under one year. National estimate 11,859 against the Chief Medical Officer’s 60,000–255,000. The authors state their biases would lead to overestimating, not underestimating.)
- Shojania, K.G., “Deaths due to medical error: jumbo jets or just small propeller planes?”, BMJ Quality & Safety, 2012. (Commentary reporting that among 111 in-hospital deaths at seven US Veterans Affairs medical centres, reviewers rated 6.0% as probably or definitely preventable, and that when asked whether the patient would have lived at least three months in good cognitive health absent any problem in care, clinicians estimated 0.5%, 95% CI 0.3–0.7%, roughly one patient per 10,000 admissions. Argues that the small proportion of preventable deaths makes hospital mortality a poor performance measure, while stating that this does not undermine the importance of patient safety.)
- Shojania, K.G. and Dixon-Woods, M., “Estimating deaths due to medical error: the ongoing controversy and why it matters”, BMJ Quality & Safety 26:423, 2017. (Response to Makary and Daniel’s attribution of 251,454 deaths per year in US hospitals to medical error. The authors state that the new estimate is very likely to be wrong and address the role of mortality as a patient safety indicator.)
- Bates, D.W., Levine, D.M., Salmasian, H., Syrowatka, A., Shahian, D.M. and Lipsitz, S.R., “The Safety of Inpatient Health Care”, New England Journal of Medicine, 12 January 2023. (Retrospective cohort study, random sample of 2,809 admissions to 11 Massachusetts hospitals during 2018. At least one adverse event identified in 23.6% of admissions. Of 978 adverse events, 222, 22.7%, judged preventable and 316, 32.3%, of serious severity. Trigger method screening by trained nurses with physician adjudication.)
- Brennan, T.A., Leape, L.L., Laird, N.M., Hebert, L., Localio, A.R. and Lawthers, A.G., “Incidence of adverse events and negligence in hospitalized patients: results of the Harvard Medical Practice Study I”, New England Journal of Medicine, 1991. (30,121 records from 51 randomly selected New York hospitals, 1984. Adverse events in 3.7% of hospitalisations, 95% CI 3.2–4.2; 27.6% due to negligence, 95% CI 22.5–32.6; 70.5% caused disability lasting under six months, 2.6% permanent disability, 13.6% led to death.)
- Sox, H.C. and Woloshin, S., “How many deaths are due to medical error? Getting the number right”, Effective Clinical Practice, 2000. (Audit of the studies the Institute of Medicine cited. They substantiate adverse events in 2.9–3.7% of admissions; support for the claim that about half were preventable is less clear, the original studies did not define preventable adverse events, and the reliability of subjective preventability judgements was never formally assessed. The methods behind the 98,000 upper bound are described as highly subjective with unknown reliability.)
- Klein, D.O., Rennenberg, R., Koopmans, R.P. and Prins, M.H., “Adverse event detection by medical record review is reproducible, but the assessment of their preventability is not”, PLOS ONE, 2018. (Committee re-review of the same records. Good reliability for the presence of an adverse event, only fair reliability for preventability; the authors attribute this to the absence of a definition of preventability and call for international consensus on what constitutes it.)
- Michel, P., Quenon, J.L., de Sarasqueta, A.M. and Scemama, O., “Comparison of three methods for estimating rates of adverse events and rates of preventable adverse events in acute care hospitals”, BMJ, 2004. (778 patients across 37 wards in seven French hospitals. Three detection methods applied to the same sample identify different numbers of cases and different preventable proportions; the authors note there is no gold standard.)
- Newman-Toker, D.E., Nassery, N., Schaffer, A.C., Yu-Moe, C.W., Clemens, G. and Wang, Z., “Burden of serious harms from diagnostic error in the USA”, BMJ Quality & Safety, 2023. (Combines disease-specific diagnostic error and harm rates with national disease incidence from 21.5 million sampled US hospital discharges and cancer registries, with Monte Carlo uncertainty estimates. The widely quoted result is that nearly 800,000 Americans die or are permanently disabled by diagnostic error each year.)
- Gunderson, C.G., Bilan, V.P., Holleck, J.L., Nickerson, P.A., Cherry, B.M. and Chui, P.W., “Prevalence of harmful diagnostic errors in hospitalised adults: a systematic review and meta-analysis”, BMJ Quality & Safety, 2020. (22 studies, 80,026 patients, 760 harmful diagnostic errors identified by physician review of consecutive or randomly selected admissions. Pooled harmful diagnostic error rate 0.7%, 95% CI 0.5–1.1%.)
- James, J.T., “A New, Evidence-based Estimate of Patient Harms Associated with Hospital Care”, Journal of Patient Safety, 2013. (Weighted average of four Global Trigger Tool studies giving a lower limit of 210,000 deaths a year associated with preventable harm, and the author’s own estimate of more than 400,000 given the tool’s limitations.)
- Agency for Healthcare Research and Quality. “20 Tips to Help Prevent Medical Errors” (Publication No. 11-0089, September 2011).
- AHRQ PSNet: Deaths from medical errors; WHO: Patient safety; Shojania & Dixon-Woods, BMJ Quality & Safety.