Job Loss Raised Men’s Death Rate by 44 Per Cent for Four Years, Then the Effect Vanished. Alcohol and Suicide Did Most of It.
Key takeaways · 12 min read
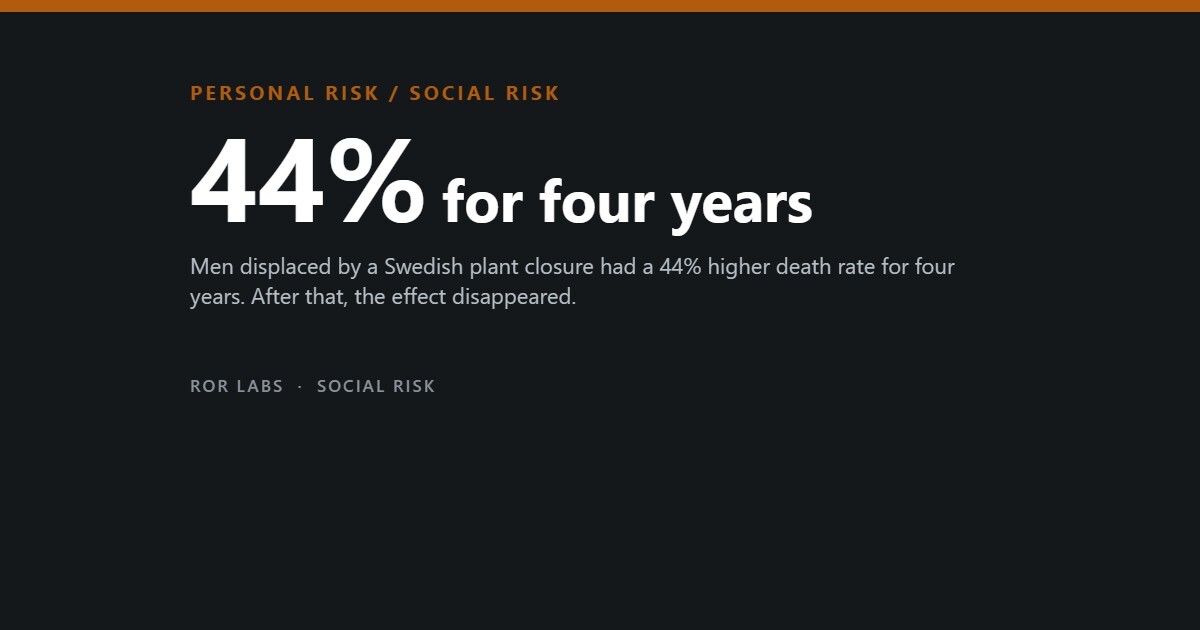
- In the best-identified study, men displaced by an establishment closure had a 44% higher mortality risk over the following four years (HR 1.44, 95% CI 1.19–1.76). After four years the effect was gone.
- Alcohol-related deaths and suicides both roughly doubled in that period. Ischaemic heart disease and smoking-related cancer rose but not significantly.
- For women, no estimate in any period reached statistical significance, though the point estimates were similar and the sample had much less power.
- US administrative data give a larger and more persistent effect: 50–100% higher mortality in the first year, still 10–15% after twenty, implying 1.0–1.5 years of life expectancy lost at age 40.
Two findings in this field are both well established and appear to contradict each other. The first is that losing your job raises your risk of dying. The second is that when a lot of people lose their jobs at once, the death rate goes down.
A 2014 paper in the American Journal of Epidemiology put both in the same model, using nineteen years of the Panel Study of Income Dynamics. Being jobless raised an individual’s hazard of death by an amount equivalent to about ten extra years of age. And each percentage point of increase in the state unemployment rate lowered the hazard of death for everybody in that state, employed or not, by an amount equivalent to about one year less of age.
Both are real. They are not the same population, and they are not the same mechanism. This article is about the first one — what happens to a person who is made redundant — because that is the one you can do something about, and because the size of the effect in the better studies is larger than most people expect and shorter-lived than most people expect.

The cleanest experiment is a factory closing
Comparing people who lose jobs with people who do not is a trap: sick people lose their jobs more often, so any association could be selection running backwards. The standard fix is to study establishment closures, where everyone is separated regardless of health. Marcus Eliason and Donald Storrie identified every establishment closure in Sweden in 1987 and 1988 from linked employer–employee registers, followed those workers for twelve years, and compared them with matched workers who were not displaced.
For men, the mortality risk in the first four years after job loss was 44 per cent higher: hazard ratio 1.44, confidence interval 1.19 to 1.76. Then it stopped. The hazard ratios for the second and third four-year periods were close to one and not significant. For women, none of the estimates in any period reached significance.
The pattern of causes is the interesting part. Deaths from alcohol-related conditions roughly doubled in the first four years, hazard ratio 2.21. Suicides roughly doubled, hazard ratio 2.15. Ischaemic heart disease rose by a third and smoking-related cancer by about half, neither significantly on its own. The authors draw the obvious inference: this looks less like job loss initiating a slow disease process and more like it aggravating something that was already there. Much of the excess reverses in the years afterwards.
Cause-specific mortality, men, first four years after an establishment closure
Hazard ratios against matched non-displaced workers. Sweden, closures of 1987–88, twelve-year follow-up.
In the two subsequent four-year periods the all-cause hazard ratios were close to one and not significant. The alcohol-related ratio actually fell to 0.44, which the authors read as the earliest deaths having been brought forward rather than added.
Eliason, M. and Storrie, D., “Does Job Loss Shorten Life?”, Journal of Human Resources 44(2), 2009.
The American estimate is bigger, and it does not fade
Daniel Sullivan and Till von Wachter matched administrative records of quarterly earnings for Pennsylvanian workers in the 1970s and 1980s to Social Security death records running to 2006. For high-seniority male workers, mortality rates in the year after displacement were 50 to 100 per cent higher than would otherwise have been expected. The effect fell sharply after that, but twenty years later they still estimated a 10 to 15 per cent increase in the annual hazard of death. Sustained indefinitely, that implies a loss of one to one and a half years of life expectancy for a worker displaced at forty.
They also found a dose-response: larger earnings losses went with larger increases in mortality, and the relationship survived when the earnings decline was predicted from industry, firm or firm-size wage premiums rather than measured directly. The authors are careful to say this does not establish that earnings cause health, only that whatever drives the effect travels with the size of the loss.
The earnings losses themselves are substantial and durable. Using thirty years of Social Security records covering the 1982 recession, von Wachter, Song and Manchester found immediate annual earnings losses of about 30 per cent for workers displaced in a mass layoff, still around 20 per cent fifteen to twenty years later.
Four studies, four designs, four answers
| Study | Design | Effect on mortality |
|---|---|---|
| Eliason & Storrie, Sweden | All establishment closures 1987–88, register data, 12-year follow-up | Men HR 1.44 in years 1–4; nothing after; nothing for women |
| Sullivan & von Wachter, Pennsylvania | Administrative earnings matched to death records, up to 26 years | +50–100% in year 1; +10–15% at year 20; 1.0–1.5 years of life expectancy at age 40 |
| Bloemen et al., Netherlands | Older male workers, firm closures, controlling for firm-level mortality | +0.60 percentage points on the probability of dying within five years |
| Zellers et al., Finland | 590,823 workers, 1990s recession, 30-year follow-up | HR 1.17 to 2000, 1.14 to 2005, 1.12 to 2010, 1.09 to 2020 |
Eliason & Storrie 2009; Sullivan & von Wachter, Quarterly Journal of Economics 124(3), 2009; Bloemen, Hochguertel & Zweerink, IZA DP 9483, 2015; Zellers et al., Social Science & Medicine, 2025.
The largest study is also the most recent

Finland’s early-1990s recession was severe enough to be a natural experiment in its own right: GDP fell 14 per cent and unemployment passed 20 per cent. A 2025 study in Social Science & Medicine used Finnish population registers to follow 590,823 private-sector workers who had been securely employed for at least two years before the recession. Of those, 114,257 were displaced by a plant closure or a mass layoff of at least half the workforce, and the researchers followed everyone to the end of 2020 — thirty years, and 93,199 deaths.
All-cause mortality was elevated in the displaced at every follow-up length, and the effect shrank steadily: hazard ratio 1.17 to the year 2000, 1.14 to 2005, 1.12 to 2010, 1.09 to 2020. Deaths from accidents, alcohol, violence and suicide were elevated at every length. Cancer and ischaemic heart disease only became significant at the longer follow-ups, and when the authors disaggregated, the excess turned out to be concentrated in chronic obstructive pulmonary disease and lung cancer — that is, in smoking.
The effect shrinks but does not disappear
Adjusted all-cause mortality hazard ratio for displaced Finnish workers against non-displaced peers, by length of follow-up.
590,823 workers, 114,257 of them displaced, 93,199 deaths over thirty years. Bars are scaled to the excess above 1.00.
Zellers, S. et al., Social Science & Medicine, 2025.
Two details in that study deserve more attention than they usually get. Propensity-score matching reproduced the direction and significance of the findings but attenuated the effect sizes. And when the authors split by year of displacement, workers displaced in 1994 — at the end of the recession, into a recovering labour market — showed no increased mortality risk at all, while those displaced in 1990 and 1991 showed the highest. The same event, four years apart, and one version of it does nothing.
What the counter-evidence looks like
The first is the biomarker result. Michaud, Crimmins and Hurd used objective physiological measures collected by the US Health and Retirement Study rather than self-reports or death records. Workers laid off from their jobs had worse biomarker profiles, particularly glycated haemoglobin. Workers who lost their jobs through a business closure did not. That is precisely backwards from the identification strategy the rest of the literature rests on: closure is supposed to be the clean, exogenous case, and it is the one that showed nothing.
The second is what a mass layoff actually contains. Using Canadian job separation records with stated reasons, researchers found that only about a quarter of separations during a mass layoff were genuine layoffs; the rest were quits and other departures swept into the same window. Isolating the truly involuntary ones roughly doubled the estimated earnings losses, and produced a range from 15 per cent for quits after a mass layoff to 60 per cent for layoffs before one. If the exposure has been that heterogeneous all along, published effect estimates are averages over quite different events.
The third is the newest US estimate, and it is the weakest. Following 7,234 working-age adults in the National Longitudinal Survey of Youth 1979 across 33 years of working life and then ten years of mortality, one layoff was associated with a hazard ratio of 1.23 and two or more with 1.30 — but the confidence intervals were 1.00 to 1.51 and 0.96 to 1.77. The authors describe the association as inconclusive in their own abstract. In absolute terms it worked out at 18.7 and 32.6 excess deaths per 10,000 person-years, or 0.27 and 0.39 years of potential life lost per person.
Three sentences that are all supported
The procyclical-mortality finding is robust across countries and decades and is not seriously disputed; what is disputed is why. Candidate explanations include road deaths, occupational injury, air pollution, working hours and the time available for sleep, exercise and care.
Tapia Granados, J.A. et al., American Journal of Epidemiology 180(3), 2014; Ruhm, C.J., “Are Recessions Good for Your Health?”, Quarterly Journal of Economics, 2000; Michaud, Crimmins and Hurd, 2016.
What the pattern implies
Read together, the studies describe a hazard with a shape. It is front-loaded — largest in the first year or four, decaying afterwards. It runs through behaviour rather than through some direct physiological insult: alcohol, suicide, smoking, and the diseases that follow smoking twenty years later. It is worse for men in every dataset that has looked, though part of that is statistical power. It is worse when the labour market is bad, which is why the same redundancy in 1990 and in 1994 produced different mortality. And it tracks the size of the economic loss rather than the fact of the separation.
The shape of the hazard, as five studies describe it
Which means the modifiable parts are not mysterious. They are the drinking, the smoking, the isolation and the crisis in the first year — and they are visible from the outside, which most fatal risks are not. On the policy side there is suggestive evidence that more generous extended unemployment benefits reduce the mortality associated with mass layoffs, though that analysis is a difference-in-differences on aggregate county data and is better read as a hypothesis than a finding.

Questions people ask
Is this about unemployment or about losing a job?
About losing it. The studies with the strongest designs identify the moment of involuntary separation, not the duration of joblessness afterwards, and the Finnish authors specifically note that they did not model how long anyone stayed unemployed. Eliason and Storrie also point out that their Swedish workers were displaced into a strong labour market and many were re-employed immediately, which if anything makes their 44 per cent an underestimate.
Why is the effect so much weaker for women?
Nobody knows, and the studies cannot distinguish a genuinely smaller effect from an imprecisely measured one: working-age women die much less often, so the confidence intervals are wide. In the Swedish data the point estimates for women on suicide, alcohol-related death and ischaemic disease were almost as large as the men’s, and none reached significance.
Does the risk go away if I find another job quickly?
No study answers that directly, because re-employment is not randomly assigned — healthier people find work faster. What can be said is that the effect is largest where the economic loss is largest, that it is smaller for cohorts displaced into a recovering economy, and that in one study of older workers, re-employment went with better physical functioning and mental health while duration of joblessness did not.
If recessions lower the death rate, is a layoff during one safer?
The two effects apply to different things. The population-level fall in mortality during downturns applies to everybody in the economy, mostly through mechanisms like fewer road miles driven and less industrial activity. The individual-level increase applies to the person who was displaced. The Finnish data suggest the individual effect is worse at the start of a recession than at the end of one.
The short version
- In the best-identified study, men displaced by an establishment closure had a 44% higher mortality risk over the following four years (HR 1.44, 95% CI 1.19–1.76). After four years the effect was gone.
- Alcohol-related deaths and suicides both roughly doubled in that period. Ischaemic heart disease and smoking-related cancer rose but not significantly.
- For women, no estimate in any period reached statistical significance, though the point estimates were similar and the sample had much less power.
- US administrative data give a larger and more persistent effect: 50–100% higher mortality in the first year, still 10–15% after twenty, implying 1.0–1.5 years of life expectancy lost at age 40.
- A Finnish registry study of 590,823 workers found hazard ratios falling from 1.17 over ten years to 1.09 over thirty, with excess deaths from accidents, alcohol, violence and suicide throughout, and from COPD and lung cancer later.
- Workers displaced at the end of that recession, into a recovering labour market, showed no increased mortality risk at all.
- Counter-evidence: in the one study using objective biomarkers, layoffs showed an effect and business closures did not; and only about a quarter of separations during a mass layoff are genuine layoffs.
- At the population level, higher unemployment is associated with lower mortality. Both findings are robust. They are about different units.
This article summarises published research on mortality after involuntary job loss. It is not medical, psychological or financial advice, and it describes averages across large populations rather than anything about an individual. It discusses suicide and alcohol-related death as causes of death in that research. This is a sensitive subject, and if any of it is close to home for you or for someone you know, a doctor or a local support service is the right place to take it.
Further reading: the Eliason and Storrie paper is the one to read if you read only one, both for its design and for its unusually plain discussion of what would falsify it. The Zellers et al. 2025 registry study is the largest and most recent.
- Deaths of Despair, Anne Case & Angus Deaton (2020). The economists who coined the term, on the mortality toll of deindustrialization — already inside the window.
- The Hospital, Brian Alexander (2021). A small Ohio hospital as a lens on deindustrialization and community collapse.
- Can’t Even, Anne Helen Petersen (2020). The economic pressure behind burnout — a companion mechanism to job loss.
Sources
- Eliason, M. and Storrie, D., “Does Job Loss Shorten Life?”, Journal of Human Resources 44(2):277–302, 2009. (All establishment closures in Sweden in 1987–88, register data, twelve-year follow-up. Men, first four years: all-cause HR 1.44, 95% CI 1.19–1.76; alcohol-related 2.21, 1.14–4.31; suicide 2.15, 1.28–3.59; smoking-related cancer 1.48; ischaemic heart disease 1.33. Later periods close to one and non-significant; no significant estimate for women in any period. Excess concentrated in the youngest and oldest male age bands and among divorced and widowed men.)
- Sullivan, D.G. and von Wachter, T., “Job Displacement and Mortality: An Analysis Using Administrative Data”, Quarterly Journal of Economics 124(3):1265–1306, 2009. (Pennsylvanian quarterly earnings records matched to Social Security death records for 1980–2006. High-seniority male workers: mortality 50–100% above expectation in the year after displacement, still 10–15% higher twenty years later, implying 1.0–1.5 years of life expectancy lost at age 40. Larger earnings losses went with larger mortality increases, including when the decline was predicted from industry, firm or firm-size wage premiums; the authors state this does not by itself establish causation.)
- Zellers, S., Azzi, E., Latvala, A., Kaprio, J. and Maczulskij, T., “Causally-informative analyses of the effect of job displacement on all-cause and specific-cause mortality from the 1990s Finnish recession until 2020”, Social Science & Medicine, 2025. (N = 590,823 continuously employed private-sector workers aged 25–55; 114,257 displaced during 1990–94; 93,199 deaths by end-2020. Adjusted all-cause HR 1.17 to 2000, 1.14 to 2005, 1.12 to 2010, 1.09 to 2020. Accidents, alcohol, violence and suicide elevated at all lengths; cancer and ischaemic heart disease only at longer ones, concentrated in COPD and lung cancer. Propensity-score matching preserved direction and significance with attenuated effects. Those displaced in 1994 showed no increased risk, those displaced in 1990–91 the highest. The authors note their exogeneity assumption fails if poor health raises the chance of selection in a downsizing.)
- Tapia Granados, J.A., House, J.S., Ionides, E.L., Burgard, S. and Schoeni, R.S., “Individual joblessness, contextual unemployment, and mortality risk”, American Journal of Epidemiology 180(3):280–287, 2014. (Panel Study of Income Dynamics, 1979–1997, Cox regression. For the unemployed, the hazard of death was raised by an amount equivalent to ten extra years of age; each percentage point of increase in the state unemployment rate reduced the mortality hazard for all individuals by an amount equivalent to one year less of age.)
- Ruhm, C.J., “Are Recessions Good for Your Health?”, Quarterly Journal of Economics 115(2), 2000. (Fixed-effects models on US state panel data showing mortality rising during economic expansions. The source of the procyclical-mortality finding, replicated many times since.)
- Bloemen, H., Hochguertel, S. and Zweerink, J., “Job loss, firm-level heterogeneity and mortality: Evidence from administrative data”, IZA Discussion Paper 9483, 2015. (Dutch administrative data, older male workers with strong labour-force attachment. Firm closure raised the probability of death within five years by 0.60 percentage points, controlling for lagged firm-level average mortality. The authors attribute the effect to stress and lifestyle change.)
- Michaud, P.-C., Crimmins, E. and Hurd, M.D., “The Effect of Job Loss on Health: Evidence from Biomarkers”, 2016. (Health and Retirement Study biomarkers, 2006 and 2008. Workers laid off had worse biomarker measures, particularly glycated haemoglobin; those who lost jobs through a business closure did not. The authors calculate a layoff could raise annual mortality by about 10.3%.)
- Birinci, S., See, K., Park, Y. and Pugh, T., “Uncovering the Differences among Displaced Workers: Evidence from Canadian Job Separation Records”, 2023. (Only about a quarter of mass-layoff separations were genuine layoffs. Isolating the involuntary ones roughly doubled estimated earnings losses, with losses ranging from 15% for quits after a mass layoff to 60% for layoffs before one.)
- von Wachter, T., Song, J. and Manchester, J., “Long-Term Earnings Losses Due to Mass Layoffs During the 1982 Recession”, 2009. (Social Security records covering up to thirty years of earnings. Immediate annual earnings losses of about 30% for workers displaced in a mass layoff, still about 20% after fifteen to twenty years, robust across age and industry groups.)
- Yu, X., Kezios, K., Swift, S.L., Moropoulos, K. and Zeki Al Hazzouri, A., “Layoff experience in adulthood and all-cause mortality among US adults, 1979–2022”, Innovation in Aging, 2025. (7,234 adults in the NLSY79; layoffs 1979–2012, mortality 2012–2022. One layoff HR 1.23, 95% CI 1.00–1.51; two or more 1.30, 0.96–1.77; 18.71 and 32.61 excess deaths per 10,000 person-years; 0.27 and 0.39 excess years of potential life lost. The authors call the association inconclusive.)
- Gallo, W.T., Bradley, E.H., Siegel, M. and Kasl, S.V., “Health effects of involuntary job loss among older workers”, Journals of Gerontology: Social Sciences 55(3), 2000. (209 workers who experienced involuntary job loss against 2,907 continuously employed. Significant negative effects on physical functioning and mental health after controlling for baseline health; among the displaced, re-employment was positively associated with both, duration of joblessness with neither.)
- Aldenhoff, E.S., “Unemployment Benefit Increases and Mortality”, 2014. (County-level difference-in-differences across all fifty US states. A one per cent increase in mass layoffs was associated with a 0.35 per cent increase in mortality; extended benefits were protective. Aggregate data, treated here as suggestive.)