Eighty-Seven Per Cent of Boil-Water Advisories in One State Followed a Broken Pipe, Not a Positive Test. Nobody Has Shown the Advisories Themselves Reduce Illness.
Key takeaways · 11 min read
- In Kentucky over seventeen years, 87% of 36,673 boil-water advisories were issued because of a line break or leak, not because of a positive test. Average duration was five days.
- A pressure loss stops the pipe being a sealed system. That is the mechanism, and it has the best evidence in the field: pooled relative risk of gastrointestinal illness 3.26 (1.48–7.19) after outages in continuous systems, 2.34 (1.13–4.86) in developed countries alone.
- The same review found publication bias among those studies and says its pooled estimates may be higher than the true risk.
- Household point-of-use treatment versus tap water: incidence density ratio 1.52 in unblinded trials, 0.98 in blinded ones. When people cannot tell whether their filter is real, the benefit disappears.
On the evening of 7 April 1993, Milwaukee told its residents to boil their drinking water. By then an estimated 403,000 people across five counties had already been infected with Cryptosporidium. It remains the largest waterborne outbreak in United States history, and the advisory that made it famous arrived after the exposure was over.
That is the awkward thing about boil-water advisories. They are the most visible tool in drinking-water safety, they are issued tens of thousands of times a year across developed countries, and there is remarkably little evidence that the advisory itself changes anyone’s health. What there is good evidence for is the thing that triggers most of them — a pipe losing pressure — which turns out to be associated with a threefold increase in gastrointestinal illness whether or not anybody sends a notice.
This article is about the gap between those two facts: a real mechanism, a widely used warning, and a body of research that keeps failing to show the warning working. It is also about what happens to the evidence for household water filters when the people using them are not told whether the filter is real.

Why the notice usually arrives
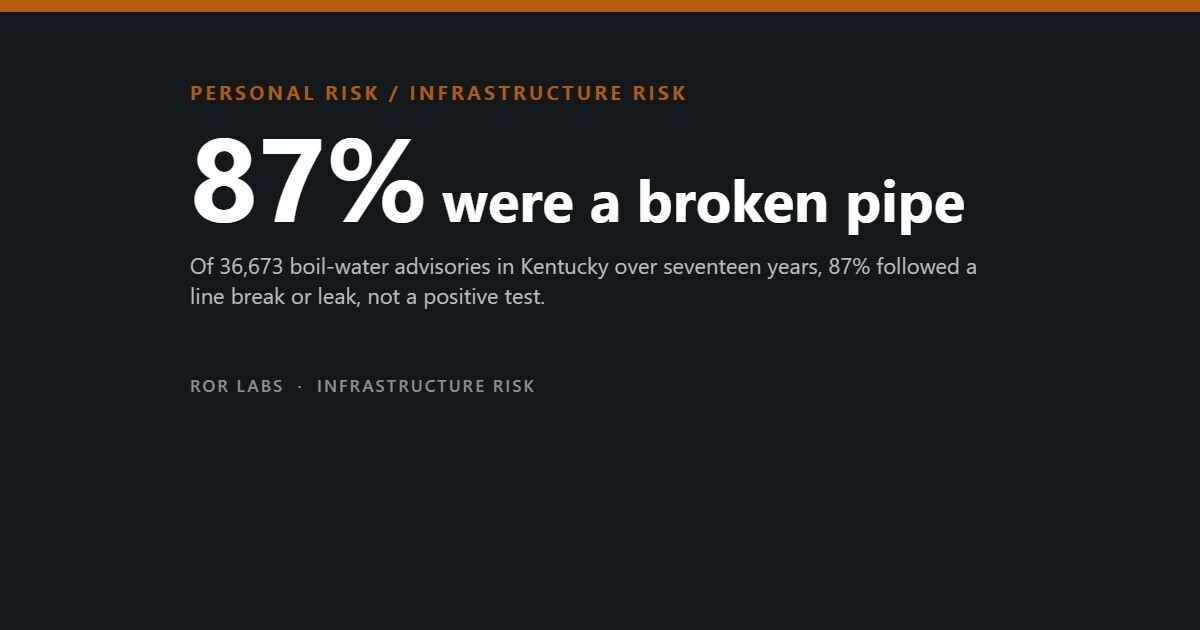
A study published in Water in 2024 catalogued every drinking-water advisory in Kentucky over seventeen years: 36,673 boil-water advisories, across 378 water systems, from 2004 to 2020. The leading reason for issuing one was not a positive microbiological test. It was a line break or a leak, which accounted for 87 per cent of them. The average advisory lasted five days. Over the study period the number issued rose while the average duration fell.
This is the normal case, and it is worth understanding why it is not negligence. When pressure in a distribution main drops, the pipe stops being a sealed system. Groundwater, soil water and, where a sewer runs nearby, sewage can be drawn in through leaks, joints and air-valve vaults that are perfectly harmless while the pipe is pressurised. Nobody tests for a pathogen because the utility has no idea what, if anything, came in. The advisory is precautionary by design.
What 36,673 advisories were actually issued for
All boil-water advisories in Kentucky, 2004–2020, across 378 public water systems.
Average duration five days. The count of advisories rose over the seventeen years while their average length fell — consistent with more responsive utilities, ageing pipes, or both.
Alzahrani, F. and Tawfik, R., “Public Water Service Disruptions: A Descriptive Analysis of Boil Water Advisories”, Water 16(3):443, 2024.
The mechanism has good evidence behind it
In 2014, a systematic review and meta-analysis in Environmental Health Perspectives pulled together the studies on routine distribution-system problems — not outbreaks, the ordinary background rate of illness. Across four studies in continuously operated systems in developed and middle-income countries, a water outage was associated with a pooled relative risk of gastrointestinal illness of 3.26, with a confidence interval from 1.48 to 7.19. Restricting the pool to developed countries alone brought it down to 2.34, interval 1.13 to 4.86.
Duration mattered. In a Norwegian cohort, outages lasting more than six hours carried higher odds than shorter ones. In systems with chronic intermittent supply, an interruption longer than a day carried a relative risk of about 1.4 against one lasting a single day. Loss of chlorine residual pointed the same way: one study estimated that an interquartile decrease of 0.22 mg/L in free chlorine in the network was associated with an incidence density ratio of 1.42.
What loses you a working pipe, and what it costs
| Distribution system deficiency | Pooled effect on gastrointestinal illness | Studies |
|---|---|---|
| Water outage, continuous systems | RR 3.26 (95% CI 1.48–7.19); 2.34 (1.13–4.86) in developed countries only | 4 |
| Chronic intermittent supply vs full-day supply | OR 1.61 (95% CI 1.26–2.07) | 2 |
| Interruption longer than one day vs one day | RR 1.42 (95% CI 1.11–1.82) | 2 |
| Loss of free chlorine residual (0.22 mg/L interquartile decrease) | IDR 1.42 (95% CI 1.05–1.91) | 1 of 3, only one significant |
Begg’s test on the outage studies indicated publication bias (p = 0.04). The authors state plainly that their pooled estimates may therefore be higher than the true health risk.
Ercümen, A., Gruber, J.S. and Colford, J.M., “Water Distribution System Deficiencies and Gastrointestinal Illness: A Systematic Review and Meta-Analysis”, Environmental Health Perspectives 122(7), 2014.
The result that should change how you shop
The same review looked at a second question: does drinking tap water make you ill compared with drinking water treated at the point of use — that is, through a household filter? In systems documented to have deficiencies, the pooled answer was an incidence density ratio of 1.34, with a confidence interval running from 1.00 to 1.79. Just significant, in the direction you would expect.
Then the authors split the studies by blinding. In the three trials where participants did not know whether their device was a real filter or a sham, the pooled incidence density ratio was 0.98, with a confidence interval of 0.90 to 1.08 — nothing at all. In the three non-blinded trials it was 1.52, interval 1.05 to 2.20. And in the single trial conducted in a properly functioning distribution system, there was no association either.
The honest reading is not that filters do nothing. It is that when people know they are being protected, they report less illness, and when they do not know, the difference disappears. Self-reported diarrhoea is a soft outcome and it moves with expectation. That single contrast is the most important thing in the review, and it is the reason there are no filter links on this page.
Tap water versus point-of-use treated water, split by blinding
Incidence density ratio for gastrointestinal illness. Above 1 means more illness on tap water.
Boiling is a different question from filtering. Boiling reliably inactivates Cryptosporidium, which resists ordinary chlorination and is the pathogen that caused Milwaukee. Nothing in this figure argues against boiling; it argues against buying a device on the strength of unblinded self-reported illness data.
Ercümen et al., 2014, Table 2.
And the advisories themselves do not show up in the illness data
The cleanest attempt to test whether advisories work is a case-crossover study in South Carolina covering 2013 to 2017 and 25,969 emergency-room and urgent-care diagnoses of gastrointestinal illness. It looked at two exposures: sanitary sewage overflows, and boil-water advisories, each in three windows after the event.
Sewage overflows showed up clearly. In the nought-to-four-day window, the odds of a gastrointestinal diagnosis rose by 13 per cent, confidence interval 9 to 18 per cent, and by 8 per cent for each additional overflow. Nothing at five to nine days or ten to fourteen. Boil-water advisories, on their own, showed no association in any of the three windows — odds ratio 1.04 at nought to four days, with a confidence interval crossing 1, and slightly below 1 in the two later windows.
The authors are careful about what that means. They had hypothesised that advisories would be associated with more illness, because they mark the pressure events that let contamination in. They found neither more nor less, and they note that advisories co-occurring with a sewage overflow did not reduce diagnoses, so they could not be considered protective. This is not proof that advisories fail. Emergency-room diagnoses capture only the severe end of gastrointestinal illness, most cases never reach a clinician, and an advisory that works would reduce a count that was already small and noisy. But it is the study that exists, and it did not find the effect.
What people actually do when the notice arrives
Compliance is not one number, it is a list. A telephone survey in Newfoundland and Labrador asked residents who had experienced an advisory what they had boiled water for. Drinking: 74 per cent. Cooking: 74 per cent. Mixing juice: 64 per cent. Washing ready-to-eat fruit and vegetables: 62 per cent. Making ice cubes: 57 per cent. Brushing teeth: 56 per cent. Making baby formula: 47 per cent.
That last figure is the one to sit with. In a province that had 215 advisories in a single year, fewer than half the households making up infant formula during one were boiling the water first.
Boiled the water for this activity
Residents of Newfoundland and Labrador who had experienced a boil-water advisory, surveyed 2007.
98% of those who had experienced an advisory said it was important to them to be told why it had been issued. Among the dissatisfied, the most common complaint (47%) was that no reason had been given at all.
Jones-Bitton, A., Gustafson, D.L., Butt, K. and Majowicz, S.E., “Does the public receive and adhere to boil water advisory recommendations?”, BMC Public Health, 2015. Response rate 25.9%; self-reported adherence may be overstated.
Compliance is not uniformly poor, though, and the variation is instructive. After a contamination incident at a reservoir in Konnerud, Norway, 97.6 per cent of respondents remembered receiving the advisory and 94.6 per cent of those complied, giving effective compliance of 92.3 per cent. The commonest reason among the small non-complying minority was believing there was little or no risk of getting ill from the water. In the Netherlands in 2007, 82 per cent of households in the affected area complied — but most of them were still brushing their teeth, washing salad and washing fruit with unboiled water.
And at the other end: in Gideon, Missouri, in 1993, an unchlorinated town supply of 1,100 people produced more than 650 cases of salmonellosis, 15 hospitalisations and seven deaths. Thirty-one per cent of city households drank unboiled water after being told about the order. Asked why, 44 per cent said they had not remembered it, and 25 per cent said they had not believed it.
The Milwaukee arithmetic
Corso, P.S. et al., “Costs of Illness in the 1993 Waterborne Cryptosporidium Outbreak, Milwaukee, Wisconsin”, Emerging Infectious Diseases 9(4), 2003; Guerrant, R.L., “Cryptosporidiosis: an emerging, highly infectious threat”, Emerging Infectious Diseases, 1997.

Questions people ask
If most advisories are just pipe breaks, can I ignore them?
No, and the reason is that a pipe break is the mechanism, not an excuse. The strongest evidence in this whole area is that water outages in normally continuous systems are associated with roughly a two- to threefold increase in gastrointestinal illness. The advisory is precautionary because nobody knows what came in through the depressurised pipe — not because nothing did.
How long do I need to boil it?
Bringing water to a rolling boil is sufficient; the pathogens of concern do not survive it. Public health agencies in different countries recommend anything from “bring to a boil” to one or three minutes, with longer times at high altitude. Follow whatever your own water authority says in the notice, because they know what they are worried about and you do not.
Is bottled water a substitute?
It is what most people choose. Studies of consumer behaviour during advisories consistently find that people prefer bottled water to boiling even when the notice says boil, and prefer both to chlorinating water themselves. Bottled water is a reasonable choice for drinking. It stops being a plan when the advisory reaches day five and you still have to wash the salad and brush your teeth.
Does a household filter make me safe during an advisory?
Not as a general answer. Ordinary carbon pitcher and tap filters are not designed to remove bacteria or protozoan cysts, and when household filtration has been tested against gastrointestinal illness in blinded trials, the benefit disappeared entirely. Devices certified specifically for cyst reduction do exist and are genuinely different from a taste-and-odour filter, but the notice will tell you to boil, and boiling costs nothing and cannot be mis-specified.
Who should be most careful?
Infants, particularly for formula, where the observed compliance rate is worst; people who are immunocompromised, who were the ones who died in Milwaukee; the very old; and anyone in a household where an advisory has run long enough that everyone has stopped thinking about it. Long advisories are where compliance decays — in one British outbreak, 12 per cent of those complying stopped before the sixteen-day notice was lifted.
The short version
- In Kentucky over seventeen years, 87% of 36,673 boil-water advisories were issued because of a line break or leak, not because of a positive test. Average duration was five days.
- A pressure loss stops the pipe being a sealed system. That is the mechanism, and it has the best evidence in the field: pooled relative risk of gastrointestinal illness 3.26 (1.48–7.19) after outages in continuous systems, 2.34 (1.13–4.86) in developed countries alone.
- The same review found publication bias among those studies and says its pooled estimates may be higher than the true risk.
- Household point-of-use treatment versus tap water: incidence density ratio 1.52 in unblinded trials, 0.98 in blinded ones. When people cannot tell whether their filter is real, the benefit disappears.
- In the one case-crossover study of the question, sewage overflows raised gastrointestinal emergency visits by 13% within four days; boil-water advisories on their own showed no association in any window, and were not protective when they coincided with an overflow.
- Compliance is partial and unevenly distributed: 74% boiled for drinking, 56% for brushing teeth, 47% for making baby formula.
- Compliance can be high when communication is good — 92% effective compliance in a Norwegian incident — and the commonest reasons for ignoring an advisory are forgetting it and disbelieving it.
- Milwaukee 1993: 403,000 ill, 4,400 hospitalised, mean illness twelve days, advisory issued after the exposure. It remains the largest waterborne outbreak recorded in the United States.
This article summarises published research on drinking-water advisories and distribution-system failures. It is not medical advice and it is not a substitute for the instructions in an advisory issued by your own water authority, which will be specific to what has actually happened to your supply. If you are told to boil, boil.
Further reading: the Ercümen, Gruber and Colford meta-analysis is open access at Environmental Health Perspectives and its Table 2 is the single most useful thing published on household water treatment. Your water utility’s annual consumer confidence report, or its national equivalent, will tell you what your own system’s deficiencies are.
- The Rules of Contagion, Adam Kucharski (2020). An epidemiologist’s general theory of contagion and outbreak response.
- How to Read Numbers, Tom Chivers & David Chivers (2021). Common statistical traps explained through news examples.
- The Data Detective, Tim Harford (2020). Ten rules for reading numbers in the news skeptically.
Sources
- Alzahrani, F. and Tawfik, R., “Public Water Service Disruptions: A Descriptive Analysis of Boil Water Advisories”, Water 16(3):443, 2024. (All Kentucky counties, 2004–2020: 378 water systems, 36,673 boil-water advisories. Average duration five days. 87% issued because of a line break or leak; 92% occurred in surface-water systems; 54% in large systems; 29% in the summer months. The number issued rose over the period while average duration fell.)
- Ercümen, A., Gruber, J.S. and Colford, J.M., “Water Distribution System Deficiencies and Gastrointestinal Illness: A Systematic Review and Meta-Analysis”, Environmental Health Perspectives 122(7):651–660, 2014. (Outages in continuous systems, four pooled studies: RR 3.26, 95% CI 1.48–7.19; developed countries only 2.34, 1.13–4.86. Chronic intermittency OR 1.61, 1.26–2.07; intermittency over one day RR 1.42, 1.11–1.82. A 0.22 mg/L interquartile fall in chlorine residual, IDR 1.42, 1.05–1.91, the only significant estimate of three. Tap versus point-of-use treated water in deficient systems, IDR 1.34, 1.00–1.79; non-blinded 1.52, 1.05–2.20; blinded 0.98, 0.90–1.08; no association in the single properly functioning system. Begg’s test p = 0.04; the authors state pooled estimates may exceed the true risk.)
- Rothenberg, S.E. et al., “Sanitary sewage overflows, boil water advisories, and emergency room and urgent care visits for gastrointestinal illness: a case-crossover study in South Carolina, USA, 2013–2017”, Journal of Exposure Science and Environmental Epidemiology 33:102–110, 2023. (25,969 cases. Sewage overflow at 0–4 days: OR 1.13, 95% CI 1.09–1.18; nothing at 5–9 or 10–14 days. Advisories: OR 1.04, 0.988–1.08 at 0–4 days and below 1 in both later windows, none significant; advisories coinciding with an overflow did not reduce diagnoses and were not considered protective.)
- Jones-Bitton, A., Gustafson, D.L., Butt, K. and Majowicz, S.E., “Does the public receive and adhere to boil water advisory recommendations? A cross-sectional study in Newfoundland and Labrador, Canada”, BMC Public Health 15:1274, 2015. (Adherence: drinking 74.4%, cooking 74.3%, juice 64.1%, ready-to-eat produce 61.5%, ice 56.5%, teeth 56.3%, baby formula 47.0%. 215 advisories in the province in one year, affecting 145 communities. 98.3% wanted to be told why; among the dissatisfied, 46.7% said no reason was given. Response rate 25.9%, with possible recall and social-desirability bias.)
- Franer, K., Meijerink, H. and Hyllestad, S., “Compliance with a boil water advisory after the contamination of a municipal drinking water supply system in Norway”, Journal of Water and Health, 2020. (Konnerud, population 10,314; 2,451 of 9,312 invited responded. 97.6% remembered the advisory, 94.6% of those complied, effective compliance 92.3%. The main reason for non-compliance was a perception of low or no risk.)
- Angulo, F.J. et al., “A community waterborne outbreak of salmonellosis and the effectiveness of a boil water order”, American Journal of Public Health 87(4):580–584, 1997. (Gideon, Missouri, 1993; unchlorinated community supply serving 1,100 people. More than 650 ill, 15 hospitalised, seven died. Consuming city water: RR 9.1, 95% CI 2.9–28.4, with attack rate rising with consumption. 31% of city households drank unboiled water after being informed of the order, including 14 people who then became ill; reasons given were not remembering, 44%, and disbelieving the order, 25%.)
- Karagiannis, I., Schimmer, B. and de Roda Husman, A.M., “Compliance with boil water advice following a water contamination incident in the Netherlands in 2007”, Eurosurveillance 14(12), 2009. (North Holland, E. coli detected in tap water, advice lifted after six days. 81.8% of respondents in the affected area reported complying against 5.6% in unaffected areas; most of those complying still used unboiled water to brush teeth and to wash salad and fruit.)
- Willocks, L.J. et al., “Compliance with advice to boil drinking water during an outbreak of cryptosporidiosis”, Communicable Disease and Public Health, 2000. (Survey of hospital employees in an area of 300,000 households under a sixteen-day advisory. 85% used boiled water, 72% used bottled water, 12% stopped boiling before the notice was lifted. Although 88% believed they were following the advice, 20% washed food to be eaten raw and 57% cleaned their teeth with unboiled tap water.)
- Corso, P.S., Kramer, M.H., Blair, K.A., Addiss, D.G., Davis, J.P. and Haddix, A.C., “Costs of Illness in the 1993 Waterborne Cryptosporidium Outbreak, Milwaukee, Wisconsin”, Emerging Infectious Diseases 9(4), 2003; and Guerrant, R.L., “Cryptosporidiosis: an emerging, highly infectious threat”, Emerging Infectious Diseases 3(1), 1997. (403,000 estimated illnesses across five counties after adjusting for background diarrhoeal rates; about 354,600 sought no care, 44,000 were outpatients, 4,400 were hospitalised. 52% attack rate in the affected plant’s area; mean illness twelve days. Reported 5 April 1993, diagnosed 7 April, advisory issued that evening.)
- Lindell, M.K., Mumpower, J.L., Huang, S.-K., Wu, H.-C. and Samuelson, C.D., “Exposure Path Perceptions and Protective Actions in Biological Water Contamination Emergencies”, 2015, and “Perceptions of protective actions for a water contamination emergency”, Journal of Risk Research, 2017. (Boston residents and Texas students. People distinguish only weakly between exposure paths, and consistently prefer bottled water to boiled water and both to self-chlorinated water; perceived effectiveness in protecting health was the strongest correlate of which action they took.)