How Nutrients Are Classified — and What the Reference Numbers Mean
In This Series: Nutrients
- Which Nutrients Are You Actually Short Of?
- Vitamin A: Food Sources, Deficiency, and Safe Limits
- Vitamin C: Food Sources, Scurvy, and the Ceiling the Body Sets
- Vitamin D: Food Sources, Sunlight, and What the Trials Found
- Vitamin D2 vs D3: What the Head-to-Head Trials Found
- Riboflavin: Food Sources, Deficiency, and the Migraine Trials
- Thiamin: Food Sources, Beriberi, and Why There Is No Upper Limit
- Calcium: Food Sources, Bone Density, and What the Trials Found
Key takeaways · 9 min read
- Six conventional classes: carbohydrate, protein, fat, vitamins, minerals, water. The first three carry energy and are counted in grams; vitamins and minerals carry none.
- Thirteen vitamins, four of them fat-soluble. The count and the letters are historical, not biological.
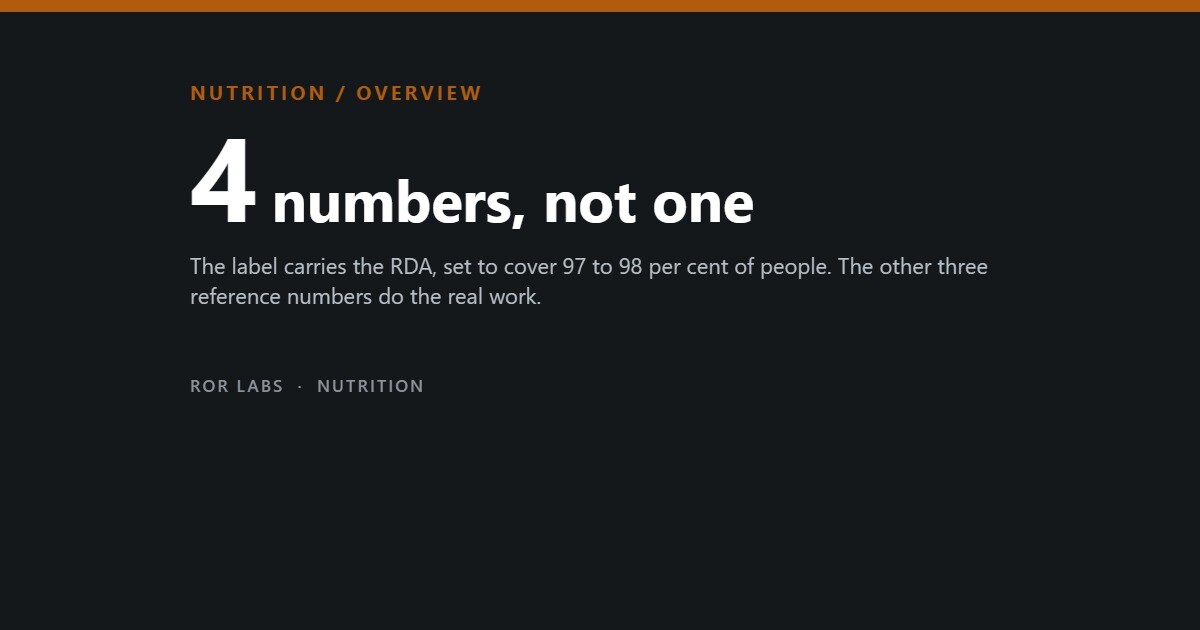
- Four reference numbers, not one. The EAR covers half a group, the RDA 97 to 98 per cent, the AI is a placeholder, the UL is a ceiling.
- An intake below the RDA is not a deficiency. Populations are judged against the EAR; nutrients with only an AI yield no prevalence of inadequacy at all.
In this article
- What has to be true for something to be a nutrient
- Energy-yielding and regulating: the split, and the scale
- There are four reference numbers, and only one of them is on the label
- How firm is the ground under those numbers
- How many people fall short, and why the answer moves so much
- Questions people ask
- The short version
- Sources
Nutrient classification looks like the most settled thing in nutrition. Macronutrients give you energy, micronutrients do not; vitamins and minerals sit underneath. It is a useful map, and almost every line on it is a convention agreed by committees rather than a boundary found in nature — including the count of the vitamins, which is 13 for historical reasons, and the number on a cereal box, which is deliberately set higher than what almost anybody needs.
That does not make the map wrong. It makes it readable. Once you know the Recommended Dietary Allowance is built to cover 97 to 98 per cent of healthy people, an intake below it stops meaning what it appears to mean; once you know the headline “five billion people do not get enough” comes from a model of diets rather than from anybody’s blood, you can read the next one properly.
This is the opening entry of an appendix that works down the tree one nutrient at a time: what each does, which foods carry it per measured spoonful, what running short does, and what the reference numbers are. This page is the map, and the part usually skipped — where those numbers came from.
What has to be true for something to be a nutrient
The working definition is stricter than it sounds. An essential nutrient is one the body cannot make enough of, which has to come from the diet, whose absence produces a specific reproducible deficiency, and which reverses that deficiency when supplied again. The last clause does the work; plenty of useful food components never clear it.
Six classes qualify: carbohydrate, protein, fat, vitamins, minerals and water. The first three are counted in grams and carry energy; the next two are counted in milligrams and micrograms and carry none. Water belongs to neither camp — no energy, but litres a day.
The tree this appendix works down
The six conventional classes of nutrient, and how the two with the most entries are subdivided.
Energy-yielding and regulating: the split, and the scale
Korean textbooks make the same cut with different names, the three energy nutrients against the regulating nutrients, and the second label describes the function better than the English one describes the size. Micronutrients are not small macronutrients: they sit inside enzymes, switch genes on and off, carry oxygen and hold the structure of bone and blood. An adult man’s recommended protein intake is 56 grams a day and his recommended vitamin B12 intake is 2.4 micrograms — roughly 23 million to one, between two things both called nutrients.
How far apart the daily amounts are
Recommended intakes for an adult man, converted to a common unit. US Dietary Reference Intakes.
| Nutrient | Usual unit | Same amount in micrograms |
|---|---|---|
| Protein | 56 g | 56,000,000 |
| Calcium | 1,000 mg | 1,000,000 |
| Vitamin C | 90 mg | 90,000 |
| Vitamin A | 900 µg RAE | 900 |
| Vitamin B12 | 2.4 µg | 2.4 |
Source: Institute of Medicine / National Academies, Dietary Reference Intakes; values as tabulated by the NIH Office of Dietary Supplements.
There are four reference numbers, and only one of them is on the label
Until the late 1990s there was one figure per nutrient. It was replaced by a set of four, the Dietary Reference Intakes, because a single number was being asked to do several incompatible jobs.
The Estimated Average Requirement meets the requirement of half the healthy people in an age and sex group. The Recommended Dietary Allowance is the EAR plus two standard deviations, which puts it above the requirement of 97 to 98 per cent of them. The Adequate Intake is used where the evidence will not support an EAR at all — an observed intake of apparently healthy people, not a measured requirement. The Tolerable Upper Intake Level is where the risk of harm starts to rise.
The consequence gets lost. Because the RDA is set deliberately high, an intake below it is not a deficiency and is not evidence of one; populations are assessed against the EAR instead. And a nutrient with only an Adequate Intake yields no prevalence of inadequacy at all — which does not stop one from being calculated.
What each of the four numbers is for
US and Canadian Dietary Reference Intakes, as set out by the Institute of Medicine.
| Number | Covers | Proper use |
|---|---|---|
| EAR | 50% of the group | Assessing whether a population is short. |
| RDA | 97–98% of the group | A planning target for an individual. Not a diagnostic threshold. |
| AI | Unknown | Placeholder where no EAR can be derived. Yields no prevalence of inadequacy. |
| UL | Ceiling | The point above which risk rises. Not a target. |
How firm is the ground under those numbers
Firmer for some than others, and the people who built the framework have said so. Reviewing the process afterwards, Robert Russell noted that the committees ran into an absence of dose-response data for most nutrients and very few chronic human studies, and that the approach assumes a threshold requirement which may not exist for every nutrient.
George Beaton, who worked on these reference values for decades, went further in 2006: the RDA is neither needed nor soundly based for the work it is asked to do, and the median requirement and the upper level are the two values that matter. That is an insider’s complaint about the most quoted number in nutrition, published in a mainstream review, and it has not changed a single food label — worth holding in mind, because every entry in this appendix quotes an RDA.
How many people fall short, and why the answer moves so much
In 2024 a modelling study in The Lancet Global Health produced the first global estimate of inadequate intakes for 15 micronutrients, covering 99.3 per cent of the world’s population across 185 countries. The numbers are large and were widely reported.
Estimated inadequate intake, 15 micronutrients
Share of the global population whose modelled intake from food falls below requirement. Highest three and lowest three shown.
Source: Passarelli, S. et al., “Global estimation of dietary micronutrient inadequacies: a modelling analysis”, The Lancet Global Health 12(10), 2024.
The authors are precise about what those figures are not. The intake distributions behind them are modelled from dietary data collected in only 31 countries. They exclude supplements and fortification entirely, which the authors say probably overstates the shortfall for iodine, since UNICEF estimates 89 per cent of the world consumes iodised salt. And except for iron and zinc the model ignores bioavailability and nutrient interactions, because — in their words — nutritional science is not advanced enough to do it accurately.
Measure the same problem differently and the answer moves. A 2022 pooled analysis in the same journal used biomarkers instead of diets, reanalysing individual-level data from 24 nationally representative surveys, and put 56 per cent of preschool-aged children and 69 per cent of non-pregnant women as deficient in at least one of three micronutrients. A 2023 review then lined up the published national estimates for iron, vitamin A and zinc against each other for the same countries and years, and found considerable variation — largest exactly where a proxy had stood in for the recommended biomarker. Three methods, three answers, and the spread between them is not sampling noise. It is the choice of method.
Questions people ask
What is the actual difference between a macronutrient and a micronutrient?
Energy and quantity, in that order. Macronutrients are metabolised for energy — carbohydrate and protein at about 4 kilocalories per gram, fat at about 9 — and are needed in grams. Micronutrients yield no energy and are needed in milligrams or micrograms.
Are there really only 13 vitamins?
Thirteen is the settled count: A, C, D, E, K and the eight B vitamins. The gaps in the alphabet are real history — several substances were named as vitamins and later found to be compounds already on the list, or not essential in humans at all, and the letters were never reassigned.
If my intake is below the RDA, am I deficient?
No, and the RDA was not built to answer that question. It sits two standard deviations above the average requirement, so most people whose intake falls below it are still meeting their own. Deficiency is a clinical or biochemical finding, not an arithmetic comparison against a label.
Can you be short of a nutrient without any symptoms?
That is the normal case rather than the exception. Classical deficiency diseases sit at the end of a long subclinical stretch in which biochemical measures have moved and nothing is visible. It is also why intake models and biomarker surveys disagree: they look at different points on that stretch.
The short version
- Six conventional classes: carbohydrate, protein, fat, vitamins, minerals, water. The first three carry energy and are counted in grams; vitamins and minerals carry none.
- Thirteen vitamins, four of them fat-soluble. The count and the letters are historical, not biological.
- Four reference numbers, not one. The EAR covers half a group, the RDA 97 to 98 per cent, the AI is a placeholder, the UL is a ceiling.
- An intake below the RDA is not a deficiency. Populations are judged against the EAR; nutrients with only an AI yield no prevalence of inadequacy at all.
- Modelled intakes put 5.1 billion people below requirement for iodine and 4.9 billion for iron — but exclude supplements and fortification, and rest on distributions from 31 countries.
- Biomarker surveys give 56 per cent of preschool children deficient in at least one of three micronutrients. The gap between the methods is method, not noise.
This appendix is a reference shelf, not clinical guidance. It reports what published studies and public health agencies have measured, and is not a substitute for advice about your own diet, medication or medical conditions.
Further reading: Passarelli 2024 and Stevens 2022 are best read back to back — same journal, same problem, different instruments, visibly different answers. Beaton’s 2006 review is the shortest route to why the RDA is the wrong number for the job it is usually given.
- The Data Detective, Tim Harford (2020). Ten rules for reading numbers in the news skeptically.
- How to Read Numbers, Tom Chivers & David Chivers (2021). Common statistical traps explained through news examples.
- Slow Cooked, Marion Nestle (2023). A career spent tracing industry funding effects on nutrition science.
Sources
- Institute of Medicine, Dietary Reference Intakes: Applications in Dietary Assessment, National Academies Press, 2000. (EAR meets the requirement of 50% of a group; RDA is the EAR plus two standard deviations, covering 97–98%; the AI cannot yield a prevalence of inadequacy.)
- Barr, S.I., “Introduction to dietary reference intakes”, Applied Physiology, Nutrition, and Metabolism 31(1), 2006, pp.61–65.
- Murphy, S.P. and Poos, M.I., “Dietary Reference Intakes: summary of applications in dietary assessment”, Public Health Nutrition 5(6A), 2002, pp.843–849.
- Beaton, G.H., “When is an individual an individual versus a member of a group?”, Nutrition Reviews 64(5), 2006, pp.211–225. (Median requirement and UL are the critical values; the RDA is neither needed nor soundly based for the uses made of it.)
- Russell, R.M., “Setting dietary intake levels: problems and pitfalls”, Novartis Foundation Symposium 282, 2007, pp.29–42. (Absence of dose-response data for most nutrients; the threshold assumption may not hold for all.)
- Passarelli, S. et al., “Global estimation of dietary micronutrient inadequacies: a modelling analysis”, The Lancet Global Health 12(10), 2024. (Iodine 5.1bn/68%; vitamin E 5.0bn/67%; calcium 5.0bn/66%; iron 4.9bn/65%; niacin 1.7bn/22%; thiamin 2.2bn/30%; magnesium 2.4bn/31%. Distributions from 31 countries; excludes supplements and fortification; 89% of the world consumes iodised salt.)
- Stevens, G.A. et al., “Micronutrient deficiencies among preschool-aged children and women of reproductive age worldwide”, The Lancet Global Health 10(11), 2022. (24 surveys, 2003–2019; 56% of children and 69% of non-pregnant women deficient in at least one of three micronutrients.)
- Hess, S.Y. et al., “Comparison of published estimates of the national prevalence of iron, vitamin A, and zinc deficiency”, Advances in Nutrition 14(5), 2023. (Largest inconsistencies where proxies replaced recommended biomarkers.)
- NIH Office of Dietary Supplements, nutrient fact sheets (health professional versions), Bethesda, MD.