Vitamin D2 vs D3: What the Head-to-Head Trials Found
In This Series: Nutrients
- Which Nutrients Are You Actually Short Of?
- How Nutrients Are Classified — and What the Reference Numbers Mean
- Vitamin A: Food Sources, Deficiency, and Safe Limits
- Vitamin C: Food Sources, Scurvy, and the Ceiling the Body Sets
- Vitamin D: Food Sources, Sunlight, and What the Trials Found
- Riboflavin: Food Sources, Deficiency, and the Migraine Trials
- Thiamin: Food Sources, Beriberi, and Why There Is No Upper Limit
- Calcium: Food Sources, Bone Density, and What the Trials Found
Key takeaways · 10 min read
- There is no vitamin D1. D2 is ergocalciferol, from irradiated ergosterol in fungi and yeast; D3 is cholecalciferol, from irradiated 7-dehydrocholesterol in skin or in lanolin.
- The USDA splits the two forms and the split is absolute: every mushroom in the table is 100 per cent D2, every animal food 100 per cent D3.
- Per tablespoon, UV crimini mushroom (4.79 µg) beats cooked trout (2.85) — the best spoonful carries the weaker form.
- Two pooled analyses put D3 ahead by 15.23 and 15.69 nmol/L. Both report heterogeneity above 65 per cent, so that is an average over trials that disagree.
There is no vitamin D1. The name was used once, early, for a preparation that turned out not to be a single compound, and it was dropped. What exists is D2 and D3 — ergocalciferol and cholecalciferol — and they are not two vitamins but two molecules doing one job, from two different starting materials.
The unit on the label assumes they are interchangeable. An International Unit of vitamin D is the same quantity whichever molecule is in the capsule, which is a statement about equivalence dressed up as a measurement. The trials that tested it head to head disagree with the unit, and disagree with each other about how much.
This is the fourth vitamin entry in this appendix, and a companion to the main vitamin D page: what the two forms are, which foods carry which, what the comparisons found, and what to do about it.
Where each one comes from
Both are made the same way, by ultraviolet light hitting a sterol. The difference is which sterol.
D3 comes from 7-dehydrocholesterol. That is the compound sitting in your skin, which is why sunlight makes D3 and not D2, and it is also what supplement manufacturers irradiate — sourced industrially from cholesterol in sheep’s wool lanolin. D2 comes from ergosterol, which is what fungi and yeast use in their cell membranes instead of cholesterol. Irradiate a mushroom and you get D2. Irradiate a sheep and you would get D3.
After that the paths converge. The liver hydroxylates whichever arrives into 25-hydroxyvitamin D — 25(OH)D2 or 25(OH)D3 — and a blood test reports the sum of the two as total 25(OH)D. That summation is where the argument lives, because a test that adds them together cannot tell you whether they behave the same.
Which foods carry which form
The USDA records the two forms separately, and the split is absolute. Ranked by what fits on a level tablespoon:
Vitamin D per level tablespoon, by form
USDA SR Legacy, nutrients 325 (ergocalciferol) and 326 (cholecalciferol) per 100 g, converted at 15 g. Share is of the 15 µg adult RDA.
| Food (USDA FDC ID) | Form | Per 100 g | Per tablespoon | Share |
|---|---|---|---|---|
| Mushroom, crimini, exposed to UV, raw (168557) | D2 only | 31.9 µg | 4.79 µg | 32% |
| Mushroom, portabella, exposed to UV, raw (170143) | D2 only | 28.4 µg | 4.26 µg | 28% |
| Mushroom, maitake, raw (169403) | D2 only | 28.1 µg | 4.22 µg | 28% |
| Trout, rainbow, farmed, cooked (173718) | D3 only | 19.0 µg | 2.85 µg | 19% |
| Salmon, sockeye, cooked (173692) | D3 only | 16.7 µg | 2.51 µg | 17% |
| Egg yolk, raw (172184) | D3 only | 5.4 µg | 0.81 µg | 5% |
| Milk, whole, with added vitamin D (171265) | D3 only | 1.3 µg | 0.20 µg | 1% |
Source: USDA FoodData Central, SR Legacy. Tablespoon figures are conversions at 15 g. Cod liver oil (173577) carries 250 µg per 100 g but is recorded only as a combined total, with no form breakdown.
Read the second column down the page. Every mushroom is 100 per cent D2 with a recorded zero for D3. Every animal food is 100 per cent D3 with a recorded zero for D2. Nothing in the table carries both, and the maitake is on the list without ever having been near a lamp — it makes its own, because it is a fungus.
And the mushrooms win the spoon. Ultraviolet-treated crimini carries about 4.79 µg a tablespoon against 2.85 for cooked trout, which puts the best non-oil source of vitamin D per spoonful in the produce aisle carrying the form the trials are least kind to. That is the whole article in one table.
What the head-to-head trials found
Two systematic reviews have pooled the randomised comparisons, nine years apart, and they land almost on top of each other.
Pooled difference in serum 25(OH)D, D3 against D2
Weighted mean difference in nanomoles per litre. Both reviews report high heterogeneity between the studies pooled.
Sources: Tripkovic, L. et al., AJCN 95(6), 2012; Balachandar, R. et al., Nutrients 13(10), 2021, 3328.
Tripkovic’s 2012 review found ten randomised comparisons. Eight favoured cholecalciferol; two found the forms equally effective. Pooling seven of them gave a weighted mean difference of 15.23 nmol/L in favour of D3, at P = 0.001. Balachandar’s 2021 review screened twenty-four studies, pooled twenty-two of them across 1,277 participants — 644 on D3, 633 on D2 — and got 15.69 nmol/L, in the same direction.
Two independent teams, different decades, different inclusion criteria, the same answer to within half a nanomole. That is about as close to a settled finding as nutrition produces.
Except for the second number in each of those boxes. Tripkovic reports I² of 81 per cent; Balachandar, above 65. I² is the share of the variation between studies that is real disagreement rather than chance, and at those levels the pooled figure is an average across trials that do not agree with one another. It is a correct summary of a literature that contradicts itself.
The disagreement has a shape
It is not random. Both reviews found the same thing when they split the trials by how the dose was given.
Where the gap actually sits
Subgroup findings from the two pooled analyses.
Sources: Tripkovic, L. et al., AJCN 95(6), 2012; Balachandar, R. et al., Nutrients 13(10), 2021; Tripkovic, L. et al., AJCN 106(2), 2017.
The mechanism people propose for this is clearance: D3 appears to persist longer, so a single large dose has time to show the difference, while a small daily dose is topped up before the gap can open. Whether that is the explanation or not, the pattern is consistent across both reviews — and it matters, because almost nobody takes vitamin D as a monthly bolus. The dosing schedule where the two forms differ most is the one fewest people use.
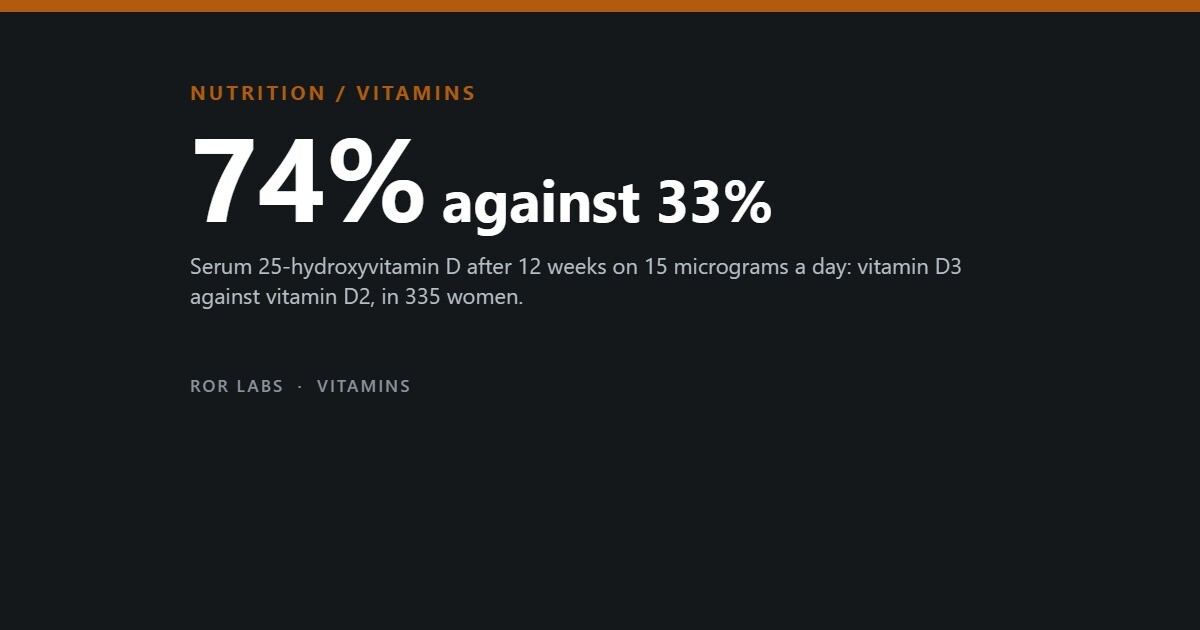
Then the exception. The D2–D3 Study is the largest randomised comparison of the two forms: 335 women aged 20 to 64 in Surrey, South Asian and white European, given placebo or 15 micrograms a day of D2 or D3 in either juice or a biscuit, over twelve winter weeks, with 25(OH)D measured by mass spectrometry. That is daily dosing at a low dose — exactly the condition where the pooled data says the gap should close. The authors’ own summary reports serum 25(OH)D rising 74 to 75 per cent on D3 and 33 to 34 per cent on D2.
The part that complicates it further
A 1986 study noticed something that has been quoted ever since. Nineteen healthy premenopausal women took 4,000 IU a day of D2 or D3 for eight weeks. In the D2 group, 25(OH)D2 rose as expected — and 25(OH)D3 fell by a corresponding amount, leaving total 25(OH)D unchanged. Taking vitamin D2 had, on that measure, achieved nothing at all.
That result was read for years as evidence that D2 actively displaces D3. A 2017 randomised trial with eight dosing arms across twenty weeks reached a more careful conclusion: the fall in 25(OH)D3 tracked the rise in total 25(OH)D rather than being specific to D2, and D3 treatment was associated with a reduction in 25(OH)D2 in the same way. In other words it looks like a regulatory response to having more vitamin D, whichever form delivered it.
That same trial is worth knowing for one more reason. Across twenty weeks it found D2 was most effective when given daily, and D3 most effective when given fortnightly. Not a result anyone predicted from “D3 is stronger”, and a reminder that the comparison is between two molecules and two schedules at once.
Seventy years of fortifying with the other one
The history explains why the question took so long to be asked. D2 was discovered first, from ultraviolet-irradiated ergosterol in yeast, and it was D2 that went into American milk in the 1930s — the intervention that essentially ended rickets in the United States. Ergosterol was cheap and easy to get, so D2 stayed the default for both fortification and pharmaceutical use until around 2004.
D3 became cheap later, once manufacturers worked out how to convert cholesterol from sheep’s wool lanolin into 7-dehydrocholesterol. The switch in the literature is usually dated to a 2004 trial giving twenty healthy men a single 50,000 IU dose of each: both forms were absorbed equally and produced a similar rise over the first three days, but 25(OH)D kept climbing on D3, peaking at day 14, while the D2 curve turned back down.
So the fortification programme that ended rickets ran for about seventy years on the form that later evidence puts second. It worked anyway — which is the honest footnote to all of this. At the amounts that prevent deficiency disease, both forms are vitamin D.
What to do with this
Read the label rather than the front of the box. Supplements state the form, and vitamin D3 or cholecalciferol is the one with the better evidence for raising blood levels, particularly if you take it weekly rather than daily. If a label says only “vitamin D” and never names the molecule, that is worth noticing.
What each name on a label means
The same nutrient under four headings.
Bar length is illustrative of the pooled direction of effect, not a potency ratio. No official conversion factor between the two forms exists.
Two situations change the answer. A high-dose prescription in the United States is usually 50,000 IU of ergocalciferol, because that is the form the high-dose product was built around; that is a decision for the prescriber, not the shelf. And if you avoid animal products, standard D3 from lanolin is not vegan, which is the one clear reason to choose D2 knowing what you are choosing.
Questions people ask
Is there a vitamin D1?
No. The name was applied early to a preparation that proved not to be a single compound, and it was withdrawn. Current reference sources list two forms in foods and supplements, D2 and D3, and nothing else.
Are D2 and D3 interchangeable, unit for unit?
The International Unit treats them as though they are, which is the assumption under test rather than the answer to it. Pooled across the randomised comparisons, D3 raises serum 25(OH)D about 15 nmol/L more than D2 — but with heterogeneity above 65 per cent, and with most of the gap sitting in bolus rather than daily dosing.
Do mushrooms count?
They carry real vitamin D, and ultraviolet-treated ones carry a lot of it — more per tablespoon than cooked trout. It is all D2, and the USDA records zero D3 in every one of them. Whether that matters depends on which of the numbers above you weight.
Which should I buy?
D3 is the better-supported choice for raising blood levels, and more so if you dose weekly rather than daily. The exceptions are a vegan diet and a prescribed high-dose product. Neither form is the reason most people are short of vitamin D — that is mostly about skin, not shelves.
The short version
- There is no vitamin D1. D2 is ergocalciferol, from irradiated ergosterol in fungi and yeast; D3 is cholecalciferol, from irradiated 7-dehydrocholesterol in skin or in lanolin.
- The USDA splits the two forms and the split is absolute: every mushroom in the table is 100 per cent D2, every animal food 100 per cent D3.
- Per tablespoon, UV crimini mushroom (4.79 µg) beats cooked trout (2.85) — the best spoonful carries the weaker form.
- Two pooled analyses put D3 ahead by 15.23 and 15.69 nmol/L. Both report heterogeneity above 65 per cent, so that is an average over trials that disagree.
- The gap is concentrated in bolus dosing. At daily fortification-level doses the 2021 review calls D3 “only marginally better” — but the largest daily-dose trial still found 74–75% against 33–34%.
- US milk was fortified with D2 from the 1930s to about 2004, and it ended rickets anyway.
This is a reference page, not clinical guidance. If a doctor has prescribed a particular form or dose of vitamin D, that decision was made with information this page does not have.
Further reading: Balachandar’s 2021 review is unusually frank about its own heterogeneity and about what the daily-dose subgroup does to the headline. Hammami and Yusuf’s eight-arm trial is the one that takes the dosing schedule seriously.
Sources
- NIH Office of Dietary Supplements, “Vitamin D”, fact sheet for health professionals. (Two forms only, D2 and D3; mushrooms provide variable amounts of D2; US milk usually fortified as D3; D3 raises and maintains 25(OH)D more than D2, though both are well absorbed.)
- USDA FoodData Central, SR Legacy, nutrients 325 (ergocalciferol) and 326 (cholecalciferol) per 100 g. (Crimini UV 168557, 31.9 µg all D2; portabella UV 170143, 28.4 all D2; maitake 169403, 28.1 all D2; trout cooked 173718, 19.0 all D3; sockeye cooked 173692, 16.7 all D3; egg yolk 172184, 5.4 all D3; whole milk with added D 171265, 1.3 all D3; cod liver oil 173577, a combined 250 µg only.)
- Tripkovic, L. et al., AJCN 95(6), 2012, pp.1357–1364. (Ten comparisons, eight favouring D3 and two finding them equal; seven pooled; weighted mean difference 15.23 nmol/L, 95% CI 6.12–24.34, P = 0.001; I² = 81%; bolus subgroup P = 0.0002.)
- Balachandar, R. et al., Nutrients 13(10), 2021, 3328. (24 studies screened, 22 pooled, 1,277 participants — 644 D3, 633 D2; mean difference 15.69 nmol/L, 95% CI 9.46–21.93; I² above 65%; daily dosing associated with lower differences, and at fortification-level doses D3 “only marginally better”.)
- Tripkovic, L. et al., AJCN 106(2), 2017 — the D2–D3 Study. (335 South Asian and white European women aged 20–64, Surrey; placebo or 15 µg/day of D2 or D3 in juice or biscuit, 12 winter weeks, 25(OH)D by LC–MS/MS.) The 74–75% against 33–34% figures are the authors’ own summary in Nutrition Bulletin 42(4), 2017.
- Hammami, M.M. and Yusuf, A., BMC Endocrine Disorders, 2017. (Eight arms over 20 weeks, AUC to day 140; D2 most effective given daily and D3 fortnightly; the D2-associated fall in 25(OH)D3 tracks the rise in total 25(OH)D rather than being D2-specific, and D3 may reduce 25(OH)D2 likewise.)
- Tjellesen, L. et al., 1986. (19 premenopausal women, 4,000 IU/day for 8 weeks; D2 raised 25(OH)D2 while 25(OH)D3 fell correspondingly, leaving total 25(OH)D unchanged.)
- Armas, L.A.G., Hollis, B.W. and Heaney, R.P., “Vitamin D2 is much less effective than vitamin D3 in humans”. (Single 50,000 IU doses, 20 healthy men, 28 days; equal absorption and a similar rise over three days, then 25(OH)D kept rising on D3, peaking at day 14.)
- Holick, M.F., “The D-sparaging of vitamin D2”, J Clin Endocrinol Metab, 2019. (D2 discovered first from UV-irradiated ergosterol in yeast, added to US milk in the 1930s and essentially eradicating rickets; the default for fortification and pharmaceuticals until about 2004; D3 made from 7-dehydrocholesterol derived from sheep’s wool lanolin.)
- Spiro, A. and Buttriss, J.L., Nutrition Bulletin 39(4), 2014. (The bolus-versus-daily split, alongside the earlier finding that 25 µg/day of D2 matched D3 over 11 weeks.)