Four Weeks of Deliberate Stagnation Grew No Legionella. The Precautionary Flush Afterwards Raised It for a Fortnight.
Key takeaways · 13 min read
- 22 of 24 studies in a systematic review found stagnation associated with Legionella — but 10 of the 17 building studies were about permanent dead legs and dead ends, not empty buildings.
- In the one building sampled through a seven-week shutdown, L. pneumophila fell by 1.37 to 4.14 logs.
- Four weeks of deliberately imposed total stagnation on two floors produced no culturable L. pneumophila at any of 26 outlets.
- The precautionary flush at reopening raised L. pneumophila by 0.55 to 3.4 logs in flushed samples, and it stayed up for two weeks.
When buildings emptied in 2020 the advice was immediate and near-universal: water left sitting in the pipes will grow Legionella, so flush every outlet before people come back. Facilities teams spent days running taps.
One research group was already sampling a building when it emptied, and kept sampling through the shutdown and the reopening. What they found was the reverse of the forecast twice over. Across seven weeks of lockdown, Legionella pneumophila fell — by between 1.4 and 4.1 orders of magnitude. Then the precautionary flush raised it, by up to 3.4 orders of magnitude, and it stayed up for two weeks.
This is not an argument that stagnation is harmless — the link is one of the better established findings in building water research. It is an argument that the link is about specific permanent features of plumbing, that “the building was empty” is a different claim, and that the standard remedy has a failure mode nobody was warning about.
What the stagnation evidence actually says
A systematic review published in 2020 screened 395 abstracts and found 24 studies examining the relationship between water stagnation and Legionella. Twenty-two of the 24 reported a positive association. Among the 17 studies of real building plumbing, 16 did.
But look at what those studies measured. Ten of the 17 building studies were about permanent stagnation points: dead ends and dead legs, pipe sections that go nowhere because a fitting was removed or a floor reconfigured and the pipe capped rather than cut back. These are not empty buildings. They are pieces of plumbing that are always stagnant, in buildings that are otherwise full.
The mechanism is well understood and has two halves. Water that is not moving loses heat, dropping into the range where Legionella grows best. And the disinfectant residual decays: one study measured chlorine falling from 0.2 to about 0.12 mg/L over 22 hours in a domestic storage tank, another from 0.6 to about 0.3 mg/L over 24 hours in cement-lined ductile pipe, and to 0.05 mg/L in a grey cast iron dead end.
What the stagnation literature examined
24 studies identified from 395 abstracts, on water stagnation and Legionella colonisation.
Source: Nisar, M.A., Ross, K., Brown, M.H., Bentham, R. and Whiley, H., “Water stagnation and flow obstruction reduces the quality of potable water and increases the risk of legionelloses”, Frontiers in Environmental Science 8:611611, 2020.
The building that was being measured when it emptied
The Eawag research building in Switzerland had been sampled through 2019, so there was a real baseline: median L. pneumophila below 10 MPN per litre. Then the building shut for seven weeks.
Contrary to expectation, median culture numbers fell by 1.37 to 4.14 logs. The authors offer a plausible reason: low demand plus daily recirculation of the hot water probably created nutrient-limiting conditions, and starved Legionella loses culturability within days to weeks.
The team then did what the field rarely does and imposed stagnation deliberately, shutting off two floors for up to four weeks and monitoring 26 outlets. No culturable L. pneumophila was found at any of them, before or after. Total cell counts rose after a week and stayed up, but the organism the guidance is about never appeared.
And yet the same building had spiked after a three-week winter break the previous year: positivity went from 44 to 91 per cent, median culture numbers up by more than 2.3 logs. After the equivalent break a year later, nothing — 0 per cent positive before, 8 per cent after, not significant.
The authors cannot fully explain the 2019 spike, and they flag something that cuts against the obvious reading: the floor with the most routine hot water use consistently had the highest Legionella, which they call a direct contradiction of the stagnation hypothesis. Their best guess for the spike is construction on an adjacent site, a disturbance known to raise Legionella.
Four low-demand periods in one building
| Period | What happened to L. pneumophila |
|---|---|
| Winter break 2019, three weeks | Rose by more than 2.3 logs; positivity 44% to 91% |
| COVID lockdown 2020, seven weeks | Fell by 1.37 to 4.14 logs |
| Winter break 2020, three weeks | No significant change; 0% positive before, 8% after |
| Imposed total stagnation, up to four weeks | None culturable at any of 26 outlets, before or after |
Source: Rhoads, W.J., Sindelar, M., Margot, C., Graf, N. and Hammes, F., “Variable Legionella response to building occupancy patterns and precautionary flushing”, Microorganisms 10(3):555, 2022.
Then they flushed
At reopening the building was recommissioned the recommended way: every outlet run until the water ran steadily hot, or for two minutes, whichever came first. It took a working day.
In first-draw samples, L. pneumophila did not fall. In flushed samples it rose, by 0.55 to 3.4 logs, and stayed elevated for two weeks. It began declining in the third week of reoccupancy and was back to pre-pandemic levels by the sixth.
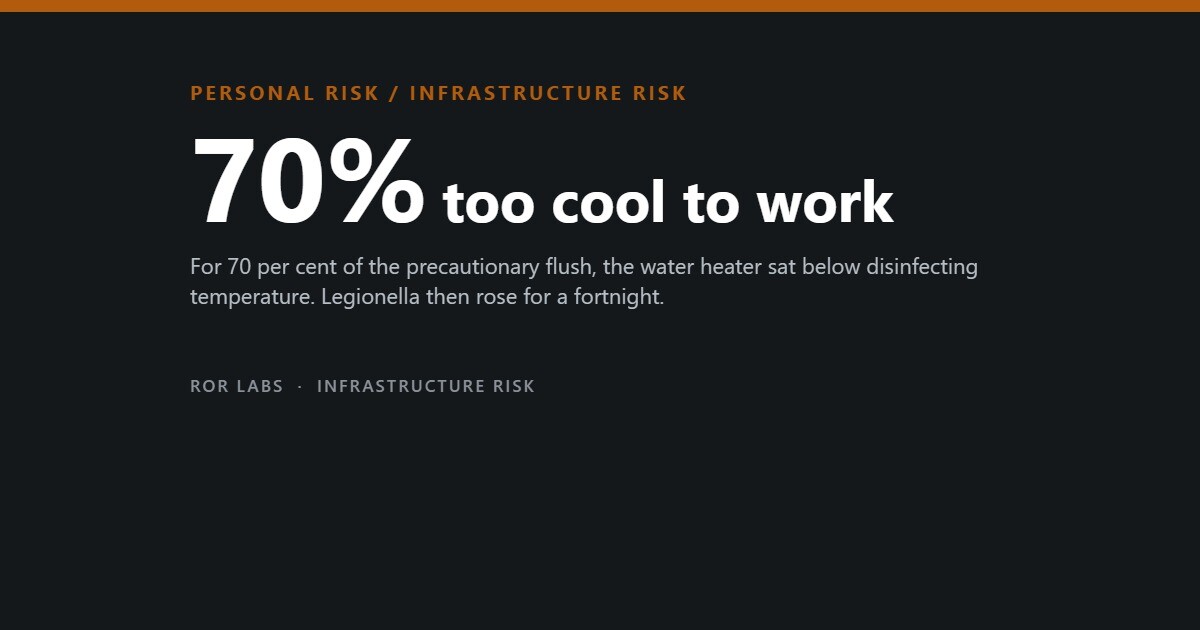
The mechanism the authors identify is unglamorous and specific. Flushing every outlet at once drew far more hot water than the building normally uses, and the water heater could not keep up. Its outlet was below 60 °C for 70 per cent of the flushing period. The bottom of the tank — where the sediment and the biofilm sit — was below 60 °C the entire time and below 55 °C for 42 per cent of it.
In other words, flushing consumed the thing doing the disinfecting. The stratified layer of very hot water at the top of the tank is a thermal barrier, and running every tap in the building drains it.
What the recommissioning flush did to the water heater
Share of the flushing period spent below disinfecting temperature.
Source: Rhoads et al., Microorganisms, 2022.
They then reproduced it deliberately. Flushing 200 per cent of the boiler volume at 5 litres per minute took L. pneumophila from below the detection limit to 1,970 MPN per litre during the flush. At 95 litres per minute nothing culturable appeared, because the tank started hot and the high flow pushed that hot water through more or less intact — but gene copy numbers still spiked by around two logs.
After both flushes, at both flow rates, L. pneumophila in flushed samples rose by 1 to 2.5 logs over the following two to three weeks. The authors list the likely contributors: rapid nutrient influx feeding new growth, high shear detaching established biofilm, and dispersal of material from the un-disinfected bottom of the tank.
What actually controls it
The disappointing part of this literature is how poorly chemical disinfection performs over the long run. A Pennsylvania hospital removed its dead legs and ran routine chlorination; neither was sufficient, and it took 21 months of chlorine dioxide to reach culture-negative. A century-old Italian hospital ran continuous hyperchlorination for five years without clearing the contamination. In another, the same strain persisted for fifteen years through thermal treatment, chlorination and chlorine dioxide.
Biofilm is why. In a pilot-scale system, Legionella biofilms in dead legs survived thermal shock and recolonised the water within 48 hours. Stagnant sections do not merely harbour the organism; they repopulate everything else after each treatment, and repeated sub-lethal exposure appears to select for more resistant strains.
What works is dull, continuous and structural. One review of plumbing models concluded the only reliable way to eradicate established biofilm was to hold the water above 55 °C at every point in the system, which requires continuous hot water circulation rather than periodic intervention.
The most interesting practical finding is Italian. Rather than ripping out dead legs, two hospital studies fitted timed taps at the outlet nearest each one, running 64 to 192 litres a day. In hot water systems carrying L. pneumophila at up to 1.4 × 10⁵ CFU per litre, culturable L. pneumophila was eliminated — in the second study within 24 hours to 15 days.
Note what that is: a small, permanent, continuous flow — nearly the opposite of one large flush.
Interventions, by how they performed
Sources: Nisar et al., Frontiers in Environmental Science, 2020, summarising Saby 2005, Totaro 2018 and 2020, Sidari 2004, Orsi 2014, Scaturro 2007 and Farhat 2010; Rhoads et al., Microorganisms, 2022.
Why the evidence points at cooling towers
Ask what causes Legionnaires’ disease and the answer is cooling towers, and the outbreak record supports it. Six New York City community outbreaks since 2006 produced 213 cases and 18 deaths; the largest, in the Bronx in 2015, infected 138 people and killed 16, and sequencing tied it to a single tower.
But outbreaks are the minority of cases. In one national year in England and Wales, 123 of 160 reported cases — 77 per cent — were sporadic, occurring singly with no cluster to investigate. Sporadic cases rarely get an environmental investigation, because there is nothing to link them to.
There is a second reason the source record is thin, and it is a side effect of getting better at diagnosis. Between 1980 and 1998 American diagnosis by urine antigen went from 0 to 69 per cent of cases, and case fatality fell from 34 to 12 per cent. The test is fast and it saves lives. It also produces no isolate — and without an isolate you cannot match a patient to a building. Over the same period, cases attributed to serogroups other than L. pneumophila serogroup 1 fell from 38 to 4 per cent, an artefact of the missing cultures rather than a change in the organism.
So the visible evidence concentrates on cases arriving in clusters large enough to investigate — the ones caused by devices that aerosolise water over a wide area. The building plumbing hypothesis is harder to see, not necessarily smaller.
Why the source of most cases is unknown
Sources: Newton, L. et al., Communicable Disease Report, 1996; Benin, A.L., Benson, R.F. and Besser, R.E., Clinical Infectious Diseases 35(9), 2002.
What the researchers themselves flag
The flushing study is one building. The authors say so, and they do not generalise from it. Their stated conclusions are hedged in a way the coverage of this topic usually is not: that reduced water demand does not always cause Legionella growth even in a building with a history of it, that low demand coincides with several other changes which have to be accounted for separately, and that some flushing practices have the potential to temporarily increase Legionella.
Their final recommendation is not about plumbing at all: that future work should define what it means by stagnation, and how that relates to everything else happening in the system at once. Temperature profile, nutrient supply, use at the individual outlet and outside disturbances all moved together in their building, and no one of them explains the results.
There is also a study on the other side, and it should be said plainly. A public building monitored through a long lockdown in the United States collected 192 samples and concluded that long-term stagnation did promote Legionella and free-living amoebae. Within the systematic review, one of the 17 building studies and one of the seven laboratory models found no positive association — and the laboratory one found the opposite, with more culturable Legionella in the biofilm of the turbulent-flow pipe than the stagnant one.
This is a field with a strong central finding and genuinely unresolved edges. What has changed is that “flush before reoccupancy” can no longer be stated as though it were free of risk, because in the one building where somebody measured it, it was not.
Questions people ask
Should I flush my taps after being away?
For a house, this evidence does not really apply. The findings are about a large building with a central water heater, a recirculating hot water loop and hundreds of outlets, and the failure mode was that flushing everything at once exhausted the heater. A domestic system has none of that architecture. What the study does argue is that a large simultaneous flush of a big building is not automatically safe, and that whoever runs one should be watching the heater temperature while it happens.
What temperature should hot water be?
The number that recurs across this literature is above 55 °C at every point in the system, maintained continuously. That is a building engineering specification rather than a household setting, and it collides with scald risk, which is why domestic guidance in most countries differs and why mixing valves at the outlet exist.
Is a shower head a real risk?
It is a real reservoir. In the 1984 hospital study that established much of this, L. pneumophila came from 50 to 100 per cent of sampled shower heads even while the tanks feeding them were clean, and from 22 of 30 tap aerators against none of 26 unobstructed taps. Whether that becomes disease risk for a healthy person at home is a question this literature does not answer.
Who actually gets ill?
Overwhelmingly people who are older, immunosuppressed, or have chronic lung disease, and the case fatality is not trivial: 6.6 per cent across nearly 12,000 European cases in one two-year period. In the Bronx outbreak, 107 of 138 patients had a chronic condition.
Does any of this mean stagnation is fine?
No. Twenty-two of 24 studies found a positive association, the mechanism is understood, and dead legs are a genuine and well-documented hazard. The finding here is narrower: emptying a building is not the same thing as a dead leg, and the standard remedy has a documented failure mode.
The short version
- 22 of 24 studies in a systematic review found stagnation associated with Legionella — but 10 of the 17 building studies were about permanent dead legs and dead ends, not empty buildings.
- In the one building sampled through a seven-week shutdown, L. pneumophila fell by 1.37 to 4.14 logs.
- Four weeks of deliberately imposed total stagnation on two floors produced no culturable L. pneumophila at any of 26 outlets.
- The precautionary flush at reopening raised L. pneumophila by 0.55 to 3.4 logs in flushed samples, and it stayed up for two weeks.
- The reason: flushing every outlet at once drained the water heater. Its outlet was below 60 °C for 70% of the flush and the tank bottom below 55 °C for 42%.
- Chemical disinfection performs poorly over years. One hospital ran continuous hyperchlorination for five years without clearing the contamination; in another, the same strain survived fifteen years of thermal, chlorine and chlorine dioxide treatment.
- What worked was continuous: above 55 °C everywhere, and timed taps running 64 to 192 litres a day near dead legs, which eliminated culturable L. pneumophila without removing the dead legs.
- Most Legionnaires’ cases are sporadic — 77% in one national year — and the shift to urine antigen testing removed the isolates that source tracing needs.
This article summarises published environmental and epidemiological research on Legionella in building water systems. It is not medical advice and it is not a substitute for a water safety plan, which in most jurisdictions is a legal requirement for larger buildings and a job for a qualified professional.
Further reading: the 2022 Microorganisms paper by Rhoads and colleagues is open access, unusually readable, and the only field-scale measurement of what precautionary flushing does. The 2020 Frontiers review is the best summary of the mainstream position it complicates.
- The Rules of Contagion, Adam Kucharski (2020). An epidemiologist’s general theory of contagion, including how outbreaks like this one get traced.
- The Age of Diagnosis, Suzanne O’Sullivan (2025). On overdiagnosis and medicalization.
- How to Read Numbers, Tom Chivers & David Chivers (2021). Common statistical traps explained through news examples.
Sources
- Rhoads, W.J., Sindelar, M., Margot, C., Graf, N. and Hammes, F., “Variable Legionella response to building occupancy patterns and precautionary flushing”, Microorganisms 10(3):555, 2022. (One Swiss building sampled through low-occupancy periods, with controlled stagnation and boiler flushing experiments. L. pneumophila fell 1.37–4.14 logs across the seven-week lockdown, rose over 2.3 logs after the 2019 winter break but not the 2020 one, and was undetectable at all 26 outlets through four weeks of imposed stagnation. Recommissioning flushing raised it 0.55–3.4 logs for two weeks, the boiler outlet sitting below 60 °C for 70% of the flush.)
- Nisar, M.A., Ross, K.E., Brown, M.H., Bentham, R. and Whiley, H., “Water stagnation and flow obstruction reduces the quality of potable water and increases the risk of legionelloses”, Frontiers in Environmental Science 8:611611, 2020. (24 of 395 abstracts included; 22 reported a positive association, including 16 of 17 building studies and 6 of 7 laboratory models, and 10 of the 17 concerned permanent stagnation points. Also covers disinfectant decay, biofilm recolonisation within 48 hours of thermal shock, the need for water above 55 °C throughout with continuous circulation, and the Italian timed-tap studies.)
- Ciesielski, C.A., Blaser, M.J. and Wang, W.L., “Role of stagnation and obstruction of water flow in isolation of Legionella pneumophila from hospital plumbing”, Applied and Environmental Microbiology 48(5), 1984. (Two of four hospital hot water tanks kept on line for a year dropped L. pneumophila quickly; the two left unused stayed colonised. The organism came from 50–100% of shower heads throughout, and 22 of 30 faucet aerators against none of 26 unobstructed faucets.)
- Li, X., Xu, J., Wu, J., Weir, M.H. and Xi, C., “Prevalence of Legionella in a public building water plumbing system during COVID-19 lockdown”, Environment and Health, 2023. (192 samples from a public building over a year of lockdown and reopening, by qPCR. Concludes that long-term stagnation promoted Legionella and free-living amoebae — the opposite of the Swiss finding.)
- Benin, A.L., Benson, R.F. and Besser, R.E., “Trends in legionnaires disease, 1980–1998: declining mortality and new patterns of diagnosis”, Clinical Infectious Diseases 35(9), 2002. (6,757 confirmed US cases. Urine antigen diagnosis rose 0% to 69%; case fatality fell 34% to 12%. Isolates other than serogroup 1 fell 38% to 4%, attributed to the decline in culture rather than a change in the organism, impairing outbreak investigation.)
- Newton, L., Joseph, C.A., Hutchinson, E., Harrison, T.G., Watson, J.M. and Bartlett, C.L.R., “Legionnaires’ disease surveillance: England and Wales, 1995”, Communicable Disease Report, 1996. (160 reported cases, 20 deaths; 123 — 77% — occurred sporadically. Culture-based diagnosis fell from 16% in 1994 to 9% in 1995.)
- Weiss, D., Boyd, C., Rakeman, J.L., Greene, S.K., Fitzhenry, R. and McProud, T., “A large community outbreak of Legionnaires’ disease associated with a cooling tower in New York City, 2015”, Public Health Reports 132(2), 2017. (138 cases, 16 deaths, median age 55; 107 had a chronic condition. Of 55 cooling towers tested, two carried an indistinguishable strain and sequencing implicated one.)
- Ricketts, K.D. and Joseph, C.A., “Legionnaires disease in Europe: 2005–2006”, Eurosurveillance 12(12), 2007. (11,980 cases from 35 countries, 377 deaths, case fatality 6.6%. Urinary antigen accounted for 76.0% of diagnoses; culture-based diagnosis fell to 8.9%.)