Why Most Stock Investors Lose Money: What the Evidence Actually Shows
In This Series: Personal Finance & Investing
- Options and Futures: Where Retail Money Actually Goes
- Two Retirees, the Same Returns, Only One Runs Out. The Difference Is the Order.
- Deposit Insurance Stops at $250,000. Since 2008, Uninsured Depositors Have Actually Lost Money in Six Per Cent of Failures.
- Courts Resolve More Than Seventy Per Cent of Debt Suits Without a Defence. Fewer Than One Defendant in Ten Has a Lawyer.
- Your Home Insurance Almost Certainly Does Not Cover Flooding
- The Median Forfeiture Is $1,678. A Lawyer to Contest It Costs About Twice That.
Key takeaways · 16 min read
- Only 42.6% of 25,967 US stocks beat one-month Treasury bills over their entire listed lives, 1926–2016. The most common single outcome was a loss of essentially 100%.
- Slightly more than 4% of listed companies account for the market’s entire $34.82 trillion of net wealth creation. Miss them and you get the other 96%.
- Across 66,465 US households, the most active fifth of traders trailed the market by about 6.5 percentage points a year. Their gross returns were normal — the gap was cost.
- In Taiwan’s full market record, fewer than 1% of day traders earned reliably positive returns net of fees. In Brazil, 97% of those who persisted past 300 days lost money.
In this article
- The market goes up. Most individual stocks do not.
- The more you trade, the more it costs you
- Day trading is the same arithmetic, run faster
- The professionals do not escape it either
- The gap between what the fund earned and what its investors earned
- Where the losses actually come from
- Questions people ask
- The short version
- Sources
There is a version of investment risk that gets discussed constantly — the market falls, your account is worth less, you wait, it recovers. That is volatility, and for a diversified holder it is mostly a patience problem. There is a second version that gets discussed far less, and it is the one that actually destroys capital: the outcome of any individual stock is nothing like the average, and the act of trading subtracts from whatever the average would have given you.
Both of those are measurable. They have been measured, repeatedly, on very large samples, in several countries, by people with access to the actual brokerage records rather than to survey answers. The numbers are not close calls.
This article sets out what that research found, including the parts that cut against the tidy version of the story. It is a description of published evidence, not advice about what you personally should hold. Nobody writing a public article can know your tax position, your time horizon, or what else you own.

The market goes up. Most individual stocks do not.
The single most useful study on this is Hendrik Bessembinder’s Do Stocks Outperform Treasury Bills?, published in the Journal of Financial Economics in 2018. He took every US common stock in the CRSP database from July 1926 to December 2016 — 25,967 of them — and calculated each one’s buy-and-hold return over its entire listed life, from first appearance to delisting, merger or the end of the sample.
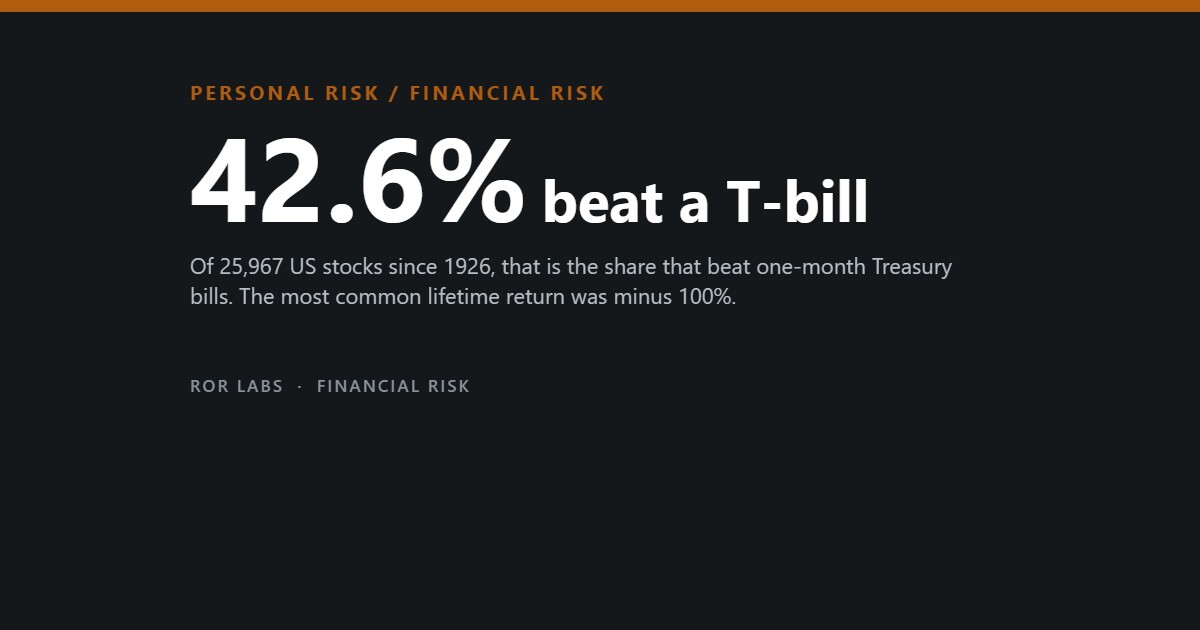
Only 42.6% of those stocks returned more, over their whole lifetime, than one-month Treasury bills. The single most frequent outcome, rounding to the nearest 5%, was a loss of essentially 100%: about 11.8% of the stocks ended at or near zero. And the entire $34.82 trillion of net wealth the US stock market created over ninety years is attributable to slightly more than 4% of the listed companies. The other 96%, collectively, matched Treasury bills.
Lifetime outcomes of 25,967 US common stocks, 1926–2016
Buy-and-hold return over each stock’s entire listed life, measured against one-month Treasury bills.
Source: Bessembinder, H., “Do stocks outperform Treasury bills?”, Journal of Financial Economics, 129(3), 2018.
This is what statisticians call positive skew, and it has a practical consequence that most people never have explained to them. The average stock return is pulled upward by a few extreme winners. The typical stock return sits well below it. When you own the whole market you capture the average. When you own eight names you are drawing eight tickets from a distribution whose most common single outcome is total loss.
That is the structural reason concentrated stock picking loses money. It is not a claim about anyone’s intelligence. It is arithmetic about the shape of the distribution.
The more you trade, the more it costs you

The second finding is about behaviour rather than structure. Brad Barber and Terrance Odean obtained the trading records of 66,465 households at a large US discount broker covering January 1991 to January 1997, and published the result in the Journal of Finance in 2000 under the title Trading Is Hazardous to Your Wealth.
The average household earned 16.4% a year net of costs while the market returned 17.9% — a shortfall of about 1.4 percentage points. The most active fifth, ranked by portfolio turnover, earned 11.4%. That is a shortfall of roughly 6.5 percentage points a year against a market anyone could have bought and left alone. The average household turned over more than 75% of its stock portfolio every year; the most active fifth turned over 21.5% of theirs every month.
Annual net return, US discount-brokerage households, 1991–1997
66,465 households. Shortfall measured against the market return over the same period.
Source: Barber, B.M. and Odean, T., “Trading Is Hazardous to Your Wealth: The Common Stock Investment Performance of Individual Investors”, Journal of Finance, 55(2), 2000.
That last point is the one worth sitting with. If the frequent traders had been picking systematically worse companies, the fix would be better research. They were not. Their gross returns were roughly the same as everyone else’s. The entire difference was the bill for the activity — commissions and the bid-ask spread, paid over and over.
Commissions in the US have since gone to zero for retail stock trades, and that genuinely removes one of the two costs Barber and Odean measured. It does not remove the spread, and it does not remove the second mechanism they identified: overconfident traders sold stocks that went on to do better than the ones they bought. Zero commissions also made trading easier, which is the opposite of a brake.
Day trading is the same arithmetic, run faster

If frequent trading costs a percentage point or six a year, the natural question is what happens at the limit. Two datasets answer it, and both are national in scope rather than samples of volunteers.
Barber, Lee, Liu and Odean studied the complete Taiwan Stock Exchange record from 1992 to 2006, a market where roughly 450,000 people a year engaged in day trading. Their conclusion, in the paper’s own words, is that less than 1% of the day-trading population is able to predictably and reliably earn positive abnormal returns net of fees — on the order of 4,000 people out of 450,000. The top 500 traders by past performance did earn a real edge, about 37.9 basis points a day net of costs. The bottom of the distribution lost 28.9 basis points a day net.
The second dataset is Brazilian, and it belongs as much to the companion article on options and futures as to this one, because it is a futures market. Chague, De-Losso and Giovannetti took every individual who started day trading Brazilian equity index futures between 2013 and 2015 and followed them. Of those who persisted for more than 300 trading days, 97% lost money. Only 1.1% earned more than the Brazilian minimum wage, and 0.5% earned more than the starting salary of a bank teller — and those few did so, in the authors’ phrase, with great risk.
What full-population day-trading records show
Two national datasets, two markets, fifteen years apart in methodology.
Sources: Barber, Lee, Liu and Odean, “The Cross-Section of Speculator Skill: Evidence from Day Trading”, Journal of Financial Markets, 2014. Chague, De-Losso and Giovannetti, “Day Trading for a Living?”, working paper, 2019.
There is a survivorship trap built into how this subject is normally discussed. The people visible on a trading forum, a YouTube channel or a brokerage leaderboard are, by construction, the ones still there. The 97% who stopped are not posting. Any impression formed by looking at who is currently talking is an impression of the surviving 3%.
The professionals do not escape it either
It would be convenient if the conclusion were simply “amateurs lose, so hire a professional”. The scorecard that S&P Dow Jones Indices has published twice a year since 2002 — SPIVA — does not support that either.
In the mid-year 2025 edition, measured to 30 June 2025, 85.98% of actively managed US large-cap equity funds had underperformed the S&P 500 over ten years, and 88.29% had underperformed it over fifteen. Widening to all actively managed domestic equity funds against the S&P Composite 1500, the ten-year figure was 90.31% and the fifteen-year figure 92.52%.
Share of active US equity funds underperforming their benchmark
SPIVA U.S. Scorecard, data to 30 June 2025.
Source: S&P Dow Jones Indices, SPIVA U.S. Scorecard Mid-Year 2025.

Here the honest thing to do is stop and report the counter-evidence, because in this case it is serious. In May 2026 three academics — Martijn Cremers of Notre Dame, Jon Fulkerson of Dayton and Timothy Riley of Arkansas — published a study rebuilding the comparison with three changes. They weighted funds by assets rather than counting each fund equally, so the calculation follows the dollars people actually had. They credited a fund for the period it existed instead of automatically marking a closed fund as an underperformer. And they compared active funds against real passive index funds, which you can buy, rather than against an index, which you cannot. On that basis, 55% of assets underperformed rather than SPIVA’s 92% — close to a coin flip. For fixed income the figure fell from 71% to 37%.
Neither number is disinterested. S&P Dow Jones Indices licenses the indices that passive funds track. The Cremers study was sponsored by the Investment Adviser Association’s Active Managers Council, which represents the managers being scored. What survives both sets of accounts is narrower than the headline but still useful: paying for active management has not been a reliable way to beat a low-cost index fund, and the odds are somewhere between even and heavily against, depending on choices in the arithmetic that reasonable people dispute.
The gap between what the fund earned and what its investors earned
There is one more layer, and it is the one that is genuinely about you rather than about the market or the manager. A fund reports a total return: what one dollar left alone from the start of the period would have become. Investors do not leave one dollar alone from the start. They add money after good years and take it out after bad ones. Weighting the return by how much money was actually present at each moment gives a different figure, usually a lower one.
Morningstar publishes that calculation annually as Mind the Gap. In the 2025 edition, covering the ten years to 31 December 2024, US mutual funds and ETFs produced an aggregate total return of 8.2% a year while the average dollar invested in them earned 7.0%. The gap is 1.2 percentage points a year, roughly 15% of the total return, given away to the timing of purchases and sales.
The gap is not evenly distributed, and the pattern is informative. Sector equity funds — narrow, exciting, easy to trade in and out of — had the widest gap at 1.5 percentage points. Allocation funds, which include target-date funds and do their own rebalancing, had the narrowest at 0.1 percentage points; their investors captured about 97% of the fund return. The less a fund invites you to make decisions, the more of its return you keep.
How much of the gap is really bad timing?
Two published estimates of the same phenomenon, using the same underlying fund data.
Sources: Morningstar, Mind the Gap 2025. Fulkerson, J.A., Jordan, B.D., Riley, T.B. and Yan, Q., “Bad Timing Does Not Cost Investors 15% of Their Funds’ Returns”, Financial Analysts Journal, 2026.
That correction matters enough to state plainly. Dollar-weighted returns have a known statistical property: a fund that grows in size will show a gap even if every single investor bought and held perfectly, purely because more money was present during later periods than earlier ones. Fulkerson, Jordan, Riley and Yan take that out and find the genuine cost of mistimed buying and selling is about 0.10 percentage points a year — one twelfth of the headline. Two of those authors are also on the SPIVA critique above, which is worth knowing when you read either.
So the behaviour-gap story is real but much smaller than it is usually sold as. The trading-cost story from Barber and Odean, measured directly on brokerage records rather than inferred from fund flows, is the sturdier of the two.
Where the losses actually come from
Concentration you did not choose
Buying an index fund is normally described as diversification, and relative to owning six stocks it is. But the S&P 500 is not equally weighted, and in May 2026 J.P. Morgan Asset Management put the top ten holdings at 40.8% of the index — against a dot-com peak of 26.6%. Those ten companies produce a little over a third of the index’s earnings while accounting for two-fifths of its value.
Weight of the ten largest holdings in the S&P 500
Share of total index market capitalisation.
Source: J.P. Morgan Asset Management, “How extreme is market concentration?”, May 2026.
The arithmetic of getting back to even
Losses and gains are not symmetric, and this is the single piece of arithmetic that changes how people think about drawdowns once they have seen it. A loss of a given size requires a larger gain to reverse, and the requirement grows faster than the loss.
Gain required to recover a loss
Simple arithmetic, no assumptions.
| Loss | Value left, per $100 | Gain needed to break even |
|---|---|---|
| −10% | $90 | +11.1% |
| −25% | $75 | +33.3% |
| −50% | $50 | +100% |
| −75% | $25 | +300% |
| −90% | $10 | +900% |
| −100% | $0 | impossible |
Arithmetic; no source required.
Where the information came from
The FINRA Investor Education Foundation published research in 2026 on investors who use social media for investment information, and the size of the age split is striking: 60% of investors aged 18 to 34 use social media this way against 9% of those 55 or older, and 61% of the younger group had made an investment decision based on a recommendation from a social media personality, against 6% of the older group.
Two findings from that work sit uncomfortably together. Social media users scored an average of 42% on an objective investment knowledge quiz while 63% rated their own investment knowledge as high. And 68% of social media users reported having lost money to fraud, against 29% of non-users. That last figure is self-reported and correlational — it does not establish that social media caused the fraud losses, and people who are more active in markets generally have more exposure to everything, including scams. It is still a large enough difference to be worth knowing before taking a stock idea from a video.
Questions people ask
Does this mean index funds are safe?
No, and nothing above says so. A broad index fund removes the risk that you picked the wrong companies. It does not remove the risk that the market falls. The S&P 500 lost roughly half its value between 2000 and 2002 and again between 2007 and 2009, and fell about 25% in 2022. What indexing changes is the shape of the risk: you take the market’s drawdowns instead of taking the market’s drawdowns plus the chance of holding one of the 11.8%.
Does holding for longer fix it?
For a diversified basket, a longer horizon has historically raised the probability of a positive outcome, though “historically” is doing real work in that sentence and the sample of independent long periods is small. For an individual stock, longer does not help in the same way. Bessembinder’s figures are lifetime returns — the entire listed life of each company, which is the longest horizon available. The 57.4% that failed to beat Treasury bills failed over their whole existence.
What about only buying high-quality, well-known companies?
The companies that ended at zero were not obscure at the time. They were listed, covered by analysts and held by institutions right up until they were not. Quality is judged in hindsight, and the list of what counted as a blue chip in 1999, 2007 or 2021 is not the list today. The recognisable names are exactly the ones a concentrated portfolio is most likely to contain, which is why Bessembinder’s distribution is not a story about penny stocks.
Is this different outside the United States?
The evidence points the same way in every market where somebody has been able to get the full records: Taiwan, Brazil, the Netherlands, India, the European Union. Costs, skew and overconfidence are not American phenomena. If anything the non-US retail studies are harsher, because leverage is more available.
So should I not invest at all?
That is not what any of this research concludes, and it is not what this article says. Holding cash has its own well-documented risk — inflation removes purchasing power quietly and without a statement showing a red number. The findings above are about the difference between owning a market and trying to beat it, and about the cost of activity. They are descriptive. What you do with them depends on facts about your own situation that no article can see.
The short version
- Only 42.6% of 25,967 US stocks beat one-month Treasury bills over their entire listed lives, 1926–2016. The most common single outcome was a loss of essentially 100%.
- Slightly more than 4% of listed companies account for the market’s entire $34.82 trillion of net wealth creation. Miss them and you get the other 96%.
- Across 66,465 US households, the most active fifth of traders trailed the market by about 6.5 percentage points a year. Their gross returns were normal — the gap was cost.
- In Taiwan’s full market record, fewer than 1% of day traders earned reliably positive returns net of fees. In Brazil, 97% of those who persisted past 300 days lost money.
- 86% of active US large-cap funds trailed the S&P 500 over ten years on SPIVA’s method. A 2026 critique using asset weighting and real index funds puts it at 55%. Both sponsors have a stake; the truth is somewhere in that range.
- The famous “investors lose 15% of their returns to bad timing” figure does not hold up. Corrected for a dollar-weighting artefact, the cost of mistimed buying and selling is about 0.10 percentage points a year.
- The top ten S&P 500 holdings are 40.8% of the index, above the dot-com peak of 26.6%. Owning three US funds may mean owning the same ten companies three times.
- A 50% loss needs a 100% gain to reverse. A 90% loss needs 900%. A 100% loss needs nothing that exists.
- 61% of investors aged 18–34 have acted on a social media personality’s recommendation. Social media users averaged 42% on an investment knowledge quiz while 63% rated their knowledge high.
This article describes published research on investment outcomes. It is general information, not investment advice, and nothing in it is a recommendation to buy, sell or hold any security, fund or asset class. It cannot account for your income, tax position, time horizon, existing holdings or obligations. Past results in any of the studies cited do not predict future results. Anyone making decisions about their own money should speak to a licensed adviser in their own jurisdiction.
Further reading: A Random Walk Down Wall Street — Burton G. Malkiel (W. W. Norton, 13th edition 2023). The book-length version of the evidence above, updated across five decades. Its limitation is that it is an argument as well as a survey — Malkiel has held the same position since 1973 and reads the evidence in its favour — and it is written around US markets and US tax rules. Find it on Amazon (paid link)
On the links above: some are affiliate links, marked (paid link). If you buy through one we may earn a commission at no additional cost to you. As an Amazon Associate I earn from qualifying purchases. We link to product searches rather than specific items so that recommendations do not break as models change, and we say plainly when we are choosing not to link something. Full policy: Affiliate Disclosure.
Sources
- Bessembinder, H., “Do stocks outperform Treasury bills?”, Journal of Financial Economics, 129(3), 2018, pp. 440–457. (25,967 CRSP common stocks, July 1926 to December 2016; 42.6% with lifetime buy-and-hold returns exceeding one-month Treasury bills; modal lifetime return a loss of essentially 100%, about 11.8% of stocks; $34.82 trillion of aggregate net wealth creation to December 2016; slightly more than 4% of firms accounting for all of it.)
- Barber, B.M. and Odean, T., “Trading Is Hazardous to Your Wealth: The Common Stock Investment Performance of Individual Investors”, Journal of Finance, 55(2), 2000, pp. 773–806. (66,465 households at a US discount broker, January 1991 to January 1997; average household net annual return 16.4% against a market return of 17.9%; most active quintile by turnover 11.4% net; average annual turnover above 75%; monthly turnover of 21.49% in the top quintile; gross returns similar across turnover groups.)
- Barber, B.M., Lee, Y.-T., Liu, Y.-J. and Odean, T., “The Cross-Section of Speculator Skill: Evidence from Day Trading”, Journal of Financial Markets, 2014. (Complete Taiwan Stock Exchange records 1992–2006; about 450,000 individuals day trading annually; fewer than 1% able to predictably and reliably earn positive abnormal returns net of fees; top 500 traders 61.3 bps gross and 37.9 bps net daily, bottom performers 11.5 bps gross and −28.9 bps net.)
- Chague, F., De-Losso, R. and Giovannetti, B., “Day Trading for a Living?”, working paper, 2019 (SSRN 3423101). (All individuals beginning day trading in Brazilian equity index futures 2013–2015; 97% of those persisting beyond 300 days lost money; 1.1% earned more than the Brazilian minimum wage; 0.5% earned more than a bank teller’s starting salary.)
- S&P Dow Jones Indices, SPIVA U.S. Scorecard Mid-Year 2025, data to 30 June 2025. (All large-cap funds underperforming the S&P 500: 72.61% over one year, 85.98% over ten years, 88.29% over fifteen. All domestic funds against the S&P Composite 1500: 74.87% over one year, 90.31% over ten, 92.52% over fifteen. 54% underperformance in the first half of 2025 against 65% for full-year 2024.)
- Cremers, K.J.M., Fulkerson, J.A. and Riley, T.B., study sponsored by the Investment Adviser Association Active Managers Council, published May 2026. (Rebuilds the active-versus-passive comparison using asset weighting, credit for the period a fund existed rather than automatic underperformance on closure, and comparison against actual passive mutual funds; 55% of assets underperforming against SPIVA’s 92%, and 37% against 71% for fixed income.)
- Morningstar, Mind the Gap 2025, August 2025. (Ten years to 31 December 2024; aggregate fund total return 8.2% a year against an investor return of 7.0%, a gap of 1.2 percentage points or about 15% of total return; sector equity gap 1.5 percentage points, allocation funds 0.1 percentage points with roughly 97% of the fund return captured.)
- Fulkerson, J.A., Jordan, B.D., Riley, T.B. and Yan, Q., “Bad Timing Does Not Cost Investors 15% of Their Funds’ Returns: An Examination of Morningstar’s ‘Mind the Gap’ Study”, Financial Analysts Journal, 2026. (Estimates the cost of poor timing at approximately 0.10% a year, about one twelfth of the Morningstar figure, attributing the remainder to properties of the dollar-weighted return calculation.)
- J.P. Morgan Asset Management, “How extreme is market concentration?”, On the Minds of Investors, 20 May 2026. (Top ten S&P 500 holdings at 40.8% of index weight against a 26.6% technology-bubble peak; those holdings producing just over one third of index earnings.)
- FINRA Investor Education Foundation, research on the characteristics, behaviours and outcomes of retail investors who use social media, 2026. (60% of investors aged 18–34 using social media for investing information against 9% of those 55 or older; 61% against 6% having acted on a social media personality’s recommendation; social media users averaging 42% correct on an objective investment knowledge quiz while 63% rated their own knowledge high; 68% of social media users and 29% of non-users reporting money lost to fraud.)