Leveraged ETFs: What the Evidence Shows
Key takeaways · 12 min read
- A leveraged ETF promises a multiple of one day’s return, not of any longer period. Over months the result can differ sharply, even in direction.
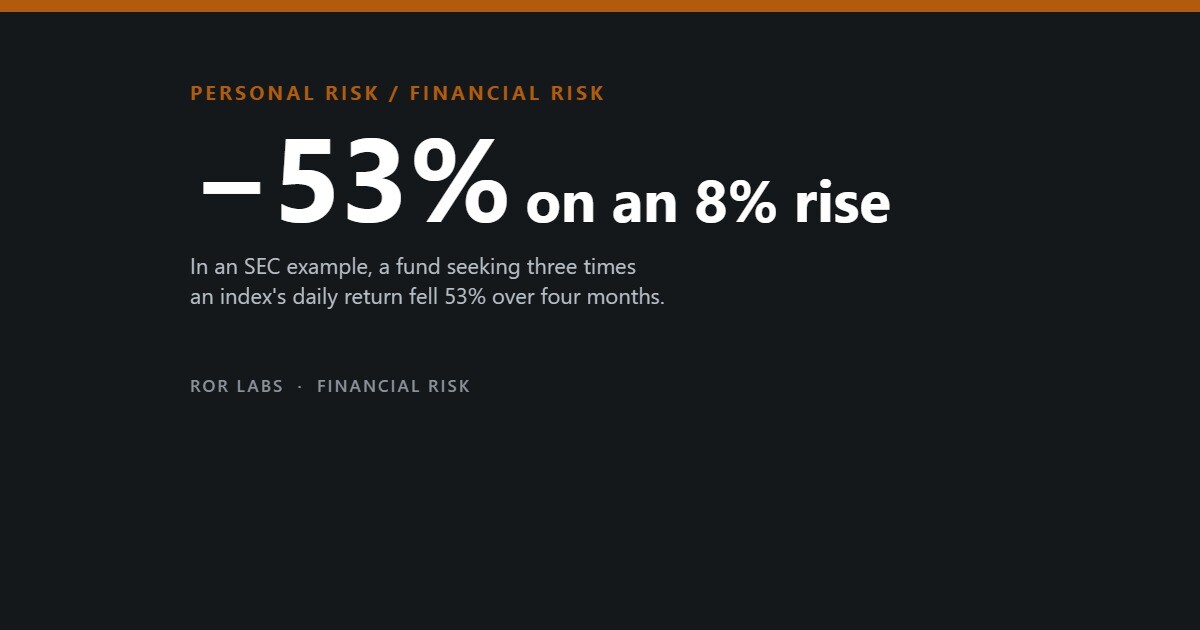
- In a US regulator’s example, an index rose 8% over four months while a fund seeking three times its daily return fell 53%.
- Choppy markets erode leveraged funds; steady trends can flatter them. If an index ends a volatile year flat, a 3x fund is expected to end well below where it started.
- Studies of real investors find large aggregate costs and poor timing: Korean individuals lost ₩662 billion in one domestic leveraged ETF through 2020.
Over four months, an index gained about 8%. An exchange-traded fund designed to deliver three times that index’s daily return fell 53% over the same four months. The example is not a hypothetical from a sceptic; it comes from the US Securities and Exchange Commission’s own bulletin for investors, which the regulator updated in August 2023.
The fund did what it said. It promised three times the index’s return each day, and it delivered roughly that each day. What it never promised was three times the return over four months, and the difference between those two promises is where most of the money in leveraged ETFs is won and lost.
The products have become a mass-market habit. In October 2025, 12 of the 19 US-listed ETFs most bought by Korean retail investors offered leveraged or inverse exposure. This article explains why leveraged funds drift from their stated multiple, what studies of real investors have found, the honest case in their favour, and what regulators in the United States and Korea did next.

What a leveraged ETF promises
A leveraged ETF uses swaps, futures or other derivatives to give two or three times the daily return of an index or a single stock. An inverse fund aims for the opposite of the daily return, sometimes doubled or tripled. To keep the multiple fixed, the fund must rebalance every day: after a rise it buys more exposure, and after a fall it sells. That daily reset is the whole product.
The regulator’s simplest illustration uses two days. An index falls 10% and then rises 10%, ending 1% lower. A fund seeking twice the daily return falls 20% and then rises 20%, ending 4% lower. At three times the loss is 9%. Nothing went wrong: each day was delivered as promised, and the compounding of those days produced a loss well beyond the multiple.
Two days, three funds
An index falls 10% one day and rises 10% the next. Each fund delivers exactly its daily multiple.
Source: SEC Investor Bulletin, Leveraged and Inverse ETFs (updated 29 August 2023), for the index and 2x figures; the 3x and inverse figures are calculated the same way.
Why the long run drifts from the multiple
The mechanism has been described in the academic literature since the products became popular in 2008 and 2009. Minder Cheng and Ananth Madhavan showed in 2009 that the return of a leveraged ETF over any period longer than a day depends on the path the index takes, not only on where it ends, and that this path dependence can destroy value for a buy-and-hold investor. Their analysis also noted a side effect for markets: because every leveraged fund rebalances in the same direction near the close, the funds add to late-day volatility.
The index rose; the funds fell
Two real four-month periods from the SEC’s investor bulletin. Index return against the return of a fund seeking a multiple of its daily return.
Index over four months: +2%
Fund seeking 2x the daily return: −6%
Direction reversed, not just magnified
A different index over the same period: about +8%
Fund seeking 3x the daily return: −53%
Each day delivered roughly as promised
Source: US Securities and Exchange Commission, Investor Bulletin: Leveraged and Inverse ETFs (updated 29 August 2023).
The driving force is volatility. When an index swings up and down without going anywhere, each reset locks in a little loss, and the loss grows roughly with the square of the leverage. A standard approximation captures the scale. If an index ends a year exactly where it started, with typical annual volatility of 15%, a 2x fund would be expected to end about 2% lower and a 3x fund about 7% lower, before any fees. At 30% volatility, the figures become about 9% and 24%. At 60%, a level common for single stocks, they are about 30% and 66%.
What a flat year costs a leveraged fund
Expected change in a daily-reset fund when the index ends the year where it started, by the index’s annual volatility. Before fees and financing costs.
Calculated with the standard continuous-time approximation, exp(−(L²−L)σ²/2) − 1. Modelling, not a forecast; real results also depend on trends, fees and financing.
Real funds lose more than the formula, because leverage is not free. A study of US leveraged funds found returns dragged by the cost of financing the leverage and of trading every day, and a 2025 analysis of 114 US equity leveraged and inverse ETFs from 2006 to 2023 found them expensive, high-turnover and with negative risk-adjusted returns. More leverage does not always mean more return even when an investor is right about the direction: one study showed that under average conditions a proposed 4x fund would match a 3x fund within 21 trading days and only a 2x fund within a year.
There is a hard floor, too. A fund that delivers three times the daily move would be wiped out by a one-day fall of one third in its underlying; a 2x fund by a fall of half. US market-wide circuit breakers make such a day unlikely for a broad index, but single stocks fall that far more often.
What investors actually earn
Who buys these funds, and how do they do? The evidence on actual investors is thinner than the mathematics, but it points one way. Using order-flow data from 2010 to 2021, one study found that retail traders put 12% more of their ETF dollar volume into leveraged and inverse funds than other traders did, and that their ETF buying rose with past returns. An analysis of the US market estimated that leveraged ETF investors pay costs of around 10% of the funds’ market capitalisation each year, about $2 billion, through spreads and price impact, and that their flows ran against past returns, a pattern consistent with short-term bets on reversals.
Holding periods are the crux. A 2010 study estimated that a substantial share of investors keep leveraged funds for longer than one or two days, some for longer than a quarter, and calculated that compared with simply borrowing on margin to get the same exposure, investors could lose 3% of their money in less than three weeks — an annualised cost of about 50%.
The most direct evidence on individuals comes from Korea. Applying a standard method for measuring traders’ gains and losses to 33 leveraged ETFs listed in Seoul, a 2021 study found that individual investors had lost a cumulative ₩662 billion in the most traded leveraged fund and ₩179 billion in the second, with most of the losses in 2020. The author found that individuals were not bad at picking prices — they tended to buy and sell at favourable levels within the day — but they traded small amounts on days when their view proved right and large amounts on days when it proved wrong.
What studies of leveraged ETFs and their investors found
Selected findings. Each uses different data and methods.
| Study | Data | Finding |
|---|---|---|
| Guedj, Li and McCann, 2010 | US leveraged and inverse ETFs | Many holders keep them beyond a day; up to 3% lost in under 3 weeks versus a margin account |
| Jiang and Yan, 2016 | US levered ETF trading | Investor costs around 10% of market cap a year, about $2 billion |
| Chung, 2021 | 33 Korean leveraged ETFs to 2020 | Individuals lost ₩662bn and ₩179bn in the two largest funds |
| Gempesaw, Henry and Han, 2023 | US retail order flow, 2010–2021 | Retail favours leveraged funds; performance similar to non-retail up to a quarter |
| Kanuri and Malm, 2025 | 114 US equity funds, 2006–2023 | High cost and turnover; negative risk-adjusted alpha |
Sources: as listed under each study’s authors below.
The case for leveraged funds
The volatility-drag story is true but incomplete, and an honest account has to include the other half. A 2025 paper by Chung-Han Hsieh and colleagues showed that what matters is not volatility alone but how returns follow one another. When days tend to follow days in the same direction, daily resets compound the trend and a leveraged fund can beat its multiple; when markets swing back and forth, it falls short. Using about 20 years of data on the S&P 500 and Nasdaq-100, they found both regimes in practice.
That is how leveraged funds came to dominate lists of the best-performing ETFs. A 2025 preprint by William Trainor noted that eight of the ten best-performing funds over the previous decade were leveraged ETFs, and argued that standard formulas understate their expected returns in strong bull markets; it has not yet been peer-reviewed. The other side of the same arithmetic is that such funds fall much further than their index when a trend reverses, and an investor who buys near a peak may wait a long time to recover.
There are also legitimate uses. Leveraged and inverse funds can hedge a portfolio for a day or two without a margin account or a derivatives licence, and some professional strategies combine them deliberately. The retail-flow study above found no evidence that retail traders did worse than other traders over holding periods up to a quarter. The evidence is not that leveraged ETFs are always losers; it is that their outcome depends on a path no one can see in advance, at a cost that is certain.
Single stocks and the push past 2x
Single-stock leveraged ETFs arrived in the United States in 2022, applying the same daily reset to one company’s shares. The SEC’s 2023 bulletin warned that they carry an additional layer of risk, and the arithmetic explains why: single stocks are usually far more volatile than a broad index, and the drag grows with the square of volatility as well as roughly with the square of leverage.
Issuers kept pushing. In 2025 several filed for funds offering three to five times the daily return of single stocks, indexes and cryptocurrencies. On 3 December 2025 the SEC sent nearly identical letters to nine issuers, telling them to revise or withdraw. Under Rule 18f-4, adopted in 2020, a fund’s value-at-risk may not exceed 200% of that of its reference portfolio, and the SEC took the view that for a fund tracking one stock or one asset, that asset is the reference — which caps leverage at two times.
Korean investors and the new rules

Korean investors became the most visible buyers of US leveraged funds. Korea Securities Depository data compiled by ETFGI showed record overseas ETF purchases of $15.85 billion in October 2025, with a triple-leveraged semiconductor fund alone taking $1.95 billion and a double-leveraged single-stock fund $1.57 billion.
Regulators responded. From 15 December 2025, Korean investors had to complete at least an hour of online education on overseas derivatives and a mock-trading course before buying leveraged products listed abroad. When single-stock leveraged products came to the domestic market in 2026, the Financial Services Commission went further: from 19 August, investors must complete at least five hours of mock trading over at least five trading days, and the regulator said it planned a cap on how much of an investor’s funds could go into such products, citing 20% as an example.
Rules on leveraged ETFs since 2009
Main regulatory steps in the United States and Korea.
| When | Who | What |
|---|---|---|
| 2009 | FINRA and SEC | Investor alert: leveraged and inverse ETFs typically unsuitable for buy-and-hold investors |
| 2020 | SEC | Rule 18f-4 limits fund leverage using value-at-risk |
| August 2023 | SEC | Updated investor bulletin, with a warning on single-stock funds |
| 3 December 2025 | SEC | Letters to nine issuers proposing 3x to 5x funds: revise or withdraw |
| 15 December 2025 | Korea FSS and KOFIA | Education and mock trading required for overseas leveraged products |
| 19 August 2026 | Korea FSC | Five hours of mock trading for single-stock leveraged products; investment cap planned |
Sources: SEC Investor Bulletin (2023); etf.com (December 2025); Structured Retail Products (2025); Seoul Economic Daily (12 August 2026).
Mock trading and education are not tested interventions, and no study has yet shown whether they change outcomes. What they do achieve is to make the daily-reset mechanism hard to miss before the first trade.
What the evidence suggests asking
The research suggests questions rather than a verdict. How long will the position be held — a day, or until the thesis is proven? How volatile is what the fund tracks, and what happens to a 3x position if that volatility doubles? What would a fall of a third in a single day do? How much of the expected gain is consumed by fees and financing? And would the same exposure be cheaper and more transparent another way, such as a smaller position without leverage?
Investors who can answer those questions in advance are using the product as it was designed. Those who cannot are, in the words of the regulators’ bulletin, holding a specialised product that is generally not suitable for buy-and-hold investors.
Questions people ask
Can you hold a leveraged ETF for the long term?
You can, but the result over months or years can differ greatly from the stated multiple of the index’s return, in either direction. US regulators describe these funds as generally unsuitable for buy-and-hold investors.
Why did my leveraged ETF fall when the index went up?
Because the fund resets its leverage every day. In a choppy market, daily compounding can produce a loss even if the index ends higher, as in the SEC’s example of a 2% index gain and a 6% fall in a 2x fund.
Are leveraged ETFs expensive?
Yes, relative to ordinary index funds. Fees, financing and daily trading costs add up, and a study of 114 US funds found negative risk-adjusted returns.
What happens to a 3x fund if the index falls a third in a day?
In principle it would lose almost everything. Circuit breakers make such a day unlikely for a broad US index, but single stocks can fall that far.
Are inverse ETFs a good hedge?
Over a day or two they can offset a fall. Over longer periods they suffer the same path dependence, so a hedge held for months may not track the loss it was meant to cover.
The short version
- A leveraged ETF promises a multiple of one day’s return, not of any longer period. Over months the result can differ sharply, even in direction.
- In a US regulator’s example, an index rose 8% over four months while a fund seeking three times its daily return fell 53%.
- Choppy markets erode leveraged funds; steady trends can flatter them. If an index ends a volatile year flat, a 3x fund is expected to end well below where it started.
- Studies of real investors find large aggregate costs and poor timing: Korean individuals lost ₩662 billion in one domestic leveraged ETF through 2020.
- US regulators stopped reviewing 3x to 5x proposals in December 2025, and Korea now requires education and mock trading before buying these products.
This article summarises published research and regulatory documents for general information. It is not financial advice and does not recommend any product. Leveraged and inverse products can lose money quickly; if you are considering them, read the fund’s prospectus and speak to a qualified, independent adviser.
Further reading: Cheng and Madhavan, ‘The Dynamics of Leveraged and Inverse Exchange-Traded Funds’ (2009), for the mechanism. Hsieh, Chang and Chen, ‘Compounding Effects in Leveraged ETFs: Beyond the Volatility Drag Paradigm’ (2025), for the case that trends can help. The SEC’s updated investor bulletin (2023) for the plain-language version.
- Trillions, Robin Wigglesworth (2021). The history of index funds and ETFs, and how a simple idea became a market force. Useful background on what ordinary ETFs were designed to do; leveraged funds are a side story.
- Chaos Kings, Scott Patterson (2023). Investors who bet on rare, extreme events. A vivid account of tail risk, the part of the distribution that daily-reset funds are most exposed to; it is journalism, not a manual.
- Richer, Wiser, Happier, William Green (2021). Interviews with long-term investors about patience, cost and temperament. The opposite philosophy to short-term leverage, argued from experience rather than data.
Sources
US Securities and Exchange Commission, Investor Bulletin: Leveraged and Inverse ETFs, updated 29 August 2023. — FINRA Regulatory Notice 09-31 (2009). — Cheng M, Madhavan A. The dynamics of leveraged and inverse exchange-traded funds (2009). — Carver AB. Do leveraged and inverse ETFs converge to zero? (2009), doi:10.3905/ETF.2009.2009.1.144. — Trainor WJ. Leveraged exchange-traded funds: when four is not more (2017). — Henderson BJ, Buetow GW. The performance of leveraged and inverse leveraged ETFs (2014). — Guedj I, Li G, McCann C. Journal of Index Investing 1(3) (2010). — Jiang W, Yan H. Financial innovation, investor behavior, and arbitrage: implications from the ETF market (2016). — Chung JM. Leverage ETF market timing abilities of individual investors. Financial Planning Review 14(4) (2021), doi:10.36029/fpr.2021.11.14.4.1. — Gempesaw D, Henry JJ, Han X. Retail ETF investing. European Financial Management (2023), doi:10.1111/eufm.12471. — Kanuri S, Malm J. Journal of Beta Investment Strategies (2025), doi:10.3905/jbis.2025.1.084. — Hsieh CH, Chang JR, Chen HH. arXiv:2504.20116 (2025). — Trainor WJ. Beyond volatility decay, preprint (2025). — etf.com, ‘SEC says no to 5x ETFs’, 3 December 2025. — ETFGI press release, 19 November 2025, citing Korea Securities Depository data. — Structured Retail Products, Korean regulators introduce tougher rules for leveraged ETF investors (2025). — Seoul Economic Daily, 12 August 2026.