Thiamin: Food Sources, Beriberi, and Why There Is No Upper Limit
In This Series: Nutrients
- Which Nutrients Are You Actually Short Of?
- How Nutrients Are Classified — and What the Reference Numbers Mean
- Vitamin A: Food Sources, Deficiency, and Safe Limits
- Vitamin C: Food Sources, Scurvy, and the Ceiling the Body Sets
- Vitamin D: Food Sources, Sunlight, and What the Trials Found
- Vitamin D2 vs D3: What the Head-to-Head Trials Found
- Riboflavin: Food Sources, Deficiency, and the Migraine Trials
- Calcium: Food Sources, Bone Density, and What the Trials Found
Key takeaways · 10 min read
- Thiamin diphosphate is a cofactor for five enzymes in energy metabolism. The body holds about 25 to 30 mg in total.
- Per tablespoon: yeast extract 3.51 mg, rice bran 0.41, wheat germ 0.28. Milling removes what sits at the top of the list.
- Beriberi became a public health problem in the nineteenth century as steam-powered rice mills spread, and the vitamin was found in the discarded polishings.
- Enrichment closed the gap: enriched white rice 0.163 mg per 100 g against brown at 0.178. About half of US dietary thiamin now comes from fortified foods.
Beriberi is the one deficiency disease with a clear industrial cause. It had been described sporadically for centuries, and in the nineteenth century it became a public health emergency across East and Southeast Asia, closely following the spread of the steam-powered rice mill.
The mill stripped the bran and germ off the grain, which made white rice cheap, storable and popular. Thiamin lives in the part that was stripped. The vitamin was eventually found in the discarded polishings, and its first name, aneurine, meant the anti-neuritic factor.
This is the fourth entry in this appendix. It covers what the nutrient does, which foods carry it per measured spoonful, what running short does, and what the reference numbers are. Thiamin is the one where the food table and the history say the same thing.
What it does
An adult body holds roughly 25 to 30 milligrams of thiamin, and about 80 per cent of it is present as thiamin diphosphate, the metabolically active form, also called thiamin pyrophosphate. That coenzyme is an essential cofactor for five enzymes in glucose, amino acid and lipid metabolism.
Thiamin is how cells get energy out of carbohydrate, so the tissues that complain first are those with the highest and least interruptible energy demand: nerve and heart muscle. It also explains why the body holds so little. Twenty-five to thirty milligrams is a working supply and no reserve, with no fat-soluble store to draw down, so symptoms appear within weeks of the supply stopping, where vitamin A or D allow months or years.
The three foods that carry the most per spoonful
Ranked by what fits on a level tablespoon, using USDA composition values, the list reads like an inventory of milling waste.
Thiamin per level tablespoon
USDA SR Legacy values per 100 g, converted at 15 g. Share is of the 1.2 mg adult male RDA.
| Food (USDA FDC ID) | Per 100 g | Per tablespoon | Share of RDA |
|---|---|---|---|
| Yeast extract spread (167717) | 23.4 mg | 3.51 mg | 292% |
| Rice bran, crude (169713) | 2.75 mg | 0.41 mg | 34% |
| Wheat germ, crude (168892) | 1.88 mg | 0.28 mg | 24% |
| Sunflower seed kernels, dried (170562) | 1.48 mg | 0.22 mg | 19% |
| Wheat bran, crude (169722) | 0.523 mg | 0.078 mg | 7% |
| Pork loin chop, boneless (168251) | 0.693 mg | 0.104 mg | 9% |
| Black beans, boiled (173735) | 0.244 mg | 0.037 mg | 3% |
Source: USDA FoodData Central, SR Legacy. Tablespoon figures are conversions at 15 g.
Rice bran and wheat germ are second and third, and neither is a food in the ordinary sense, since both are fractions that milling removes. The first entry is a yeast spread that most of the world does not eat, and after that the list drops to ordinary portions of pork and beans, which do the actual work by volume.
The spoon points straight at the history: the nutrient sits in the part of the grain that industrial processing was designed to take off.
Where it actually comes from now
Per plate the picture is entirely different, and entirely modern. The most common sources of thiamin in the US diet are cereals and bread, with pork the other major contributor. About half of it comes from foods that contain thiamin naturally, and the other half from foods it was added to.
Thiamin per serving, as people actually eat it
NIH Office of Dietary Supplements, milligrams per stated serving. Full bar = 1.2 mg, the adult male RDA.
Source: NIH Office of Dietary Supplements, selected food sources of thiamin.
The single largest entry on that list is a fortification decision, taken once at industrial scale, that now supplies a day’s requirement in one bowl. Nothing else comes close, and the slice of wholemeal bread, the option that sounds most like the unprocessed answer, is at the bottom.
The disease the mill made
Beriberi has been recognised sporadically for something like 1,300 years. It became a major public health problem in the Far East in the nineteenth century, with the introduction of the steam-powered rice mill and the wider consumption of highly milled rice that followed. The protective factor was found afterwards in the polishings that had been thrown away.
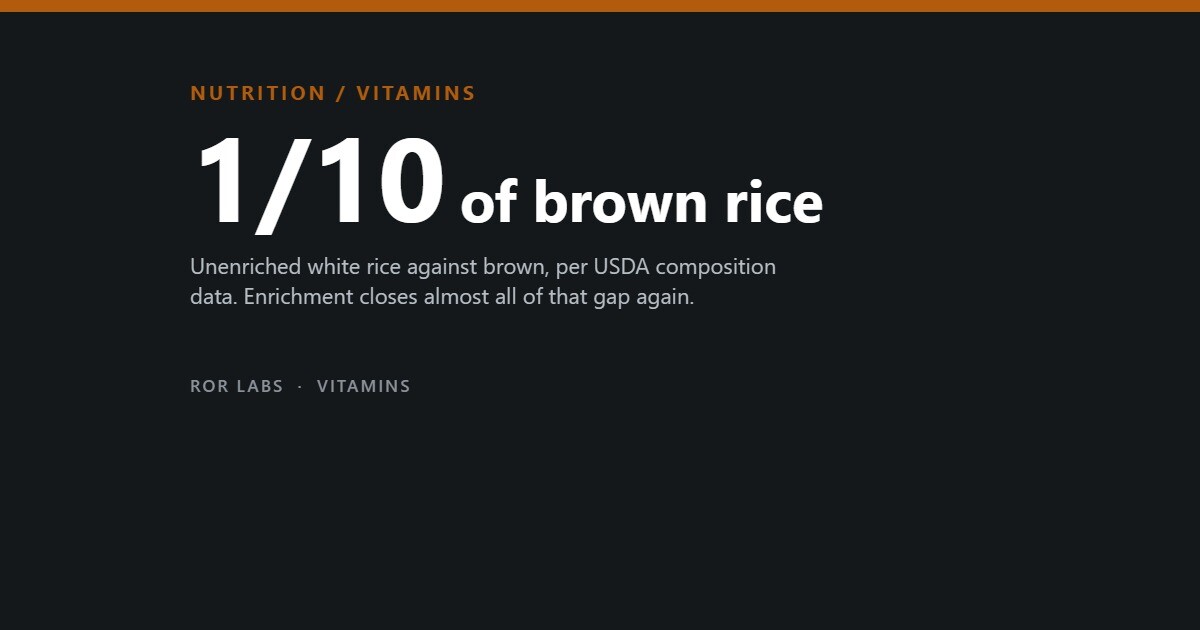
The scale of the loss is measurable today: unless white rice is enriched, it holds about one-tenth the thiamin of unenriched brown rice.
What milling removes, and what enrichment puts back
USDA SR Legacy, thiamin per 100 g of cooked rice.
Source: USDA FoodData Central, SR Legacy. Milligrams per 100 g. Full bar = 0.212 mg.
The second half of the story rarely gets told. Enriched white rice carries 0.163 mg per 100 g against brown rice at 0.178, effectively the same, and parboiled enriched rice carries more than brown does. The industry that created the deficiency closed it again by putting the vitamin back after milling, and in the United States about half of dietary thiamin now comes from foods it was added to.
Bread does not fully escape either, since heating costs thiamin and bread holds 20 to 30 per cent less than its raw ingredients.
What running short does
The classic presentation is beriberi, characterised mainly by peripheral neuropathy and wasting, with impaired sensory, motor and reflex function. In severe cases it produces congestive heart failure, oedema of the lower limbs and, occasionally, death.
The more common presentation in the United States is Wernicke-Korsakoff syndrome, whose two phases differ sharply in outlook and are worth separating.
The two phases, and what treatment recovers
NIH Office of Dietary Supplements.
The people at risk are specific. Up to 80 per cent of people with chronic alcohol dependence develop thiamin deficiency, because ethanol reduces absorption, liver stores and phosphorylation all at once. Between 20 and 30 per cent of older adults show laboratory indicators suggesting some degree of deficiency. Bariatric surgery carries a real risk through malabsorption: one literature review counted 84 cases of Wernicke’s encephalopathy after bariatric surgery, mostly gastric bypass, between 1991 and 2008. People with HIV are at higher risk, and small studies have found plasma thiamin up to 76 per cent lower in type 1 diabetes and 50 to 75 per cent lower in type 2.
Why there is no upper limit
Thiamin is one of the few nutrients with no tolerable upper intake level, and the reasoning is unusually explicit. The Food and Nutrition Board set none because the body excretes excess thiamin in urine and there are no reports of adverse effects from high intakes, 50 mg a day or more, from food or supplements.
The mechanism the Board proposes for that lack of toxicity is the interesting part. Thiamin is absorbed by active transport at nutritional doses and by passive diffusion at pharmacological ones, and the Board points to the rapid decline in absorption at intakes above 5 milligrams.
Where the numbers sit, in milligrams a day
Full bar = 100 mg, a common supplement dose.
Sources: NIH Office of Dietary Supplements; Food and Nutrition Board. No upper level has been set.
Together those two facts say something slightly awkward about the tablet: it is safe because most of it is not absorbed. The absence of an upper limit is evidence that a large dose mostly leaves, and gives no sign that it does more.
High-dose thiamin is still not pointless everywhere. Where absorption is the problem (alcohol dependence, bariatric surgery, suspected Wernicke’s), treatment is given in doses far above the RDA and often by injection, because the oral route cannot deliver enough. That is a clinical decision, and a different question from whether a healthy person benefits from 100 mg on a shelf.
A quieter problem sits underneath all of this: the fix worked. Enrichment removed beriberi from the general population of countries that adopted it, so clinicians now rarely see the disease or expect it. The remaining cases sit almost entirely inside the risk groups above, where the cause is absorption or intake collapse, and where the acute phase can kill a fifth of the people who reach it untreated. A deficiency that has become rare has not become harmless.
What the official pages say about thiamin
This section collects what US and UK government pages say about thiamin (vitamin B1) amounts, deficiency and the absence of an upper limit. It is general information, not medical advice; talk to a doctor or pharmacist before taking supplements.
| Source | What it says |
|---|---|
| NIH Office of Dietary Supplements, Thiamin consumer fact sheet (updated Mar. 22, 2021) | Recommended amounts: men 1.2 mg a day, women 1.1 mg, pregnancy and breastfeeding 1.4 mg. No upper limit is given; the page says thiamin has not been shown to cause harm, without giving a reason. |
| NIH ODS (same page) | Deficiency can cause weight and appetite loss, confusion, memory loss, muscle weakness and heart problems, and severe deficiency is beriberi. Wernicke-Korsakoff syndrome mostly affects people with alcohol dependence. Higher-risk groups are people with alcohol dependence, older adults, people with HIV/AIDS or diabetes, and people after bariatric surgery; the page calls deficiency rare in the US. Furosemide and fluorouracil can lower thiamin levels. |
| NHS, B vitamins and folic acid (last reviewed Aug. 3, 2020; the next review date has passed) | About 1 mg a day for men and 0.8 mg for women aged 19–64. Thiamin cannot be stored in the body. The page says there is not enough evidence on high doses and that supplements of 100 mg a day or less are unlikely to cause harm. |
| UK Department of Health, Dietary Reference Values: A Guide, 1991 guide | Sets thiamin per 1,000 kilocalories, not as a flat amount: a reference nutrient intake of 0.40 mg per 1,000 kcal from age 1. Our reading of its worked examples (our arithmetic): 1.00 mg for men aged 19–49 at 2,550 kcal and 0.80 mg for women at 1,940 kcal. |
The US and UK amounts differ (1.2 and 1.1 mg against about 1 and 0.8 mg), and the UK 1991 guide scales thiamin to energy intake. Both the NIH and the NHS decline to set a formal upper limit but frame it differently: NIH says no harm has been shown, the NHS gives 100 mg a day as unlikely to cause harm. We could not confirm the current GOV.UK page on dietary reference values, because it failed to load, so the UK definitions here come from the 1991 guide; its upper-limit figures were not legible enough to quote. The NIH page does not cover storage or cooking, and the NHS page is past its review date. Figures were read through automated page fetches, so confirm exact numbers on the live pages.
What to do
Steps sorted by when they matter. Each one says how strong the evidence is: Measured Official advice Untested
Before
- If you eat white rice, choose enriched. Unenriched white rice holds about a tenth of the thiamin of brown rice. Measured see Sources
- If you drink heavily, have had bariatric surgery or care for someone who has, raise thiamin with a doctor. Up to 80 per cent of people with alcohol dependence run short. Measured see Sources
If it happens
- Treat suspected Wernicke’s encephalopathy as a medical emergency; it is treated urgently with thiamin by injection. Untreated Wernicke’s kills up to 20 per cent. Official advice see Sources
What not to do
- Do not assume a 100 mg tablet does more. Absorption falls away sharply above about 5 mg and the rest is excreted. Official advice see Sources
Not medical advice. Suspected Wernicke’s encephalopathy needs urgent medical treatment.
Who falls short on thiamin: OECD countries by sex and age
OECD average, 38 countries (modelled estimate)
| Age group | Women | Men |
|---|---|---|
| Children 5–14 | 9% | 7% |
| Teens 15–19 | 21% | 21% |
| Adults 20–49 | 22% | 22% |
| Adults 50–64 | 25% | 25% |
| 65 and over | 31% | 30% |
Population-weighted share with usual intake below the average requirement, from food including current fortification, excluding supplements. These are modelled estimates built from national diet data; they can differ from what national surveys measure (see the next table).
What national surveys measured
| Country and survey | Teens F / M | Adults F / M | Older F / M |
|---|---|---|---|
| United StatesNHANES 2017–Mar 2020, USDA ARS · below EAR | 18% / 5%14–18 | 13% / 4%31–50 | 14% / 5%71+ |
| CanadaCCHS-Nutrition 2015, Health Canada · below EAR | 8% / <3%14–18 | — | 19% / —71+ |
| AustraliaNNPAS 2023, ABS · below EAR | 7% / 3%12–17 | 23% / 14%30–49 | 20% / 11%75+ |
| JapanMINNADE 2016–20 (Shinozaki et al. 2023) · below EAR | 50% / 30%15–17 | 48% / 69%30–49 | 21% / 42%65–74 |
| United KingdomNDNS 2019–23 · below LRNI (lower cut-off) | 0% / 0%11–18 | 0% / 0%19–64 | 0% / 0%65–74 |
“—” means not published or too unreliable to publish. Surveys differ in year, age bands, reference values and method, so compare countries as a rough guide. The UK’s LRNI is a lower cut-off than the EAR, so its percentages run lower. Supplements are excluded.
Why countries, sexes and ages differ
- Polished white rice has a tenth of the thiamin of brown rice; Japan’s beriberi epidemic followed mechanical rice polishing. Rice-based diets without enrichment run short more often. (NIH ODS, Thiamin)
- About half of US thiamin intake is added through flour enrichment, and UK law requires at least 0.24 mg per 100 g of flour — which is why both countries show almost no shortfall. (UK Bread and Flour Regulations 1998)
- Among non-Hispanic white US adults above 185% of the poverty line, 38% fall short on naturally occurring food alone against about 5% with enriched foods. (Malek et al., Nutrients 2019)
- Why the model and surveys disagree: the model infers each country’s intake spread from median intakes, applies one harmonised set of requirements, and leaves out supplements (and, for some nutrients, fortification); surveys use national reference values and methods. (Passarelli et al., AJCN 2022)
Sources: Passarelli et al., Lancet Glob Health 2024; Global Datasets on Human Inadequate Nutrient Intakes (Harvard Dataverse, CC0, 2026; fortification from Friesen et al.); national surveys as linked in the table.
Questions people ask
How much thiamin is in a tablespoon?
Yeast extract spread about 3.51 mg, rice bran 0.41, wheat germ 0.28, sunflower seeds 0.22, pork chop 0.104, black beans 0.037. Only the first is more than a day’s requirement, and almost nobody eats it by the spoonful.
Is brown rice better than white rice for thiamin?
Only if the white rice is not enriched. Unenriched, white rice holds about a tenth of what brown rice does. Enriched, the USDA figures are 0.163 mg per 100 g against 0.178 for brown, and enriched parboiled rice, at 0.212, carries more than brown.
Does a 100 mg tablet do anything?
Absorption declines rapidly above about 5 mg, so most of a 100 mg dose is not taken up and is excreted, which is why no upper level exists. A doctor who prescribes a high dose for a specific reason (alcohol dependence, after bariatric surgery, a suspected Wernicke’s presentation) is in a different situation, and the dose is deliberately large.
Who actually runs short?
Little for the general population in countries that enrich their flour and rice. The measured risk sits with chronic alcohol dependence (up to 80 per cent), older adults (20 to 30 per cent with laboratory indicators), people after bariatric surgery, and people with HIV.
Does cooking destroy it?
Heat costs some. Bread carries 20 to 30 per cent less thiamin than its raw ingredients, a real loss but a modest one next to what milling removes before the flour is ever baked.
What about the thiamin figures in diabetes?
Small studies have reported plasma thiamin up to 76 per cent lower in type 1 diabetes and 50 to 75 per cent lower in type 2. Those are measurements of a difference from small samples, and they do not show that supplementing changes anything. Worth knowing, and not yet a reason to do anything.
The short version
- Thiamin diphosphate is a cofactor for five enzymes in energy metabolism. The body holds about 25 to 30 mg in total.
- Per tablespoon: yeast extract 3.51 mg, rice bran 0.41, wheat germ 0.28. Milling removes what sits at the top of the list.
- Beriberi became a public health problem in the nineteenth century as steam-powered rice mills spread, and the vitamin was found in the discarded polishings.
- Enrichment closed the gap: enriched white rice 0.163 mg per 100 g against brown at 0.178. About half of US dietary thiamin now comes from fortified foods.
- Deficiency is beriberi, or Wernicke-Korsakoff. Untreated Wernicke’s kills up to 20 per cent; about a quarter of Korsakoff patients do not recover with treatment.
- RDA 1.2 mg men, 1.1 mg women. No upper level, because absorption falls away sharply above 5 mg and the excess is excreted.
This is a reference page, not clinical guidance. Suspected Wernicke’s encephalopathy is a medical emergency and is treated urgently with parenteral thiamin; nothing here is a substitute for that.
Further reading: The NIH fact sheet is unusually candid here — it states the reason no upper level exists, which is a more useful fact than the absence itself.
Sources
- NIH Office of Dietary Supplements, “Thiamin”, fact sheet for health professionals. (RDA 1.2/1.1 mg; no UL, with the stated reasoning and the decline in absorption above 5 mg; 25–30 mg body content, 80% as TDP, cofactor for five enzymes; beriberi and Wernicke-Korsakoff including the 20% and one-quarter figures; risk groups including the 80%, 20–30%, 84 bariatric cases, and the diabetes plasma figures; white rice at one-tenth of unenriched brown; bread 20–30% loss; about half of US thiamin from fortified foods.)
- USDA FoodData Central, SR Legacy, thiamin per 100 g. (Yeast extract spread 167717, 23.4 mg; rice bran 169713, 2.75; wheat germ 168892, 1.88; sunflower seeds 170562, 1.48; pork loin chop 168251, 0.693; wheat bran 169722, 0.523; black beans boiled 173735, 0.244; brown rice cooked 169704, 0.178; enriched white rice cooked 168878, 0.163; enriched parboiled 169708, 0.212.)
- Bender, D.A. and Bender, A.E., on thiamin. (Beriberi recognised sporadically for some 1,300 years; a major public health problem in the Far East in the nineteenth century following the steam-powered rice mill and wider consumption of highly milled rice; the factor found in the discarded polishings and first named aneurine, the anti-neuritic vitamin.)
- NIH ODS, Thiamin consumer fact sheet; NHS, B vitamins and folic acid; UK Department of Health, Dietary Reference Values: A Guide (1991).