Home Underinsurance: What the Evidence Shows
Key takeaways · 13 min read
- Underinsurance means your dwelling limit or sum insured is below what it would cost to rebuild today. It is common, and most people do not know they have it until after a loss.
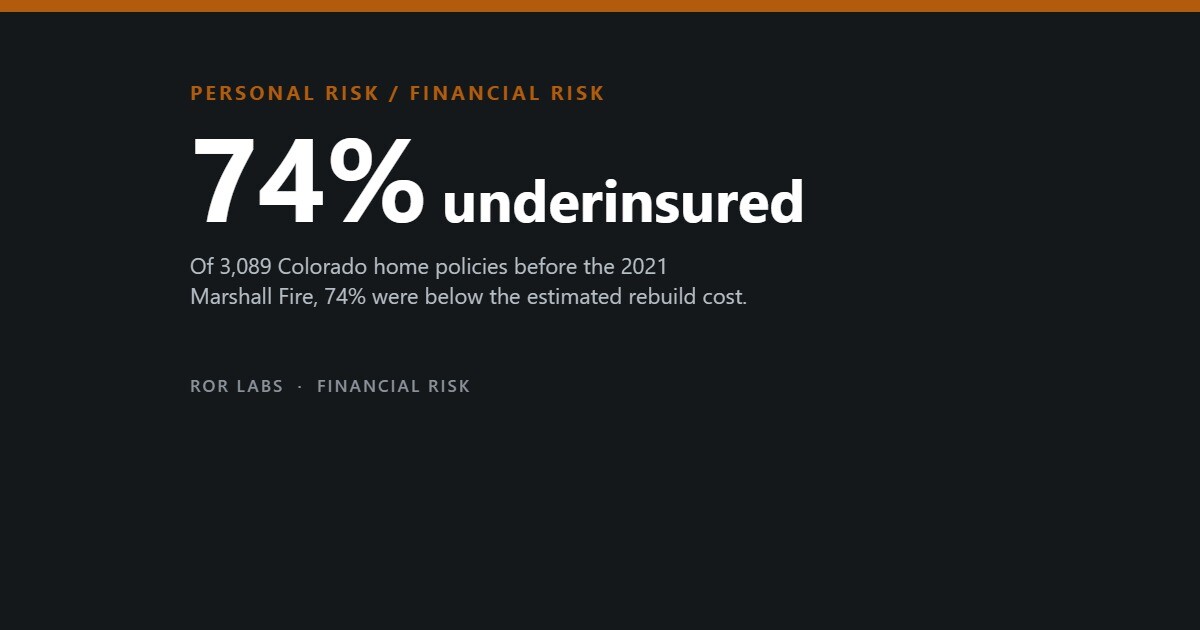
- Two administrative datasets agree with survivors’ surveys: 74% of Colorado policies were below estimated rebuild cost before the 2021 Marshall Fire, and 71.3% of destroyed California homes in 2018–2023 claims were insured below the insurer’s own final loss.
- The gap changes what people do next: in the Marshall Fire data, more underinsured owners were slower to seek rebuilding permits and more likely to sell.
- Partial claims can be cut too: under an average clause or a coinsurance condition, a home insured well below its rebuild cost may receive only a proportion of a repair bill.
Most people buy home insurance once, renew it every year and never test it. The number that matters most, the amount the insurer will pay to rebuild the house, is usually set at the start and then nudged up by inflation. It only gets checked against reality when the house burns down or is flooded, and by then it cannot be changed.
This article looks at what happens when that number is too low. It draws on two large studies of insurers’ own policy and claims data, a long series of surveys of people who lost homes in US wildfires, regulators’ guidance in the UK, US and Australia, and research on why rebuilding costs rise after disasters and why buyers end up short.
It does not recommend any insurer, broker or product, and it is not about whether a disaster is covered at all. That is a different gap. Here the house is insured, the claim is accepted, and the money still does not stretch far enough.
What underinsurance means
A home policy usually has a dwelling limit (US) or a buildings sum insured (UK, Australia). Underinsurance means that figure is lower than the cost of rebuilding the same house today: demolition, debris removal, labour, materials, fees and any upgrades the building code now demands. It is not the market value. Land does not burn, and a house can cost more to rebuild than it would sell for, or less.
New York’s Department of Financial Services puts it plainly: cover is based on the home’s full replacement cost, the amount needed to rebuild if it were completely destroyed. Adding a room or other substantial improvements raises that cost, so the regulator advises reviewing the policy every year. Flood exclusions are a separate problem, covered in our article on what home insurance does not cover.
How common it is after a total loss
The longest record comes from United Policyholders, a US non-profit that surveys households after major wildfires. In surveys going back to 2007 it has often found that more than half of those who lost a home said they lacked enough cover to rebuild or replace it. After the 2021 Marshall Fire in Colorado, 80% said so at one year, with an average shortfall of $110 per square foot.
Most wildfire survivors say they were short
Share of total-loss respondents saying their insurance would not cover rebuilding, by fire and survey round.
Source: United Policyholders, Roadmap to Recovery survey results (self-selected respondents).
The latest round covered the January 2025 Los Angeles fires. It was open from 6 January to 17 February 2026 and drew 675 households. Of those whose homes were destroyed, 69% said they did not have enough insurance to rebuild, 7% said they did, and 24% did not yet know. The average reported gap was $247 per square foot.
Surveys like these are filled in by people who chose to respond, often through the charity’s own outreach. The stronger check is administrative data. J. Anthony Cookson, Emily Gallagher and Philip Mulder obtained Colorado Division of Insurance records for 4,859 policies from 24 insurers in the Marshall Fire area and compared each dwelling limit with an estimated rebuild cost.
Insurers’ own data tell the same story
Share of homes insured below rebuild cost in two administrative datasets.
Sources: Cookson, Gallagher and Mulder, Federal Reserve Bank of Philadelphia WP 25-09 (2025); Klein, Lewis & Clark Law Review (2026), as reported by Insurance Business (28 September 2026).
In their main sample of 3,089 single-family policies, 74% were underinsured and 36% were severely so, with cover below three-quarters of the rebuild cost. The average policy covered 87.4%. A second study, by law professor Kenneth Klein, used California Department of Insurance data on 74,070 fire claims on owner-occupied homes from 2018 to 2023. In 71.3% of destroyed homes, the dwelling cover was below the insurer’s own final loss figure, by about 19% on average.
What happens after a big loss
Underinsurance is not just a smaller cheque. Cookson and colleagues followed the Colorado households to see who applied for rebuilding permits and who sold their lots. Among those who lost homes, each 10 percentage points of extra cover raised the chance of a permit within a year by about 4 points, roughly a fifth of the average. On their estimates, underinsurance cut permits in the first year by 25% and explains over half of sales of destroyed properties within 18 months.
In Los Angeles the per-square-foot figures show the size of the hole. Eaton Fire respondents were insured for an average $523 per square foot against rebuild estimates of $754. In the Palisades the figures were $697 and $948. Even so, 71% of total-loss respondents planned to rebuild, and 41% of those had applied for a permit at one year.
What survivors were insured for, and what rebuilding costs
Average dwelling cover and average rebuild estimate per square foot, total-loss respondents, 2025 Los Angeles fires.
Source: United Policyholders, 2025 LA Wildfires 12-Month Survey Results (2026).
A second clock runs alongside. Additional living expenses cover rent while the house is rebuilt, and it is limited. In the same survey, 10% of total-loss households expected their living-expense money to run out before 18 months, by July 2026. Australian interviews after the 2013 Blue Mountains bushfires found the same pattern: many people were underinsured and stretched their payouts in ways that had practical and emotional costs (Eriksen and de Vet, 2020).
The average clause and partial claims
A total loss is not the only time the gap bites. Many policies contain a condition that cuts partial claims when the home is insured well below its value. In the UK it is called the average clause. The Financial Ombudsman Service gives the example of a house that would cost £400,000 to rebuild but is insured for £200,000: it is 50% underinsured, and some insurers would pay only half of any claim.
US policies use a coinsurance condition, usually set at 80%. New York’s regulator works through two houses with a $100,000 replacement cost and the same $5,000 roof repair after a windstorm. The owner insured for $80,000 is paid the full repair, less the deductible. The owner insured for $50,000 receives $3,125.
The same roof, two different cheques
Payout for a $5,000 roof repair on a house that would cost $100,000 to rebuild (before deductible).
Source: New York State Department of Financial Services, Determining how much insurance you need.
Worked example: a 60% policy. When a property is insured for less than its value, insurers settle partial losses in proportion. In practice many policies soften this with an 80% condition, whether it is called coinsurance or something else: a home insured for 80% or more of its value has its loss paid in full, up to the amount insured. Below 80% the claim is cut in proportion. Take a home that should be insured for $500,000 but carries $300,000, or 60%, and a $100,000 kitchen fire. The insurer pays $100,000 × 60% = $60,000 and the owner bears $40,000. Had the home been insured for $400,000 (80%) or more, an 80% condition would pay the full $100,000. The claim is accepted and the loss is far below the policy limit, yet the owner still absorbs part of it. Check how your own policy handles it
Insuring more than the loss does not pay more. The reverse mistake is also common. Property insurance pays for the actual loss, not for the amount insured. If the same home is insured for 110% of its value, a $100,000 fire still pays $100,000, and even a total loss pays no more than the true loss. The extra cover bought nothing except extra premium. The sensible target is to insure for the full replacement cost, with a modest margin for rising building costs, rather than to pile on cover far above it. Check your policy for how it treats a limit above the home’s value.
The ombudsman does not treat the clause as automatic. It usually finds it unfair to apply if the insurer never clearly asked for the full rebuild cost, if its questions were unclear, or if it did not warn about the consequences, and in those cases it will usually require the claim to be paid in full. The deductible is a separate cost on top; the trade-offs there are covered in our article on insurance deductibles.
Why rebuild costs jump after disasters
After a large disaster, the same repair costs more than it would after a small one. Engineers call this demand surge. In a 2011 review, Anna Olsen and Keith Porter put the extra at 20% or more, and noted that it has no standard definition or accepted predictive theory. A later econometric model built on 192 US catastrophe events found the effect grows with the total amount of repair work (Döhrmann et al., 2017).

Labour seems to be the main driver. Olsen and Porter’s study of hurricane repair costs from 2002 to 2010 found that changes in the labour component drove changes in total repair costs. In Australia, the securities regulator ASIC noted that costs jumped by 75% after Cyclone Tracy in 1974, a rise even careful owners could not have anticipated.
Ordinary inflation adds to the surge. The Marshall Fire researchers deflated their cost estimates by a 22% rise in a construction cost index between early 2021 and early 2023. In the UK, the Building Cost Information Service said rebuild costs for houses and flats rose 4.9% in the year to January 2026, after 3.8% the year before, and that labour costs in 2024 were more than a fifth higher than in 2019. A sum set five years ago and only indexed may already be behind.
Why people end up underinsured
The usual story is that people skimp to save on premiums. The evidence points elsewhere. Klein found that insurers’ own reconstruction estimates at the point of sale were below the eventual loss in 75% to 95% of cases, by more than 30% on average. About 90% of the policies already carried extended or guaranteed replacement cost, often at 150%, yet most destroyed homes still fell short.
Cookson and colleagues reached a related conclusion from the buyer’s side. Customers responded to quoted premiums but not to how much cover those premiums bought, treating insurers that wrote lower limits as if they were cheaper. The authors call this coverage neglect and estimate that removing it would be worth about $290 a year per household, about 10% of premiums.
Australia’s regulator found something similar after the 2003 Canberra bushfires. Of 133 homeowners it surveyed, just over half had set the sum insured themselves; only seven had an independent valuation and two had used an online calculator. ASIC also noted that sums were often not raised after renovations or as costs rose. The UK ombudsman says consumers are usually not experienced at valuing a home.
How Canberra homeowners set their sum insured
Method used by 133 ACT homeowners surveyed after the January 2003 bushfires.
Source: ASIC Report 54, Getting home insurance right (September 2005), Table 2.1.
Who is short also follows social lines. A national Australian survey by Kate Booth and Bruce Tranter found people of lower socio-economic status and city dwellers more likely to be underinsured, and linked insurance decisions to trust. A survey after four US hurricanes found that insured households were less likely to report heavy financial burdens or unmet needs than the largely uninsured (You and Kousky, 2024).
Where the numbers come from
Every underinsurance figure depends on what it is measured against, and each yardstick has a bias. United Policyholders’ respondents are self-selected and many found the charity through its outreach. The Colorado study used a construction-cost database scaled to $350 per square foot, the low end of local quotes, because the database alone looked too low. Klein’s yardstick is the insurer’s own final loss, which can include post-disaster price rises a buyer could not have known.
Each study also has limits its authors state. The Colorado paper covers one fire in one market and could not see insurers’ replacement-cost estimates, deductibles or endorsements. Klein’s data are California only, rely on insurers’ self-reported figures and exclude flood and wind claims. Klein’s figures here come from a trade-press report of his paper, and the demand-surge studies were read as abstracts only.
Industry figures need the most care. A UK firm that sells rebuild-cost assessments reported that 67% of 46,917 properties it assessed were underinsured, 25% overinsured and 8% about right. The sample includes commercial buildings whose owners chose to commission an assessment, and the firm has an interest in the result. Much older ASIC data show the range: an industry survey of 1,000 homeowners in 2000 found 87% underinsured, while insurers’ own 2002 data put homes short by 10% or more at 27.5%.
What makes the pattern believable is not any single number. Self-selected surveys, policy records and claims files, built in different ways by people with different interests, all point the same way. The exact share is uncertain; the direction is not.
What to do
Steps sorted by when they matter. Each one says how strong the evidence is: Measured Official advice Untested
Before
- Check that your dwelling limit or buildings sum insured reflects today’s full rebuild cost, not the market value or purchase price of the house. Official advice see Sources
- Review the sum insured every year and after adding a room or other substantial improvements, since both raise the rebuild cost. Official advice see Sources
- If an insurer’s online calculator pre-fills fields, check each one and confirm the final figure covers the full rebuild cost. Official advice see Sources
- Find out whether your policy has an average clause or an 80% coinsurance condition, and how close your cover is to that threshold. Official advice see Sources
- Do not assume the insurer’s estimate at the point of sale is right: in California claims it was below the final loss in 75% to 95% of cases. Measured see Sources
If it happens
- If a partial claim is cut under an average clause, ask how the reduction was calculated and whether the insurer clearly asked for the full rebuild cost when you bought the policy. Official advice see Sources
- Check the limit on additional living expenses early: after the 2025 Los Angeles fires, 10% of total-loss households expected that money to run out within 18 months. Measured see Sources
Afterwards
- If you think a reduction was unfair, the UK Financial Ombudsman Service reviews such complaints and may require the claim to be paid in full; other countries have their own routes. Official advice see Sources
- Expect rebuild costs to be higher after a large disaster than before it; reviews put demand surge at 20% or more. Measured see Sources
What not to do
- Do not rely on extended replacement cost alone to close the gap: about 90% of the California policies studied had it, yet most destroyed homes were still short. Measured see Sources
- Do not compare policies on premium alone; buyers who ignored how much cover a premium bought tended to end up underinsured. Measured see Sources
General information, not financial, insurance or legal advice.
Questions people ask
Is my home insured for its market value?
It should not be. Home cover is based on the cost to rebuild, which excludes land and can be higher or lower than the sale price. New York’s regulator describes replacement cost as the amount needed to rebuild if the home were completely destroyed.
What is the average clause?
A UK policy condition that lets an insurer pay only a proportion of a claim if the home is insured for less than its full rebuild cost. The Financial Ombudsman Service may find it unfair to apply if the insurer did not ask clear questions.
Does extended replacement cost solve underinsurance?
Not always. In Klein’s California data, about 90% of policies had extended or guaranteed replacement cost, often at 150%, yet most destroyed homes were still insured below the insurer’s final loss.
Why do costs rise after a disaster?
Demand surge: thousands of repairs compete for the same builders and materials at once. One review put the extra at 20% or more, and in a study of hurricane repairs labour drove most of the change.
How common is underinsurance?
In the best administrative data, roughly seven in ten homes lost to fire were insured below the cost of rebuilding. Survivor surveys after US wildfires range from 42% to 80% saying they were short, though many did not yet know.
The short version
- Underinsurance means your dwelling limit or sum insured is below what it would cost to rebuild today. It is common, and most people do not know they have it until after a loss.
- Two administrative datasets agree with survivors’ surveys: 74% of Colorado policies were below estimated rebuild cost before the 2021 Marshall Fire, and 71.3% of destroyed California homes in 2018–2023 claims were insured below the insurer’s own final loss.
- The gap changes what people do next: in the Marshall Fire data, more underinsured owners were slower to seek rebuilding permits and more likely to sell.
- Partial claims can be cut too: under an average clause or a coinsurance condition, a home insured well below its rebuild cost may receive only a proportion of a repair bill.
- Rebuild costs often jump after big disasters (‘demand surge’), and the insurer’s own estimate at the point of sale was below the final loss in most California cases studied.
- The cause is rarely carelessness: rebuild cost is hard to estimate, buyers compare premiums more than limits, and survey samples are self-selected, so exact rates are uncertain.
This article summarises research, regulators’ guidance and news reports for general information. It is not financial, insurance or legal advice. Policy terms, including average and coinsurance clauses, and consumer protections differ by country and by insurer, so check your own policy wording and, if you need help, ask a qualified adviser or your regulator’s consumer service.
Further reading: Cookson, Gallagher and Mulder, Federal Reserve Bank of Philadelphia Working Paper 25-09 (2025), for underinsurance and rebuilding after the Marshall Fire. Olsen and Porter, Natural Hazards Review (2011), for what is known about demand surge. ASIC Report 54 (2005), for how homeowners set their sums insured.
Sources
- Insurance Business. California mandates bigger rebuild cushions as voters demand the right to sue insurers (8 October 2026).
- New York State Department of Financial Services. Determining how much insurance you need (consumer guide).
- United Policyholders. Roadmap to Recovery survey results (wildfire surveys, 2007–2026).
- United Policyholders. 2025 LA Wildfires 12-Month Survey Results (2026).
- Cookson JA, Gallagher E, Mulder P. Coverage neglect in homeowners insurance. Federal Reserve Bank of Philadelphia Working Paper 25-09 (2025), doi:10.21799/frbp.wp.2025.09.
- Klein KS. Truth and consequences. Lewis & Clark Law Review 30:95 (2026).
- Insurance Business. Insurers’ own rebuild estimates are driving most underinsurance, study finds (28 September 2026).
- Eriksen C, de Vet E. Untangling insurance, rebuilding, and wellbeing in bushfire recovery. Geographical Research (2020), doi:10.1111/1745-5871.12451.
- Financial Ombudsman Service (UK). Underinsurance in home insurance complaints.
- Olsen AH, Porter KA. What we know about demand surge: brief summary. Natural Hazards Review (2011), doi:10.1061/(ASCE)NH.1527-6996.0000028.
- Döhrmann D, Gürtler M, Hibbeln MT. Insured loss inflation: how natural catastrophes affect reconstruction costs. J Risk Insur (2017), doi:10.1111/jori.12134.
- Olsen AH, Porter KA. Storm surge to demand surge: exploratory study of hurricanes, labor wages, and material prices. Natural Hazards Review (2013), doi:10.1061/(ASCE)NH.1527-6996.0000111.
- Australian Securities and Investments Commission. Report 54: Getting home insurance right (September 2005).
- Insurance Business. UK rebuild costs jump to 4.9% as oil price shock adds new pressure (12 August 2026).
- Building Cost Information Service (BCIS). Rebuild cost update (24 September 2025).
- Booth K, Tranter B. When disaster strikes: under-insurance in Australian households. Urban Studies (2018), doi:10.1177/0042098017736257.
- You X, Kousky C. Improving household and community disaster recovery: evidence on the role of insurance. J Risk Insur (2024), doi:10.1111/jori.12466.
- Insurance Edge. Property: new research reveals gap between actual rebuild costs and insured value (15 September 2026).