Insurance Deductibles: What the Evidence Shows
Key takeaways · 11 min read
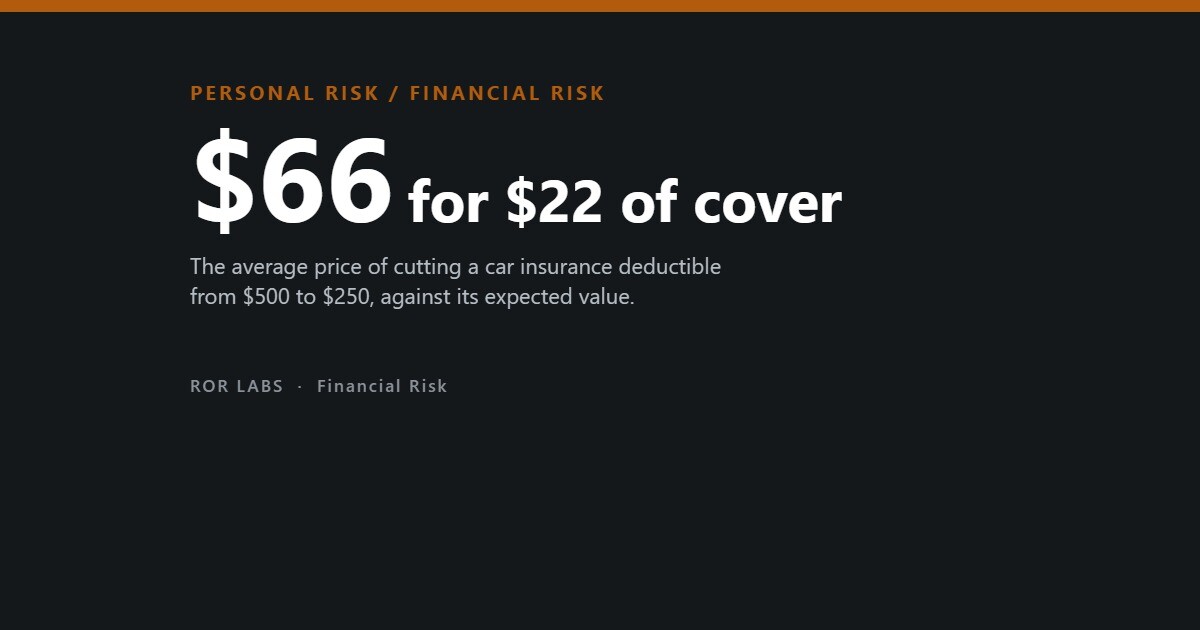
- In one data set of 111,894 car insurance choices, cutting the deductible from $500 to $250 cost $66 a year on average, for cover worth about $22.
- Moving from $1,000 to $500 cost about $49, close to its expected value of $44.
- In flood insurance, over 94% of households chose one of the two lowest deductibles.
- Overweighting small probabilities explains these choices better than ordinary risk aversion.
In this article
- What a deductible choice costs
- The pattern holds in home and flood insurance
- Why people choose this way
- Or perhaps nobody looked at the whole menu
- Some low-deductible buyers are right
- When a low deductible makes sense
- The small-claim problem
- What the evidence does not show
- Questions people ask
- The short version
- Sources
Every car or home insurance quote comes with a choice that looks like a detail: the deductible, the part of any claim you pay yourself. A lower deductible means a higher premium. Most people pick one of the lower options and move on.
Economists have studied that choice closely, because it is one of the few places where you can see people pricing a small, well-defined risk with real money. The finding has been remarkably consistent across home, car and flood insurance. Most households pay far more to lower their deductible than the extra cover is expected to return.
This is what the evidence shows about deductible choices, why people make them, and when the choice that looks like a mistake is not one. In one data set of over 100,000 car insurance choices, the average price of lowering a collision deductible from $500 to $250 was $66 a year, for extra cover worth about $22.
What a deductible choice costs
The simplest way to judge a deductible is to compare what the lower option costs with what it is expected to pay back. If you have a claim, a $250 deductible saves you $250 compared with a $500 one. If your chance of a claim in a year is about 9%, that saving is worth about $22 a year on average.
Levon Barseghyan, Francesca Molinari, Joshua Teitelbaum and colleagues have analysed car insurance data from a large US insurer in a series of papers. In the data set used in their 2021 study in Econometrica, covering 111,894 collision choices, the average annual claim probability was 8.8%. The average extra premium to move from a $500 deductible to $250 was $66. The median was $55.
At those prices the lower deductible costs roughly three times its expected value. Yet the average deductible chosen was $439, and the median was $500, not the $1,000 option.
The next step up is different. Moving from a $1,000 deductible down to $500 cost an average of $49 a year, against an expected value of about $44 at the same claim rate. That is close to a fair price. The expensive part of the menu is the last few hundred dollars of cover, which is the part many people buy.
What lower deductibles cost against what they return
Car collision insurance, average annual figures, 111,894 choices at one US insurer.
Barseghyan, Coughlin, Molinari, Teitelbaum and colleagues, Econometrica, 2021, online appendix summary statistics. Expected value is our calculation, assuming any claim exceeds the deductible.

The pattern holds in home and flood insurance
Justin Sydnor first documented the scale of the pattern in home insurance, in a 2010 paper in American Economic Journal: Applied Economics titled “(Over)insuring Modest Risks”. Using data on deductible choices from a large home insurer, he found that most customers bought low deductibles at costs significantly above their expected value.
Fitting those choices to a standard model of risk aversion gave implausibly large values. A household that preferred a low deductible at those prices would, under the same model, turn down gambles that almost anyone would accept. Something other than ordinary caution about money was going on.
Benjamin Collier, Daniel Schwartz, Howard Kunreuther and Erwann Michel-Kerjan found the same pattern in the US National Flood Insurance Program, using the decisions of more than 100,000 households. Over 94% chose one of the two lowest deductibles out of six options, and 77% insured their home for at least its full replacement cost. Explaining those choices with a standard model required a median relative risk aversion of around 108, a number far outside the range economists consider plausible.
Flood insurance choices
National Flood Insurance Program, more than 100,000 households.
Collier, Schwartz, Kunreuther and Michel-Kerjan, National Bureau of Economic Research working paper 23579, 2017.
Why people choose this way
The leading explanation is not that people hate risk. It is that they misjudge small probabilities. In a 2013 paper in the American Economic Review, Barseghyan and colleagues fitted a model that allowed for both ordinary risk aversion and distorted probabilities. Probability distortions, specifically substantial overweighting of small probabilities, did most of the work in explaining deductible choices.
In plain terms, a 5% or 9% chance of a claim feels larger than it is. The same tendency, in reverse, is part of why people buy lottery tickets. The authors also tested explanations based on loss aversion and disappointment aversion and found that neither alone could produce the pattern.
Other explanations add to the picture. Markus Fels has argued that people keep separate mental accounts: paying a deductible feels like a new loss drawn from money set aside for something else, while the premium is a routine, predictable bill. A review by Robert Schindler lists a preference for flat, predictable payments, missing price information, and a feeling of getting a good deal as further motives.
Pranav Jindal studied the same question in extended warranties on washing machines, where retailers earn high margins. Using survey choices in which failure probabilities and repair costs were stated explicitly, he found that loss aversion mattered more than either the curvature of utility or probability weighting. The explanation may differ by product and by how the choice is presented.
What explains deductible choices
Findings from studies that compared explanations directly.
Barseghyan, Molinari, O’Donoghue and Teitelbaum, American Economic Review, 2013; Jindal, Marketing Science, 2015. Bar lengths are schematic.
Or perhaps nobody looked at the whole menu
The most recent work in this literature offers a different reading. In the 2021 Econometrica study, Barseghyan, Maura Coughlin, Molinari and Teitelbaum asked what happens if households do not actually consider every deductible on offer. Perhaps an agent quoted two options, or the customer only compared the current deductible with one alternative.
When the model allowed for that, the data could be explained by ordinary expected utility with low levels of risk aversion. But more than three in four households needed a limited set of options to make their choices consistent. A related paper by Barseghyan, Molinari and Matthew Thirkettle in the American Economic Review pointed to a telling detail in the same kind of data: the $200 collision deductible was always a worse deal than either the $100 or the $250 option, so no household that compared all three should have chosen it. Some did.
That is a more mundane explanation than distorted probabilities, and it points to a more mundane fix. If the problem is partly that people never see the full menu with prices side by side, then asking for every option and its premium does more than any amount of reasoning about risk.
It also changes who carries the responsibility. A household that was shown two options has not made an irrational choice among six. The presentation of the choice, by an agent, a website or a renewal letter, is part of the result.
Some low-deductible buyers are right
There is one more complication. People differ in how likely they are to claim, and they know things about themselves that insurers do not. Alma Cohen and Liran Einav, in a 2007 study of car insurance deductible choices in the American Economic Review, modelled differences in both risk and risk aversion across drivers.
They found large differences in attitudes to risk, and that the people who were more risk averse also tended to be higher risk. For some of the customers who chose low deductibles, the claim rate was well above average, and the expected-value arithmetic based on an average driver understates what the extra cover was worth to them.
That does not rescue the average choice. It does mean that the right comparison is with your own likely claim rate, not with the average, and that people who know they have more small accidents than most can reasonably buy more cover.
When a low deductible makes sense
None of this means everyone should choose the highest deductible. The expected-value calculation assumes you can pay the deductible without hardship. Many households cannot.
The Federal Reserve’s survey of household economic well-being asks what people would do if faced with an unexpected $400 expense. In the 2024 survey, 63% of adults said they would cover it entirely with cash or its equivalent. The rest would borrow, sell something, or could not pay at all.
For a household in that second group, a $1,000 deductible is not a modest risk. It may mean a credit card balance at a high interest rate, a missed rent payment, or a car that stays unrepaired. Paying extra for a lower deductible is expensive insurance, but it can still be cheaper than those alternatives. The research on over-insurance is mostly about households for whom that is not the constraint.
There is also experimental evidence that the bias is less universal than the field data suggest. In a controlled experiment reported in 2020, Howard Kunreuther and Mark Pauly found no strong bias toward low-deductible health plans. Only slightly more than half of participants chose the low deductible when it was the better option, and many stuck with whichever plan was presented as the default.
Could you pay an unexpected $400?
US adults, 2024.
Board of Governors of the Federal Reserve System, Economic Well-Being of U.S. Households in 2024, May 2025.
The small-claim problem
There is another reason a very low deductible can be worth less than it seems: many people would not claim for a small loss anyway.
Claims are recorded in shared industry databases such as the Comprehensive Loss Underwriting Exchange, which in the United States holds up to five years of claims history on a property. A consumer advocacy summary of a 2014 industry analysis reported that a single home insurance claim raised premiums by an average of 9% nationally, and by as much as 32% in one state.
Those figures come from a comparison of quoted premiums rather than peer-reviewed research, and they will vary by insurer and by the kind of claim. But the direction is well established: a small claim can cost more in future premiums than it pays out. A policyholder who expects to absorb small losses rather than claim them gains little from a deductible below the level at which they would actually file.
What one home insurance claim did to premiums
Average premium increase after a single claim, United States, 2014 analysis.
insuranceQuotes analysis, 2014, as summarised by United Policyholders. Industry comparison of quoted premiums, not peer-reviewed research.
What the evidence does not show
It does not show that low deductibles are always a mistake. For households without savings to cover a deductible, paying more for a lower one can be reasonable.
It does not show which explanation is right for everyone. Probability weighting fits some car and home data best; limited consideration of the options fits the same kind of data with ordinary risk aversion; loss aversion fits warranty choices better; defaults matter in experiments.
It does not give a universal claim rate. The 8.8% figure is an average for one insurer’s customers in one line of cover. Your own chance of a claim depends on where you live, what you insure and how you drive.
And the premium penalty for claims varies widely. The 9% figure is an old industry average, not a rule.
Questions people ask
Is a higher deductible better?
On average, lowering a deductible from $500 to $250 cost about three times its expected value in one large car insurance data set, while moving from $1,000 to $500 was close to fair. Whether a higher deductible suits you depends on whether you could pay it without hardship.
Why do most people choose low deductibles?
Research points to overweighting small probabilities, so that a small chance of a claim feels bigger than it is, and to people not comparing the full menu of options. Mental accounting and loss aversion play a part in some products.
How do I compare deductible options?
Compare the extra premium with the deductible difference multiplied by your realistic chance of making a claim in a year. If the premium difference is much larger, the lower deductible is expensive cover.
Does making a small claim raise premiums?
Often. An industry analysis found an average 9% increase after a single home insurance claim, with wide variation by state and insurer.
What about extended warranties?
Studies suggest people pay well above expected repair costs for them, with loss aversion a major reason. The same comparison of price against expected value applies.
The short version
- In one data set of 111,894 car insurance choices, cutting the deductible from $500 to $250 cost $66 a year on average, for cover worth about $22.
- Moving from $1,000 to $500 cost about $49, close to its expected value of $44.
- In flood insurance, over 94% of households chose one of the two lowest deductibles.
- Overweighting small probabilities explains these choices better than ordinary risk aversion.
- For the 37% of US adults who could not cover $400 with cash, a lower deductible can still be sensible.
This article summarises published research on insurance choices. It is not financial or insurance advice, and nothing here recommends a particular policy, insurer or deductible. Terms, prices and claim rules differ by insurer and by country; check your own policy, and consider speaking to a licensed adviser before changing cover.
Further reading. Sydnor, ‘(Over)insuring Modest Risks’, American Economic Journal: Applied Economics, 2010, is the paper that set out the puzzle. Barseghyan and colleagues, ‘The Nature of Risk Preferences: Evidence from Insurance Choices’, American Economic Review, 2013, is the main test of explanations.
- Nudge: The Final Edition, Richard Thaler and Cass Sunstein (2021). The updated edition of the book on defaults and choice design, which is how insurers present deductible menus.
- Noise, Daniel Kahneman, Olivier Sibony and Cass Sunstein (2021). On variability in judgment, with an extended case study from an insurance company’s underwriters.
- How to Decide, Annie Duke (2020). A practical guide to weighing probabilities and payoffs, the calculation most people skip when they choose a deductible.
Sources
- Sydnor J. (Over)insuring modest risks. American Economic Journal: Applied Economics, 2010;2(4):177–199. doi:10.1257/app.2.4.177.
- Barseghyan L, Molinari F, O’Donoghue T, Teitelbaum JC. The nature of risk preferences: evidence from insurance choices. American Economic Review, 2013;103(6):2499–2529. doi:10.1257/aer.103.6.2499.
- Barseghyan L, Coughlin M, Molinari F, Teitelbaum JC. Heterogeneous choice sets and preferences. Econometrica, 2021;89(5):2015–2048. doi:10.3982/ECTA17448 (including online appendix summary statistics).
- Barseghyan L, Molinari F, Thirkettle M. Discrete choice under risk with limited consideration. American Economic Review, 2021;111(6):1972–2006. doi:10.1257/aer.20190253.
- Cohen A, Einav L. Estimating risk preferences from deductible choice. American Economic Review, 2007;97(3):745–788. doi:10.1257/aer.97.3.745.
- Collier BL, Schwartz D, Kunreuther HC, Michel-Kerjan EO. Risk preferences in small and large stakes: evidence from insurance contract decisions. National Bureau of Economic Research working paper 23579, 2017. doi:10.3386/w23579.
- Kunreuther H, Pauly M. Do people have a bias for low-deductible insurance? National Bureau of Economic Research working paper 26994, 2020. doi:10.3386/w26994.
- Fels M. Mental accounting, access motives, and overinsurance. Scandinavian Journal of Economics, 2020;122(2):675–701. doi:10.1111/sjoe.12336.
- Jindal P. Risk preferences and demand drivers of extended warranties. Marketing Science, 2015. doi:10.1287/mksc.2014.0879.
- Schindler RM. Consumer motivation for purchasing low-deductible insurance. Working paper, Rutgers University.
- Board of Governors of the Federal Reserve System. Economic Well-Being of U.S. Households in 2024. May 2025.
- United Policyholders. CLUE report: this surprising database can drive up your homeowners insurance premiums (summarising an insuranceQuotes analysis, 2014).