Horse riding injuries, helmets and the kick on the ground
Key takeaways · 10 min read
- Around two thirds of US riding injuries happen while mounted, mostly in falls, and on the ground kicks lead.
- A 1985 book chapter is the source of the famous claim that riding is more dangerous than motorcycling.
- Overall emergency visits fell, but they rose by 140% among people over 60.
- Helmets are consistently linked to less brain injury, whereas air vests have not shown protection.
In June 2024 Princess Anne, then 73, spent five nights in a Bristol hospital with concussion and minor injuries after an incident on her estate; she had not been riding at the time. Her doctors said the injuries were consistent with a blow from a horse’s head or legs. It was an unusually public example of a risk riders know well and outsiders rarely think about: a horse can hurt you when you are standing beside it.
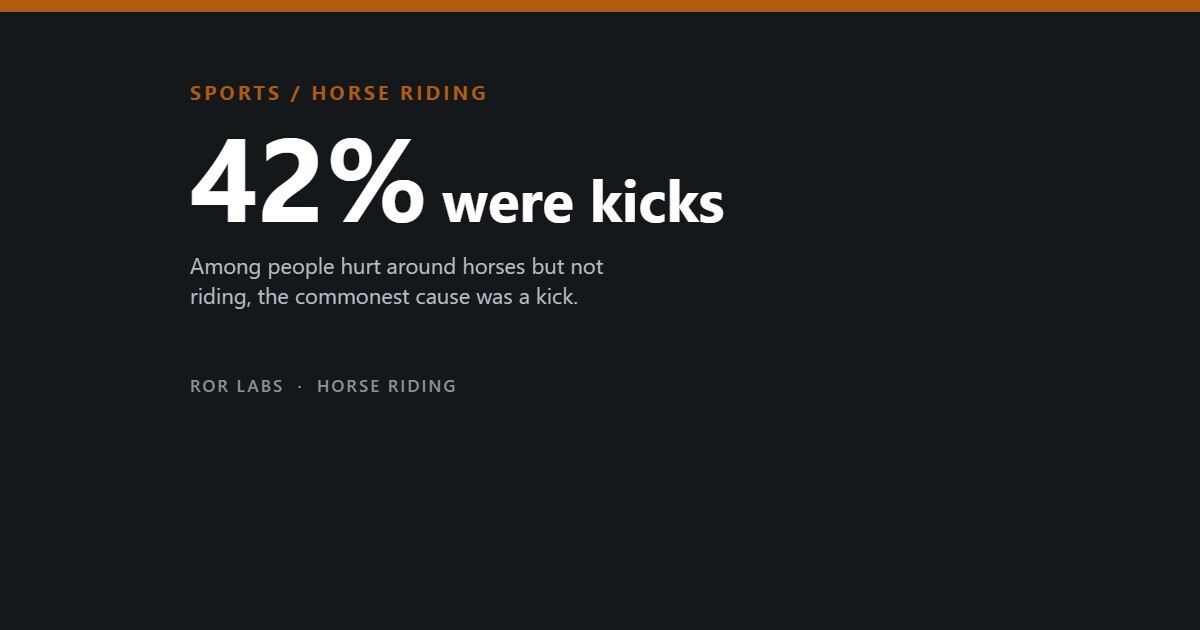
A study of US emergency departments from 1990 to 2017 found that the commonest cause among people hurt while not mounted was being kicked, at 42.1%, and among those hurt while riding it was falling or being thrown, at 73.9%. These two mechanisms, the fall and the kick, explain most of equestrian injury. Both are shaped by habits riders can change, and one of the best-known claims about riding’s danger turns out to rest on very little.
This article covers what riders actually injure, where the risk concentrates, what has been measured to reduce it, and why the answer is not to stay out of the saddle.
What actually gets injured
The best national estimate comes from the US Consumer Product Safety Commission’s sample of hospitals. From 2001 to 2003, an estimated 102,904 people a year were treated in emergency departments for non-fatal horse-related injuries, 35.7 per 100,000 people. Two thirds (66.1%) were hurt while mounted. The head and neck took 23.2% of injuries, the lower limb 22.2% and the upper limb 21.5%. More than 11% were admitted or transferred, and the authors estimated about 11,500 traumatic brain injuries a year.
How riders get hurt
Main mechanism of injury in US emergency departments, 1990–2017, by whether the person was riding.
Source: Acton et al., American Journal of Emergency Medicine 38(6):1062–1068 (2020); Thomas et al., British Journal of Sports Medicine 40(7) (2006).
Over a longer window the numbers moved. US emergency departments saw an estimated 1.84 million horse-related visits from 1990 to 2017, about 65,600 a year. Visits fell by 46% from 2000 to 2017, but the annual rate among people over 60 rose by 139.6%, and diagnoses of concussion and closed head injury rose by 337% from 1990 to 2009.
Trauma centres see more serious injuries with a different shape. In US national trauma data from 2007 to 2016, covering 24,791 patients, the chest was the commonest injured region, and head and neck injuries accounted for three quarters of the 320 deaths. A German trauma centre found falls caused 67.7% of injuries and kicks 16.5%; the head was the most often injured region, and a head injury multiplied the odds of admission about sixfold. In Australia, equestrian activities caused nearly 2,100 hospital admissions in 2024–25, more than half of them fractures, with the 15-to-19 age group the largest.
When the risk concentrates
Riding is often said to be more dangerous per hour than motorcycling, so the claim is worth tracing. A CDC report in 1990 stated that the rate of serious injury per riding hour was estimated to be higher than for motorcyclists and car racers, citing a single book chapter from 1985. That chapter is the root of a figure repeated for forty years, and the modern cohort studies that would test it do not exist. One of the few actual per-hour measurements, from young US riders in the 1990s, found 0.6 injuries per 1,000 riding hours. A 2016 analysis argued that for jumping sports, hours are the wrong denominator altogether, because the risk sits in the jump.
Some risk factors are clearer. Young women are the group most often injured in almost every study, which partly reflects who rides: in a review of 71 epidemiological papers, 60 identified young females as the most affected group, and 97% of papers that examined mechanism found a fall from the horse the most common. Experience protects less than people assume. In US Pony Club incident data from 2011 to 2017, less experienced members had more incidents, but the share that were serious was similar at every certification level, from 9.3% to 14.3%. A rider who has ridden for years falls less often but lands just as hard.
In competition the danger lies at the jump. In international eventing from 2008 to 2018, 5.2% of the 190,429 horses that started a cross-country round had a fall, and 89% of falls happened at a fence. Corners carried 2.44 times the odds of a fall of a plain square spread, and brush fences with a ditch 2.02 times. Rotational falls, in which the horse somersaults over the fence and can land on the rider, are the most feared. In British Eventing’s 2023 season, rotational falls were 2% of falls; 89% of riders who fell were unhurt and there were no deaths.
Where eventing falls happen
Odds of a fall at different fence types in international cross-country, compared with a square spread, 2008–2018.
Source: Bennet, Cameron-Whytock and Parkin, Equine Veterinary Journal 55(3):463–473 (2023).
What has been measured to work
Helmets have the most consistent evidence, although almost none of it comes from trials. At a US children’s trauma centre, only 19.7% of injured child riders had a documented helmet. Those who wore one had lower injury severity, less traumatic brain injury (32.4% against 55.3%) and fewer intensive-care admissions, and going without a helmet independently predicted brain injury, with an odds ratio of 2.5. At a Canadian trauma centre, only 9% of seriously injured riders had worn a helmet. Not every study agrees: in 53 severe cases among Western-style riders at a rural centre, helmets were linked only to fewer superficial injuries. Most of the evidence still points one way.
Helmets: who wears them, and what they did
Observational studies; none of these is a randomised trial.
Helmet documented: only 19.7%
Brain injury: 32.4% with vs 55.3% without
No helmet, adjusted odds of brain injury: 2.5x
Short et al., 2017
Always wear a helmet, English style: 92.5%
Western style: 23.3%
Western riders reported more repeat head injuries
Picken et al., 2025
Source: Short et al., Journal of Pediatric Surgery (2017); Picken et al., Clinical Journal of Sport Medicine (2025).
Helmet habits differ sharply by riding style. Among 357 college riders, 92.5% of English-style riders always wore a helmet, against 23.3% of Western-style riders, and Western riders reported more repeat head injuries. Standards are tightening too: under the international federation’s rules, from 2028 competition helmets will have to meet at least two of four recognised standards. Beyond helmets the evidence becomes uncertain. In Pony Club data, foam body protectors were linked to lower injury risk in cross-country, a relative risk of 0.64, but not on the flat or in showjumping. Air vests, which inflate when the rider leaves the saddle, were linked to higher injury rates in studies of real falls, and in international eventing riders wearing them had 1.7 times the odds of serious injury, possibly because riders choose them for riskier courses, but in any case this is not evidence that they protect. Frangible fences, designed to collapse when hit, have the same problem: they are fitted to the riskiest fences, so their fall rates are higher, and the data cannot yet say how much they help.
Protective gear beyond the helmet
Observational estimates from Pony Club and international eventing. Above 1.00 means more risk.
Source: Andres et al., BMJ Open Sport & Exercise Medicine (2018); Nylund, PhD thesis, University of Sydney (2026); Bennet et al., Equine Veterinary Journal (2023); TRL report CPR4141 (2024). All subject to selection effects.
Far less research covers the kick on the ground than the fall from the saddle. No study has tested a way to reduce kicks; the evidence only shows their scale: kicks are the leading cause of injuries to people who are not riding, and kicked patients in the German series were more likely to need surgery. Time spent around horses in the yard is not free of risk, and the older riders and handlers whose emergency visit rates rose while everyone else’s fell are the obvious group to think about it.
Why the answer is not to stop
Riding counts as real exercise. In laboratory measurements for a British Horse Society report, general riding required about 3.7 METs, trotting about 5.0 and grooming and saddling about 3.5, all moderate activity by the usual definition. In the same report’s survey of 1,248 riders, 68% rode or did yard work for at least half an hour three times a week, 37% of the women were over 45, and more than 80% said riding made them feel cheerful, relaxed or happy. The society commissioned the report and it relied on self-report, so treat it as a description rather than proof.
Riding as exercise
Energy cost of horse-related activities measured in the laboratory. 3 METs or more counts as moderate activity.
Source: Church et al., The Health Benefits of Horse Riding in the UK, University of Brighton for the British Horse Society (2010).
A therapeutic literature exists too. Two meta-analyses of therapeutic riding and hippotherapy in children with cerebral palsy reached partly different conclusions: one found improvements in posture and balance, the other found short-term benefits on muscle asymmetry but no significant effect on overall motor function with longer programmes. The evidence is moderate for balance and weaker for broader function.
Riding is not safe in the way swimming is safe, but its risk is concentrated in places riders can influence. Wear a certified helmet every time, including on short hacks and Western-style rides, where the habit is weakest. Treat ground work with the same respect as riding, especially with age. In competition, remember that the risk sits at particular fences and that equipment like air vests has not yet shown the protection its buyers expect. The famous comparison with motorcycling is not supported by modern data; the fall and the kick are, and both can be made less likely or less damaging.
What the official pages say about horse riding injuries
The government figures on horse injuries are old, and few pages separate riding from handling horses on the ground. This section sets out what the pages say and flags how old each is. It is general information, not medical advice.
| Source | What it says |
|---|---|
| CDC MMWR (US government), Equestrian injuries (May 25, 1990, stale) | About 30 million US riders. About 92,763 emergency-room visits in 1987–88, with 9.9% hospitalized. 205 riding deaths in 27 states in 1976–87, with head injury in over 60%. One earlier study found fewer than 20% of fallen riders wore helmets. The report does not separate riding from ground handling. |
| CDC MMWR (US government), Oklahoma brain injuries, 1992–94 (Mar. 15, 1996, stale) | Of 9,409 brain injuries, 109 (1.2%) were riding-associated, including 3 deaths. Of 105 with a known mechanism, 100 (95%) were head strikes after a fall and 4 (4%) a kick or roll after a fall. Separately, 23 horse-related injuries were not associated with riding: 21 (91%) were direct kicks to the head, 13 (57%) involved children aged 10 or younger, and 15 of 19 with a known location were on farms; one died. The report recommends ASTM-standard helmets and borrows an 88% reduction figure from bicycle-helmet research, not measured for horses. |
| CDC NIOSH (US government), Horse racing safety (content from 2009) | In the racing industry, over 14,000 emergency-room-treated work injuries in 1998–2006 and 79 worker deaths in 1992–2006. Safety vests protect against kicks to the abdomen. |
| Stanfill et al., Concussion 2020 (journal, non-government; hosted on NIH PubMed Central), Survey of adult riders (2020) | Of 2,598 adult riders, about 75% say they always wear a helmet and 53.2% reported a head injury while riding. Only 4.8% of those who fell in their current helmet replaced it. The authors say ASTM/SEI helmets are associated with about 30% fewer head injuries and 50% fewer severe ones; that is a second-hand claim we did not trace to the underlying study. |
| US Consumer Product Safety Commission (US government), “Which Helmet for Which Activity” brochure (code 052022, about May 2022) | Lists equestrian helmets under ASTM F1163 and Snell E2021 and says standards for non-bike helmets are voluntary. It does not describe what the standards require. |
| Public Health Agency of Canada (Canadian government), Traumatic brain injuries across the life course (Nov. 19, 2020) | Equestrian activity is a notable cause of emergency-department concussion among females, with injuries noted at ages 10–14. No equestrian rates in the part we read. |
| British Horse Society (non-government), Statistics sheet (Mar. 2026) | 2025 BHS-reported road incidents: 2,810 incidents, 59 horses killed, 82 horses injured and 86 people injured. Hospital Episode Statistics for 2024–25 show 2,516 episodes for riders or animal-drawn-vehicle occupants injured in transport accidents. No non-road, helmet, kick or ground-handling figures. |
| Health and Safety Executive (UK government), Horse riding (page shows Jan. 20, 2026) | A general safety message and a list of qualifications, with no techniques, kick advice or statistics. The HSE livestock page (Nov. 20, 2024) covers cattle only. |
| Our comparison | The 1990 and 1996 CDC figures describe a different era of helmets and reporting, and the only page that separates kicks on the ground from riding falls is a single Oklahoma report. We have not combined the figures. |
We could not confirm any post-2000 CDC or NIH national totals for horse injuries or deaths, a page other than the 1996 Oklahoma report that cleanly separates mounted from ground-handling injuries, the study behind the 30% and 50% helmet claim (the page was blocked by a CAPTCHA), an NHS or MedlinePlus page on horse riding, British Horse Society figures for non-road incidents, USEF material, or ASTM’s own description of its helmet standard. Figures were read through automated page fetches, so confirm exact numbers on the live pages.
What to do
Steps sorted by when they matter. Each one says how strong the evidence is: Measured Official advice Untested
Before
- Wear a certified helmet every time, including short hacks and Western-style rides. Riding without one independently predicted brain injury, odds ratio 2.5. Measured see Sources
If it happens
- Treat ground work with the same respect as riding, especially with age. Kicks are the leading cause of injuries to people who are not riding. Measured see Sources
Afterwards
- Get urgent medical assessment for a head injury with confusion, vomiting or worsening headache, and be cleared by a doctor before riding again. Official advice see Sources
What not to do
- Do not assume an air vest protects you. Riders wearing them had 1.7 times the odds of serious injury in international eventing. Measured see Sources
Questions people ask
Is horse riding more dangerous than motorcycling?
The claim traces to a 1985 book chapter cited by the CDC in 1990. No modern study has confirmed it, and hours may be the wrong way to compare.
What is the most common horse riding injury?
Falls cause most injuries while riding; kicks cause the largest share of injuries on the ground. Head, limb and chest injuries are all common.
Do riding helmets work?
Observational studies consistently link helmets to less brain injury and lower severity, although there are no randomised trials.
Do air vests prevent riding injuries?
Not on current evidence. Studies of real falls link them to higher injury rates, probably partly because riders choose them for riskier courses.
Is horse riding good exercise?
Yes. Riding and yard work reach moderate-intensity levels, and trotting is higher.
The short version
- Around two thirds of US riding injuries happen while mounted, mostly in falls, and on the ground kicks lead.
- A 1985 book chapter is the source of the famous claim that riding is more dangerous than motorcycling.
- Overall emergency visits fell, but they rose by 140% among people over 60.
- Helmets are consistently linked to less brain injury, whereas air vests have not shown protection.
- Riding and yard work are moderate exercise; wear a certified helmet every time, and respect the ground as much as the saddle.
This is a summary of published research, not medical advice. Any head injury with confusion, vomiting or worsening headache needs urgent medical assessment, and a suspected concussion should be cleared by a doctor before riding again.
Further reading: Acton et al., American Journal of Emergency Medicine 38(6):1062–1068 (2020), for the US emergency data. Bennet et al., Equine Veterinary Journal 55(3):463–473 (2023), for eventing falls. Our article on skiing and helmets covers what a helmet can and cannot do in another fall sport.
Sources
- CBC News, 24 and 28 June 2024, on Princess Anne’s injury.
- Acton AS, Gaw CE, Chounthirath T, Smith GA. American Journal of Emergency Medicine 38(6):1062–1068 (2020).
- Thomas KE, Annest JL, Gilchrist J, Bixby-Hammett DM. British Journal of Sports Medicine 40(7) (2006).
- Mutore K, et al. Trauma Surgery & Acute Care Open 6(1):e000728 (2021).
- Krüger L, Hohberg M, Lehmann W, Dresing K. BMJ Open Sport & Exercise Medicine 4(1):e000408 (2018).
- Australian Institute of Health and Welfare. Sports Injury in Australia: Equestrian activities (2026).
- Centers for Disease Control and Prevention. MMWR 39(20) (1990), citing Firth JL, in Schneider RC et al., eds., Sports Injuries, Williams & Wilkins (1985).
- Christey GL, et al. Pediatrics (1994).
- O’Brien D. Animals 6(2):13 (2016), doi:10.3390/ani6020013.
- Meredith L, Ekman R, Brolin K (2019), doi:10.46743/1540-580x/2019.1795.
- Andres SA, et al. BMJ Open Sport & Exercise Medicine 4(1):e000426 (2018).
- Bennet ED, Cameron-Whytock HA, Parkin TDH. Equine Veterinary Journal 55(3):463–473 (2023), doi:10.1111/evj.13863.
- Bozorg S. British Eventing Falls Database: 2023 season. TRL report CPR4141 (2024).
- Short SS, Fenton SJ, Scaife ER, Bucher BT. Journal of Pediatric Surgery (2017), doi:10.1016/j.jpedsurg.2017.03.043.
- Ball CG, Ball JE, Kirkpatrick AW, Mulloy RH. American Journal of Surgery (2007), doi:10.1016/j.amjsurg.2007.01.016.
- Carter BT, Richardson MD. Journal of Neurosciences in Rural Practice (2022), doi:10.25259/jnrp-2022-3-14.
- Picken LK, et al. Clinical Journal of Sport Medicine (2025), doi:10.1097/JSM.0000000000001400.
- Equestrian Australia. Progressive change to helmet standards, 4 February 2026.
- Meyer C, et al. Annals of Biomedical Engineering (2024), doi:10.1007/s10439-024-03507-y.
- Nylund LE. PhD thesis, University of Sydney (2026).
- Church A, Taylor B, Maxwell N, Gibson O, Twomey R. The Health Benefits of Horse Riding in the UK. University of Brighton and Plumpton College for the British Horse Society (2010).
- Zadnikar M, Kastrin A. Developmental Medicine & Child Neurology (2011), doi:10.1111/j.1469-8749.2011.03951.x.
- Tseng SH, Chen HC, Tam KW. Disability and Rehabilitation (2013), doi:10.3109/09638288.2012.687033.
- CDC MMWR 1990, equestrian injuries; CDC MMWR 1996, Oklahoma brain injuries; CDC NIOSH, horse racing safety; Concussion 2020, rider survey (journal, non-government); British Horse Society statistics (non-government); HSE, horse riding.