Do Protests Work? What the Evidence Shows
Key takeaways · 11 min read
- By the best-known count, nonviolent campaigns succeeded about twice as often as violent ones from 1900 to 2006.
- As governments adapted, the success rate fell from 65% in the 1990s to 34% in the 2010s.
- A 2026 replication disputes how robust the nonviolent advantage is, and the debate is open.
- Violence by protesters tends to move public opinion towards order, while nonviolence that meets repression tends to win sympathy.
In this article
- The finding that shaped a generation of activism
- The 3.5% idea, and its limits
- The success rate fell
- A replication that challenges the finding
- Why some movements win
- What protests do to public opinion
- Recent cases: Kenya, Bangladesh and England
- The personal risks of taking part
- What the official pages say about protests and their aftermath
- Questions people ask
- The short version
- Sources
Millions of people march, sit in, strike and block roads each year to change something about how they are governed. Some protests topple governments within weeks. Others fill the streets for months and achieve nothing. A few turn violent, and the violence is often all anyone remembers.
Two questions matter to anyone deciding whether to join a protest, or trying to make sense of one on the news. Do protests actually work? And does it matter whether they stay peaceful? For more than a decade one answer dominated: nonviolent campaigns succeed about twice as often as violent ones. That finding shaped activist training around the world.
Then the evidence got messier. The success rate of nonviolent movements fell sharply in the 2010s, a 2026 replication argued that the famous advantage is weaker than it looked, and public-opinion studies show that disruptive tactics can win attention while losing sympathy. This article covers what the research found, where it is disputed, and what risks participants face.
The finding that shaped a generation of activism
In 2008, Maria Stephan and Erica Chenoweth published an article in International Security titled ‘Why Civil Resistance Works’, followed by a book of the same name in 2011. They assembled a dataset of major campaigns from 1900 to 2006 that aimed to overthrow a government, end a foreign occupation or achieve independence, each with at least 1,000 participants.
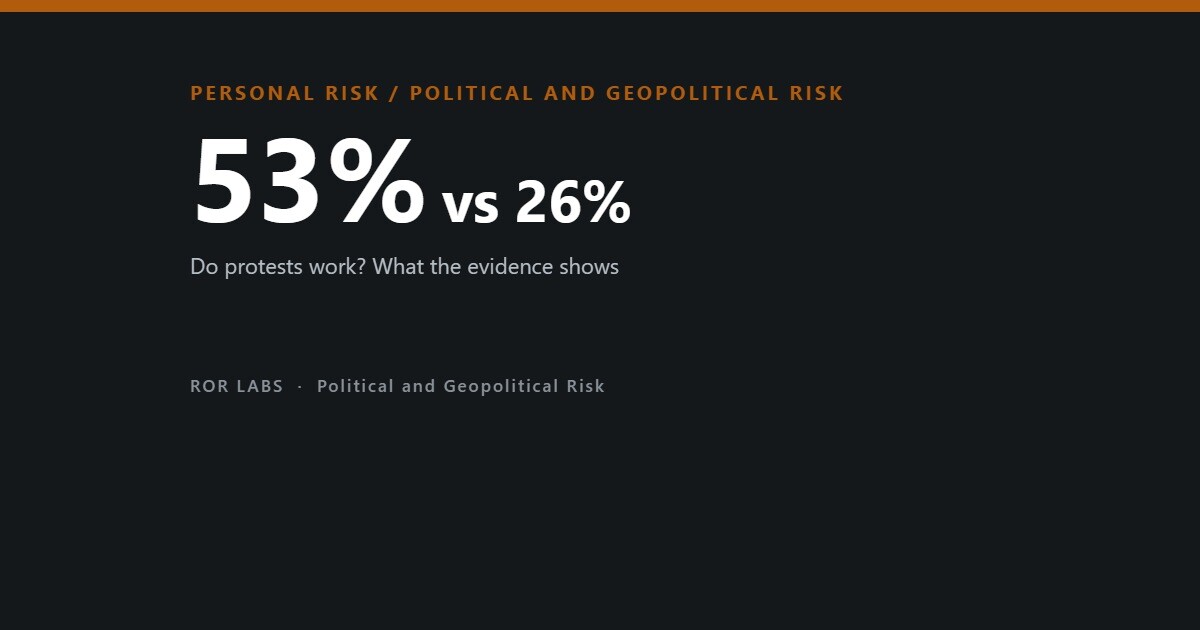
The headline result was striking: nonviolent campaigns achieved full or partial success in 53% of cases, against 26% for violent campaigns, roughly twice as often. The authors argued that nonviolent movements succeed because they can attract far more participants from every part of society, which makes the regime’s job of repression harder and makes it more likely that soldiers, police and officials will refuse orders or switch sides.
The results varied by goal. Nonviolent campaigns against a regime were the most successful, with close to 60% ousting the incumbent. Campaigns against foreign occupation succeeded far less often, and nonviolent campaigns for secession almost never did.
Nonviolent and violent campaigns, 1900–2006
Share of major resistance campaigns that achieved full or partial success.
Stephan MJ, Chenoweth E, International Security, 2008;33(1):7–44; Chenoweth E, Stephan MJ, Why Civil Resistance Works, 2011.
The 3.5% idea, and its limits
Chenoweth later popularised an observation from the data: no campaign that had mobilised at least 3.5% of a country’s population at its peak had failed. Climate and democracy movements quickly adopted it as a target.
Chenoweth herself has since stressed the caveats, in a 2020 discussion paper for Harvard’s Carr Center. The figure was a historical observation and no law. Few cases reached 3.5%, participation is hard to measure, and several movements have since passed the threshold without winning. The number describes what successful movements looked like and offers no guarantee of success. It also says nothing about the smaller, local protests that make up most real-world activism.
The success rate fell
Chenoweth’s own updated data held the bigger surprise. In a 2020 article in the Journal of Democracy, she reported that nonviolent campaigns were more common than ever but much less successful. Other researchers later summarised the drop as a fall in the success rate from 65% in the 1990s to 34% in the 2010s.
She offered several explanations. Governments have learnt to respond with surveillance, targeted arrests, disinformation and their own counter-mobilisation. Many modern movements gather quickly through social media but lack the organisation, discipline and long-term strategy of earlier campaigns. Fewer foreign governments, too, now put pressure on regimes that repress their citizens.
Nonviolent campaigns became less successful
Share of major nonviolent campaigns that succeeded, by decade.
Chenoweth E, Journal of Democracy, 2020;31(3):69–84, as summarised by Sombatpoonsiri J, Journal of Peace Research, 2023.
A replication that challenges the finding
In 2026 the political scientists Charles Crabtree and John Holbein released a replication and extension of the original analysis. They reported that some results had been misreported in ways that made the data look more favourable to civil resistance, that the findings did not hold up under modest and reasonable changes to the statistical model, and that the instrumental variable models rested on implausible assumptions.
Their conclusion was careful. They did not argue that nonviolence backfires or that violence works better. They argued that the cross-national data give no clear basis for calling nonviolent campaigns substantially more effective than violent ones. The paper is a preprint and has not been through peer review, and Chenoweth and others may respond. Still, one dataset, however influential, does not make a settled fact.
All studies of this kind also face a deeper problem: movements choose their tactics. Groups that expect to win by mass mobilisation may choose nonviolence, while groups that are small, persecuted or fighting a brutal occupation may see no alternative to arms. If the conditions that favour success also favour nonviolence, comparing outcomes cannot fully separate the effect of the tactic from the situation.
Where the debate stands
Main studies on whether nonviolent resistance works better.
| Study | Claim |
|---|---|
| Stephan and Chenoweth, 2008 and 2011 | Nonviolent campaigns succeed about twice as often |
| Chenoweth, 2020 | Nonviolent success fell from 65% to 34% between the 1990s and 2010s |
| Orazani and colleagues, 2021 | Nonviolence wins modestly more outside support in experiments |
| Crabtree and Holbein, 2026 (preprint) | The cross-national advantage is not robust |
Sources as listed at the end of this article. The 2026 paper has not been peer reviewed.
Why some movements win
Researchers agree on several features of winning campaigns, whatever the precise success rate. Breadth comes first. Movements that draw in people of different ages, classes, religions, regions and occupations are harder to dismiss as a faction and harder to repress without alienating the whole society.
Defection is the second. Regimes survive on the loyalty of soldiers, police, civil servants and business elites, and Chenoweth and Stephan argued that persuading some of them to stop obeying is the single most important route to success. That is easier when protesters are neighbours, relatives and colleagues rather than armed enemies.
Third, repression can backfire. When security forces attack peaceful crowds, the images can turn public opinion and foreign governments against them, and Wasow’s findings on the 1960s point the same way. There are limits: repression that is swift, hidden or widely supported can crush a movement instead. Fourth is organisation. Campaigns that plan beyond the next demonstration, with alternatives such as strikes and boycotts, tend to last longer than those that rely only on crowds in the street.
What protests do to public opinion
Omar Wasow took another route, studying how protests change what ordinary people think and how they vote. In the American Political Science Review in 2020 he reported on Black-led protests in the United States between 1960 and 1972. Nonviolent protests, especially when met with violent repression by police or vigilantes, drove media coverage and public opinion towards civil rights. Counties near nonviolent protests saw the Democratic share of the presidential vote rise by 1.6 to 2.5 percentage points.
Protester-initiated violence had the opposite effect. It shifted news coverage and public concern towards ‘social control’. Using rainfall as a natural experiment, since rain reduces the chance of unrest, Wasow estimated that violent protests in 1968 likely caused a shift of 1.5 to 7.9 percentage points among white voters towards Republicans, enough to tip that year’s presidential election.
How 1960s protests moved voters
Estimated effects on the US presidential vote.
| Protest type | Effect on vote |
|---|---|
| Nonviolent, nearby counties | Democratic share up 1.6–2.5 points |
| Protester-initiated violence, 1968 | White voters shifted 1.5–7.9 points to Republicans |
Wasow O, American Political Science Review, 2020;114(3):638–659.
On average, laboratory and survey experiments point the same way, with smaller effects than the historical studies suggest. A 2021 meta-analysis in the European Journal of Social Psychology by Nima Orazani and colleagues combined 16 studies with 4,598 participants. Nonviolent tactics produced a small to moderate increase in support from outsiders (a standardised effect of 0.25), while violent tactics did not significantly change willingness to help compared with a baseline. The authors also found signs of publication bias: published studies showed larger effects than unpublished ones.
Emma Thomas and Winnifred Louis found a similar pattern among people who already sympathised with a cause. In two experiments published in 2014, nonviolent action did more than violent action to convince sympathisers that the grievance was legitimate and the group could succeed. But when participants were told the authorities were corrupt, that advantage shrank and support for more extreme action rose.
Disruptive but nonviolent tactics sit in between. A 2026 review in PNAS Nexus by Clara Vandeweerdt found that blockades, strikes and sit-ins generally make people dislike the group and its tactics, and perhaps its specific demand. They also generate far more media attention than conventional marches, and effects on concern about the underlying issue are usually null or slightly positive.
Violence, nonviolence and outside support
Meta-analysis of experiments on third-party support for social movements, 16 studies, 4,598 people.
Orazani N, Tabri N, Wohl MJA, Leidner B, European Journal of Social Psychology, 2021;51(4–5):645–658. Published studies showed larger effects than unpublished ones.
Recent cases: Kenya, Bangladesh and England
Three events in 2024 showed how different protest outcomes can be. In Kenya, youth-led protests against a finance bill that would have raised taxes spread nationwide in June; after demonstrators broke into parliament and dozens were killed, President William Ruto withdrew the bill. In Bangladesh, student protests over job quotas grew into a national uprising, and Prime Minister Sheikh Hasina resigned and fled in August. A UN human rights investigation later estimated that as many as 1,400 people may have been killed, most by security forces.
In England, a very different kind of unrest followed the killing of three girls in Southport in July 2024 and false claims online about the attacker’s identity. Riots targeted mosques and hotels housing asylum seekers. More than a thousand people were arrested, and many were charged and sentenced within weeks. For those involved this was the opposite of success, and it fits the Wasow finding: violence moved the public conversation towards order and punishment.
The personal risks of taking part
For individuals, protest carries real risks even when the movement is peaceful. The main ones are injury from crowd crushes, from police weapons and from counter-protesters, arrest and its consequences for work, travel and immigration status, and surveillance, including facial recognition and phone location data. We looked at the injuries caused by rubber bullets and tear gas in our article on crowd-control weapons.
The research on campaigns suggests that discipline and numbers protect participants as well as movements, since large, broad, nonviolent crowds are harder to repress and less likely to be framed as dangerous. Sensible steps include knowing the local law on assembly, staying with people you trust, and having a plan to leave if a crowd becomes too dense or a situation turns violent. We covered crowd density in our article on crowd crushes.
Arrest can have consequences lasting years beyond the protest. A charge or conviction may show up in background checks for jobs, affect visa applications and, for people who are not citizens, threaten their right to stay. Legal observers and protest support groups in many countries publish guidance on rights during arrest; it is worth reading before rather than after.
Digital traces are the newest risk: phones reveal location to networks and apps, photos posted online can identify people in a crowd, and some police forces use live facial recognition at large events. Checking what your phone shares, and who appears in your photos, protects others as well as you.
What the official pages say about protests and their aftermath
Official pages record what happened to people and to policing during recent protests; none of the pages we read measures whether a protest achieved its aims. This section sets out the figures from Kenya, Bangladesh and England and flags the gaps. It is general information.
| Source | What it says |
|---|---|
| Kenya National Commission on Human Rights (state constitutional commission, not an NGO), Update on human rights during the anti-Finance Bill protests (July 1, 2024) | For June 18 to July 1, 2024: 39 deaths, 361 injuries, 32 enforced disappearances and 627 arrests. Says the protests began peacefully and turned chaotic from June 25, and calls the force used excessive and disproportionate. |
| Presidency of Kenya, President Ruto declines to sign Finance Bill (June 26, 2024) | Says the President declined to sign the bill and called for its withdrawal after public rejection, proposing a 14-day multi-stakeholder engagement. |
| UN Human Rights Office (OHCHR), Bangladesh protests infographic (created Feb. 7, 2025) | For July 1 to Aug. 15, 2024: as many as 1,400 deaths estimated, against 841 recorded by the Ministry of Health, which is likely incomplete. About 12% were children; 13,529 injuries and 11,702 arrests recorded; 78% of 130 examined deaths were from firearms. OHCHR found reasonable grounds of systematic serious violations by the former government. |
| HMICFRS (UK inspectorate), Police forces must be better prepared (tranche 1) (Dec. 18, 2024) | Eight forces reviewed; forces were not ready for the scale of disorder in summer 2024 and the national mobilisation plan was activated too late. Three recommendations. |
| HMICFRS (UK inspectorate), Police response to public disorder, tranche 2 (figures as of Jan. 22, 2025) | 1,804 arrests, including 147 children, and 1,071 charged. No single cause identified; it points to deprivation, austerity, migration policy and falling trust in policing, and found no conclusive evidence of coordination by any group. We read only the first part of this long report. |
| GOV.UK, Nearly 400 people already jailed (Oct. 10, 2024) | For July 30 to Oct. 3: 819 defendants received by courts, 477 sentenced and 388 jailed. This is a different basis from the HMICFRS arrest counts, so the two sets are not directly comparable. |
We could not confirm a Kenyan National Treasury note on the withdrawal or any OHCHR Kenya statement, a later KNCHR tally (a search snippet showed higher numbers, which we did not verify), the main OHCHR Bangladesh report page (blocked), the text of the UN Human Rights Committee’s General comment No. 37 or other official statements on the right to assemble (blocked), NPCC or Home Office reports, or any official page measuring whether protests work. Figures were read through automated page fetches, so confirm exact numbers on the live pages.
What to do
Steps sorted by when they matter. Each one says how strong the evidence is: Measured Official advice Untested
Before
- Know the local law on assembly, and read legal observers’ guidance on rights during arrest before you go. Official advice see Sources
- Check what your phone shares about your location, and think about who appears in photos you post. Untested see Sources
If it happens
- Stay with people you trust, and have a plan to leave if the crowd becomes too dense or the situation turns violent. Untested see Sources
An arrest can affect jobs, visas and, for non-citizens, the right to stay. Not legal advice.
Questions people ask
Do nonviolent protests work better than violent ones?
A major study found nonviolent campaigns succeeded 53% of the time against 26% for violent ones, from 1900 to 2006. A 2026 replication argues the advantage is not robust.
What is the 3.5% rule?
An observation that no campaign mobilising 3.5% of a population at its peak had failed. It is a historical pattern, not a guarantee, and has since been challenged.
Are protests less successful than they used to be?
Yes. By Chenoweth’s count, the success rate of nonviolent campaigns fell from 65% in the 1990s to 34% in the 2010s.
Does violence at protests backfire?
Often. In the 1960s US, violent protests shifted white voters towards Republicans by an estimated 1.5 to 7.9 points in 1968.
Do disruptive protests hurt their cause?
They tend to make the group unpopular but raise attention to the issue; effects on concern about the issue itself are usually neutral or slightly positive.
The short version
- By the best-known count, nonviolent campaigns succeeded about twice as often as violent ones from 1900 to 2006.
- As governments adapted, the success rate fell from 65% in the 1990s to 34% in the 2010s.
- A 2026 replication disputes how robust the nonviolent advantage is, and the debate is open.
- Violence by protesters tends to move public opinion towards order, while nonviolence that meets repression tends to win sympathy.
- For participants, the main risks are crowds, police weapons, arrest and surveillance.
This article summarises published research on protest and civil resistance. It does not take a position on any movement, government or cause mentioned, and it is not legal advice. Laws on assembly and protest differ widely between countries; check them before taking part.
Further reading. Chenoweth, ‘The Future of Nonviolent Resistance’, Journal of Democracy, 2020, and Wasow, ‘Agenda Seeding’, American Political Science Review, 2020, are good places to start.
Sources
- Stephan MJ, Chenoweth E. Why civil resistance works: the strategic logic of nonviolent conflict. International Security, 2008;33(1):7–44. doi:10.1162/isec.2008.33.1.7.
- Chenoweth E, Stephan MJ. Why Civil Resistance Works: The Strategic Logic of Nonviolent Conflict. Columbia University Press, 2011.
- Chenoweth E. The future of nonviolent resistance. Journal of Democracy, 2020;31(3):69–84. doi:10.1353/jod.2020.0046.
- Sombatpoonsiri J. ‘A lot of people still love and worship the monarchy’: how polarizing frames trigger countermobilization in Thailand. Journal of Peace Research, 2023. doi:10.1177/00223433221142932.
- Chenoweth E. Questions, answers, and some cautionary updates regarding the 3.5% rule. Carr Center Discussion Paper, Harvard Kennedy School, 2020.
- Crabtree C, Holbein JB. How strong is the evidence for peaceful resistance? Not very. SocArXiv preprint, 2026. doi:10.31235/osf.io/pbrej_v4.
- Wasow O. Agenda seeding: how 1960s Black protests moved elites, public opinion and voting. American Political Science Review, 2020;114(3):638–659. doi:10.1017/S000305542000009X.
- Orazani N, Tabri N, Wohl MJA, Leidner B. Social movement strategy (nonviolent vs. violent) and the garnering of third-party support: a meta-analysis. European Journal of Social Psychology, 2021;51(4–5):645–658. doi:10.1002/ejsp.2722.
- Vandeweerdt C. The effect of disruptive protests on public opinion. PNAS Nexus, 2026;5(4):pgag082. doi:10.1093/pnasnexus/pgag082.
- Thomas EF, Louis WR. When will collective action be effective? Violent and non-violent protests differentially influence perceptions of legitimacy and efficacy among sympathizers. Personality and Social Psychology Bulletin, 2014;40(2):263–276. doi:10.1177/0146167213510525.
- Office of the UN High Commissioner for Human Rights. Human Rights Violations and Abuses related to the Protests of July and August 2024 in Bangladesh. OHCHR, February 2025.
- KNCHR, update on the Finance Bill protests; Presidency of Kenya, Finance Bill; OHCHR, Bangladesh infographic; HMICFRS, tranche 1; HMICFRS, tranche 2; GOV.UK, people jailed after the disorder.