Older Drivers: What the Evidence Shows
Key takeaways · 13 min read
- Per mile, US fatal crash involvement is below the all-age average until 75 and rises steeply after 80, to 7.9 per 100 million miles at 85 and over against 2.5 overall.
- Part of that rise is the low-mileage bias: people who drive little crash more per mile at any age.
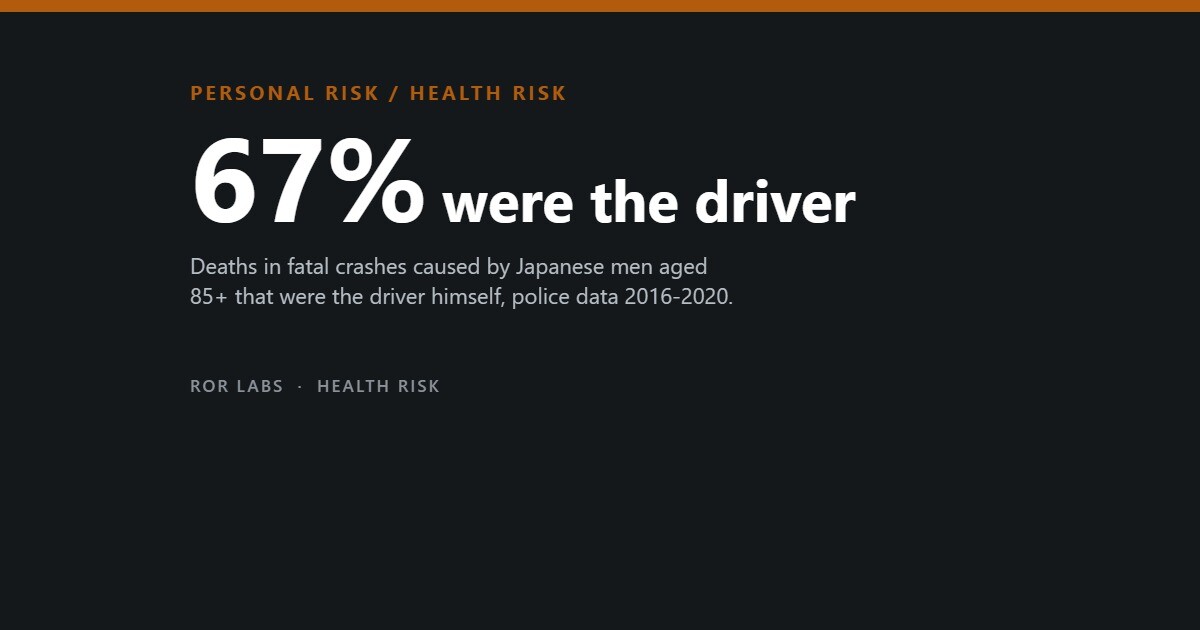
- Fragility drives the death toll: in Japan the at-fault driver was the person killed in 67% of fatal crashes caused by men aged 85 and over, against 31% across all ages.
- Age-based screening has a weak record: retesting in Sydney and cognitive tests in Denmark and Japan (2009) showed no clear fall in crashes.
In this article
- Per mile or per driver: why the denominator matters
- The low-mileage bias
- Fragility: who gets hurt
- Dementia and mild cognitive impairment
- What age-based screening has shown
- Japan’s experiment: tests at 75 and handing back the licence
- The cost of giving up the keys
- Does refresher training help?
- Warning signs, the family conversation and the licence rules
- Questions people ask
- The short version
- Sources
Every few months a crash involving an elderly driver makes the news, and the same question follows: should older people be tested, or told to stop? Reaction times slow, eyesight changes and dementia becomes more common with age. The evidence, though, is less tidy than the headlines, and it depends on how risk is counted.
This article looks at what crash data, cohort studies and policy evaluations show: how risk changes with age, why older people die more often in crashes, what dementia does to driving, and whether age-based tests, Japan’s screening at 75, vision checks and refresher courses have made anyone safer.
The balance runs against the popular story. Per-mile risk climbs steeply only for the oldest and lowest-mileage drivers, many screening schemes have not cut crashes, and giving up the car carries its own health costs. Every figure below is tied to the source that reported it.
Per mile or per driver: why the denominator matters
How risky older drivers look depends on what you divide by. Per head of population they crash less than most groups, because many do not drive. Per licensed driver the picture shifts, and per mile it shifts again, because older people drive fewer miles. Arguments about older drivers often mix these up.
The US Insurance Institute for Highway Safety (IIHS) combines federal crash records with 2022 travel-survey mileage. Per 100 million miles, drivers aged 70–74 had 2.1 fatal crash involvements, below the all-age 2.5. The rate reached 2.8 at 75–79, then 5.3 at 80–84 and 7.9 at 85 and over.
Fatal crashes per mile, by driver age
Passenger-vehicle drivers in fatal crashes per 100 million miles travelled, United States, 2022.
Source: Insurance Institute for Highway Safety, Fatality Facts 2024: Older people (crash data from FARS; mileage from the 2022 National Household Travel Survey).
Japan counts per licence holder. Using national police data for 2016–2020, Masao Ichikawa and colleagues found that at-fault collisions per 100,000 male licence holders rose after middle age, from 506 at 40–44 to 661 at 85 and over. Men aged 18–19 were far higher, at 1,811.
At-fault collisions per licence holder, Japan
At-fault collisions per 100,000 male licence holders per year, by age, 2016–2020.
Source: Ichikawa, Inada and Nakahara, Journal of Epidemiology (2024), Table 1, national police-reported collisions.
The authors note that counting per licence holder may understate older drivers’ risk per kilometre, because they drive less. Per-mile figures carry a distortion of their own.
The low-mileage bias
Drivers who cover few miles crash more per mile, whatever their age. Their miles are short trips on busy streets full of junctions, while high-mileage drivers pile up motorway miles where crashes per kilometre are rare. Comparing low-mileage older drivers with commuters per mile partly compares town with motorway driving. Researchers call this the low-mileage bias.
Studies matching drivers by annual distance found most older drivers as safe as younger ones. Loren Staplin and colleagues showed that people misreport mileage; when Jim Langford’s team reworked an early dataset with odometer readings, the bias shrank but remained. A 2017 analysis of US naturalistic driving data, from instrumented cars, found significantly higher crash rates among drivers aged 65 and over who drove under about 3,000 miles a year.
A quarter of those 802 older drivers fell below that line. Low mileage is partly a marker of decline: travel surveys analysed by Langford and Sjaan Koppel suggested low-mileage older drivers were more likely to have reduced fitness to drive. That points towards assessing individuals, not birthdays.
Fragility: who gets hurt
Older bodies break more easily. Guohua Li and colleagues found that US drivers aged 80 and over had death rates per mile about 13 times those of drivers aged 30–59. Fragility, measured as deaths per driver in a crash, began rising at 60–64 and explained about 60–95% of older drivers’ excess death rate per mile; excess crashing explained no more than about 30–45%.

Police data from Western Australia agree. Drivers over 70 had serious injury rates more than twice those of drivers aged 30–59, and fragility contributed 47–95% of the excess for drivers above 65. The exception was men over 80, for whom crashing more often was the bigger factor. The IIHS summarises the US evidence the same way.
Japanese data show who bears the cost. In fatal crashes caused by male drivers of all ages, the at-fault driver was 31% of those killed. That share rose to 53% at 75–79 and 67% at 85 and over, while pedestrians fell from 38% of the dead to 11%. Older drivers did hit cyclists and pedestrians more often than middle-aged drivers, but injuries to others per crash were not markedly higher.
Who dies when an older man causes a fatal crash
Share of all deaths that were the at-fault driver himself, fatal crashes caused by male drivers, Japan, 2016–2020.
Source: Ichikawa, Inada and Nakahara, Journal of Epidemiology (2024), Table 3.
If most of the danger in older driving falls on older drivers and their passengers, the case for removing licences to protect others is weaker than it looks.
Dementia and mild cognitive impairment
Dementia is where the worry has firm footing. A 2017 international meta-analysis led by Justin Chee pooled nine studies with 378 people with dementia and 416 controls. People with dementia were about ten times as likely to fail an on-road test (risk ratio 10.77), and even mild dementia carried substantially higher risk.
Crash data are less clear-cut, partly because people with dementia drive less. In the same review one study found four times as many reported crashes per mile, another no significant increase. In Iowa, drivers with dementia who kept their licence after a review had crash risk similar to other referred drivers.
Mild cognitive impairment (MCI) is harder to call. In a Canberra study of 302 drivers aged 65–96, the 57 with MCI scored lower on a road test (5.61 against 6.05), but scores varied widely in both groups. In a Washington State cohort of 2,615 licensed drivers without dementia, each one-unit lower cognitive score was linked to a 26% higher crash rate over about seven years.
Cognition, not age, carries the signal, and a single cut-off sorts people poorly. Our article on modifiable risk factors for dementia covers what the Lancet Commission says can be changed.
What age-based screening has shown
Many countries test drivers once they pass a set age. Evaluations have rarely found a safety gain. Langford and colleagues compared Melbourne, which had no mandatory assessment, with Sydney, where drivers were reassessed from 80. Per licence issued, Sydney drivers aged 80 and over had 15% higher casualty crash rates, and per hour driven 19% higher; per kilometre the difference was borderline.
Denmark added a cognitive test to age-based screening. Anu Sirén and Annette Meng found no significant change in older drivers’ fatal crashes, but a significant rise in older, though not younger, unprotected road users killed, as expected if former drivers switched to walking or cycling. In the US, Brian Tefft’s analysis of 46 states over 1986–2011 found road tests and knowledge tests at renewal were not linked to fewer fatal crashes.
One thing did show up. In Tefft’s data, in-person renewal was linked to 31% lower fatal crash involvement among drivers aged 85 and over, and a vision test where renewal was remote to 36% lower. After Florida required a vision report from remote renewers aged 80 and over, their fatal crashes fell 17%.
Renewal rules that showed an effect
Change in fatal crash involvement of the oldest drivers after a rule was introduced, United States.
Source: Tefft, Injury Epidemiology (2014), 46 states, 1986–2011; Florida result from McGwin and colleagues as summarised by Tefft.
Tefft cautions that the mechanism is unknown: staff may spot frail drivers, or people may simply not renew. In Florida, 20% of those eligible did not try to renew under the vision rule. A study of 13 states over 2000–2019 found that loosening in-person renewal was linked to an 18% higher injury rate among drivers aged 75 and over, at the edge of statistical significance.
Britain is now weighing the question. In January 2026 the government opened a consultation, closed on 31 March, on mandatory sight tests at renewal for drivers aged 70 and over, whose numbers rose 60% between 2012 and 2025, to 6.3 million.
Japan’s experiment: tests at 75 and handing back the licence
Japan has gone further than most. Lessons at renewal became compulsory for drivers aged 75 and over in 1998 and 70 and over in 2002, and a cognitive screening test for those aged 75 and over followed in 2009. Since 2017 a poor result means seeing a doctor, and dementia leads to revocation; since 2022, drivers aged 75 and over with certain recent violations must also pass a road test.
The evaluations, mostly by Ichikawa’s group, are sobering. Relative collision rates of drivers aged 70 and over did not fall after the lessons began, and the 2009 test showed no apparent effect. After the 2017 tightening, a time-series analysis estimated 3,670 fewer collisions involving drivers aged 75 and over by December 2019, but 959 more pedestrian and cyclist injuries among people aged 70 and over.
The fall in collisions was seen in men, not significantly in women. The authors read the extra injuries as people who stopped driving being exposed on foot and on bicycles: in 2021, 75% of Japan’s pedestrian and cyclist deaths were among people aged 65 and over. Time-series studies cannot prove cause.
Japan also encourages voluntary licence surrender. National Police Agency figures, as reported in December 2024, showed 261,569 surrenders by people aged 75 and over in 2023, down from 350,428 in 2019.
Perception may run ahead of the data. In Japan’s two best-selling newspapers, crashes in which older drivers killed children were reported more often than other drivers’, while those in which they killed only themselves were reported far less.
The cost of giving up the keys
Stopping driving is not a neutral outcome. A 2016 systematic review of 16 studies by Stanford Chihuri and colleagues linked it with declines in health and in physical, social and cognitive function, and with higher risks of entering long-term care and of dying. Pooling five studies, it almost doubled the odds of depressive symptoms (odds ratio 1.91).
The obvious objection is reverse causation: people stop because they are already unwell. In the Japan Gerontological Evaluation Study, Hiroshi Hirai and colleagues adjusted for health, mood and function and excluded people certified for care soon after stopping. Former drivers still developed functional limitations at about twice the rate of current drivers (hazard ratio 2.09).
Functional limitation after stopping driving, Japan
New functional limitations (certified need for long-term care) per 1,000 person-years, adults aged 65 and over, 2010–2016.
Source: Hirai, Ichikawa, Kondo and Kondo, Journal of Epidemiology (2020), JAGES cohort, 2,704 current and 140 former drivers.
Former drivers who used buses, trains or bicycles fared better than those who relied on lifts. Unmeasured confounding remains, the authors note, and Japan’s bus and regional rail passenger numbers fell by 35% and 20% over 25 years.
Does refresher training help?
Classroom refresher courses have a mixed record. In British Columbia, people who chose a mature-driver course were self-selected, and attendance was followed by more crashes among men aged 75 and over, with no effect in other groups. Japan’s compulsory lessons did not lower relative collision rates.
A 2009 review by Nicol Korner-Bitensky’s team found strong evidence that education combined with on-road training improves driving performance, which is not the same as fewer crashes.
The best crash evidence comes from cognitive training. In the US ACTIVE trial, 908 drivers with an average age of 73 were randomised to up to ten sessions of memory, reasoning or speed-of-processing training, or no contact. Over about six years, the speed group had 43% fewer at-fault crashes per mile than controls (rate ratio 0.57).
Two caveats apply. The crash analysis covered four of six sites, and the lead author held stock in companies marketing the speed training, a conflict the paper disclosed. One positive trial is a lead, not a settled answer.
Warning signs, the family conversation and the licence rules
This section gathers what US and UK government pages say about when to review someone’s driving. It is general information, not medical advice.
First the scale. The CDC says that each day 25 older adults are killed and over 740 are injured in crashes; its 2022 headline figures are about 9,100 older adults killed, over 270,000 treated in emergency departments, and almost 52 million licensed drivers aged 65 and older. NHTSA reports 8,019 fatal crashes involving drivers 65 and older in 2024, and adds that decisions about driving “should never be based on age alone”. The National Institute on Aging says there is not one recommended age to quit driving.
| Sign |
|---|
| Multiple crashes, near misses, or new dents or scrapes on the car |
| Two or more traffic tickets or warnings within the last two years |
| Increases in car insurance premiums because of driving issues |
| Comments from neighbours or friends about erratic, unsafe or aggressive driving |
| Anxiety about driving at night |
| Health issues that might affect driving, including vision, hearing and movement |
| Complaints about the speed, sudden lane changes or actions of other drivers |
| A doctor’s recommendation to modify driving habits or quit |
The NIA says a yes to any checklist question suggests it may be time to talk with a doctor or family. It advises cutting back on or stopping night driving if you have trouble seeing in the dark, and says that with dementia, as memory and decision-making get worse, the person will likely need to stop. NHTSA frames the family talk in three steps: collect information, develop a plan of action, and follow through.
Licence rules differ. In Great Britain, GOV.UK says you must renew every 3 years once you reach 70, free online with the DVLA, and that you must tell the DVLA about a notifiable medical condition or one that has got worse; you can be fined up to £1,000 for not doing so. In the US the Insurance Institute for Highway Safety (a nonprofit funded by insurers) tabulates state rules, such as shorter renewal cycles or in-person renewal for older drivers, and says renewal restrictions for older drivers “have not shown clear safety benefits”. Its table warns it is not guaranteed to be current.
What we could not confirm: the data year behind the CDC’s per-day figure, the current rule in any particular state, and the date NHTSA’s page was last updated.
What to do
Steps sorted by when they matter. Each one says how strong the evidence is: Measured Official advice Untested
Before
- Judge fitness to drive by health and driving ability, not by age alone. Measured see Sources
- If you drive only short local trips, know that low-mileage drivers crash more per mile at any age. Measured see Sources
- Plan other ways of getting around, such as buses, trains or a bicycle, before you need them. Measured see Sources
- Check the current licence-renewal rules with your licensing authority; they differ by country and state. Untested see Sources
If it happens
- If you or a relative has dementia or mild cognitive impairment, ask a doctor about an on-road driving assessment rather than deciding on the diagnosis alone. Measured see Sources
- Keep up with eye checks, especially if you renew your licence by post or online. Measured see Sources
- If family or a doctor raise concerns about driving, talk it through with the doctor before deciding. Untested see Sources
Afterwards
- After stopping driving, keep moving independently by bus, train or bicycle rather than relying only on lifts. Measured see Sources
- Watch for low mood after giving up the car; stopping was linked to nearly double the odds of depressive symptoms. Measured see Sources
- Take extra care on foot and by bicycle; in Japan most pedestrian and cyclist deaths are among people aged 65 and over. Measured see Sources
What not to do
- Do not take away someone’s licence without a plan for how they will get around. Measured see Sources
- Do not assume a classroom refresher course will cut crash risk. Measured see Sources
- Do not assume older drivers mainly endanger others; the person most often killed is the driver. Measured see Sources
Not medical or legal advice. Check your local licence rules and ask your doctor about health and driving.
Questions people ask
At what age do drivers become more dangerous?
There is no single age. In US data, fatal crash involvement per mile rises steeply after 80. Health and how much someone drives matter more than the number.
Are older drivers a danger to other people?
Mostly to themselves and their passengers. In Japan, injuries to others per crash caused by older drivers were not markedly higher than for other ages.
Should someone with mild cognitive impairment stop driving?
Not automatically. Driving ability varies widely in MCI. An on-road assessment gives a fairer answer than a diagnosis alone; a doctor can advise on arranging one.
Do vision tests help?
The evidence is mixed. In US data, a vision test added to in-person renewal brought no extra benefit, but one required for remote renewal was linked to fewer fatal crashes among drivers aged 85 and over.
What helps someone who has stopped driving?
Keeping independent mobility. Japanese former drivers who used buses, trains or bicycles had lower rates of functional limitation than those who depended on lifts.
The short version
- Per mile, US fatal crash involvement is below the all-age average until 75 and rises steeply after 80, to 7.9 per 100 million miles at 85 and over against 2.5 overall.
- Part of that rise is the low-mileage bias: people who drive little crash more per mile at any age.
- Fragility drives the death toll: in Japan the at-fault driver was the person killed in 67% of fatal crashes caused by men aged 85 and over, against 31% across all ages.
- Age-based screening has a weak record: retesting in Sydney and cognitive tests in Denmark and Japan (2009) showed no clear fall in crashes.
- Dementia matters more than age: people with dementia were about ten times as likely to fail a road test.
- Stopping driving has costs, including nearly double the odds of depressive symptoms.
This article summarises research for general information. It is not medical or legal advice, and licensing rules differ by country and state. If you are worried about your own or a relative’s driving, talk to a doctor about a formal driving assessment and check the rules with your licensing authority.
Further reading: Li, Braver and Chen, Accident Analysis & Prevention (2003), on fragility. Ichikawa, Inada and Nakahara, Journal of Epidemiology 34(6) (2024), on Japan’s older drivers. Chihuri et al., Journal of the American Geriatrics Society 64(2) (2016), on the health effects of stopping driving.
Sources
- Insurance Institute for Highway Safety. Fatality Facts 2024: Older people (accessed October 2026).
- Ichikawa M, et al. Revisiting older drivers’ risks of at-fault motor vehicle collisions in Japan. J Epidemiol 34(6):295–300 (2024), doi:10.2188/jea.JE20230217.
- Staplin L, et al. ‘Low mileage bias’ and related policy implications: a cautionary note. Accid Anal Prev (2008), doi:10.1016/j.aap.2007.10.012.
- Langford J, et al. In defence of the ‘low-mileage bias’. Accid Anal Prev (2008), doi:10.1016/j.aap.2008.08.027.
- Antin JF, et al. A validation of the low mileage bias using naturalistic driving study data. J Safety Res (2017), doi:10.1016/j.jsr.2017.10.011.
- Langford J, Koppel S. A tale of two surveys: explaining older drivers’ low mileage bias (conference paper, 2005).
- Li G, et al. Fragility versus excessive crash involvement as determinants of high death rates per vehicle-mile of travel among older drivers. Accid Anal Prev (2003), doi:10.1016/S0001-4575(01)00107-5.
- Meuleners LB, et al. Fragility and crash over-representation among older drivers in Western Australia. Accid Anal Prev (2006), doi:10.1016/j.aap.2006.04.005.
- Chee JN, et al. Update on the risk of motor vehicle collision or driving impairment with dementia. Am J Geriatr Psychiatry (2017), doi:10.1016/j.jagp.2017.05.007.
- Davis JW, et al. The medical referral process and motor-vehicle crash risk for drivers with dementia. Geriatrics 5(4):91 (2020).
- Anstey KJ, et al. Assessment of driving safety in older adults with mild cognitive impairment. J Alzheimers Dis (2017).
- Fraade-Blanar LA, et al. Cognitive decline and older driver crash risk. J Am Geriatr Soc (2018), doi:10.1111/jgs.15378.
- Langford J, et al. Effectiveness of mandatory license testing for older drivers in reducing crash risk among urban older Australian drivers. Traffic Inj Prev (2004), doi:10.1080/15389580490509464.
- Sirén A, Meng A. Cognitive screening of older drivers does not produce safety benefits. Accid Anal Prev (2012), doi:10.1016/j.aap.2011.09.032.
- Tefft BC. Driver license renewal policies and fatal crash involvement rates of older drivers, United States, 1986–2011. Inj Epidemiol (2014), doi:10.1186/s40621-014-0025-0.
- Hamann C, et al. Impact of driver licensing renewal policies on older driver crash involvement and injury rates in 13 states, 2000–2019. Inj Epidemiol (2025), doi:10.1186/s40621-024-00555-9.
- Association of Optometrists. Consultation on mandatory sight testing for older drivers launched (7 January 2026).
- Ichikawa M, et al. Impact of mandating a driving lesson for older drivers at license renewal in Japan. Accid Anal Prev (2015), doi:10.1016/j.aap.2014.11.015.
- Ichikawa M, et al. Effect of a cognitive test at license renewal for older drivers on their crash risk in Japan. Inj Prev (2020), doi:10.1136/injuryprev-2018-043117.
- Inada H, et al. Association between mandatory cognitive testing for license renewal and motor vehicle collisions and road injuries. J Am Geriatr Soc (2023), doi:10.1111/jgs.18157; University of Tsukuba press release (January 2023).
- Ichikawa M, et al. News coverage of older drivers’ fatal car crashes: is it over-represented? J Epidemiol 35(5) (2025), doi:10.2188/jea.JE20240299.
- Best Car Web. Report on National Police Agency licence-surrender statistics (11 December 2024).
- Chihuri S, et al. Driving cessation and health outcomes in older adults. J Am Geriatr Soc 64(2):332–341 (2016), doi:10.1111/jgs.13931.
- Hirai H, et al. The risk of functional limitations after driving cessation among older Japanese adults: the JAGES cohort study. J Epidemiol 30(8):332–337 (2020), doi:10.2188/jea.JE20180260.
- Nasvadi GE, Vavrik J. Crash risk of older drivers after attending a mature driver education program. Accid Anal Prev (2007), doi:10.1016/j.aap.2007.02.005.
- Korner-Bitensky N, et al. Older driver retraining: an updated systematic review of evidence of effectiveness. J Safety Res (2009), doi:10.1016/j.jsr.2009.02.002.
- Ball K, et al. Cognitive training decreases motor vehicle collision involvement of older drivers. J Am Geriatr Soc (2010), doi:10.1111/j.1532-5415.2010.03138.x.
- The Korea Herald. Simple test may help spot older drivers at higher crash risk (25 August 2026).
- CDC. Older Adult Drivers. cdc.gov. Reviewed Jan. 28, 2026.
- NHTSA. Older Drivers. nhtsa.gov.
- National Institute on Aging. Safe Driving for Older Adults. nia.nih.gov. Reviewed Dec. 20, 2022.
- GOV.UK. Renew your driving licence at 70 (updated Sept. 25, 2026), gov.uk; Driving with a medical condition (updated Sept. 9, 2026), gov.uk.
- Insurance Institute for Highway Safety (nonprofit). License renewal laws table. iihs.org.