Robotaxis and Self-Driving Cars: What the Evidence Shows
Key takeaways · 13 min read
- ‘Self-driving’ covers two different things. Level 2 systems such as Tesla Autopilot need a watching driver; Level 4 robotaxis such as Waymo drive themselves in a mapped area.
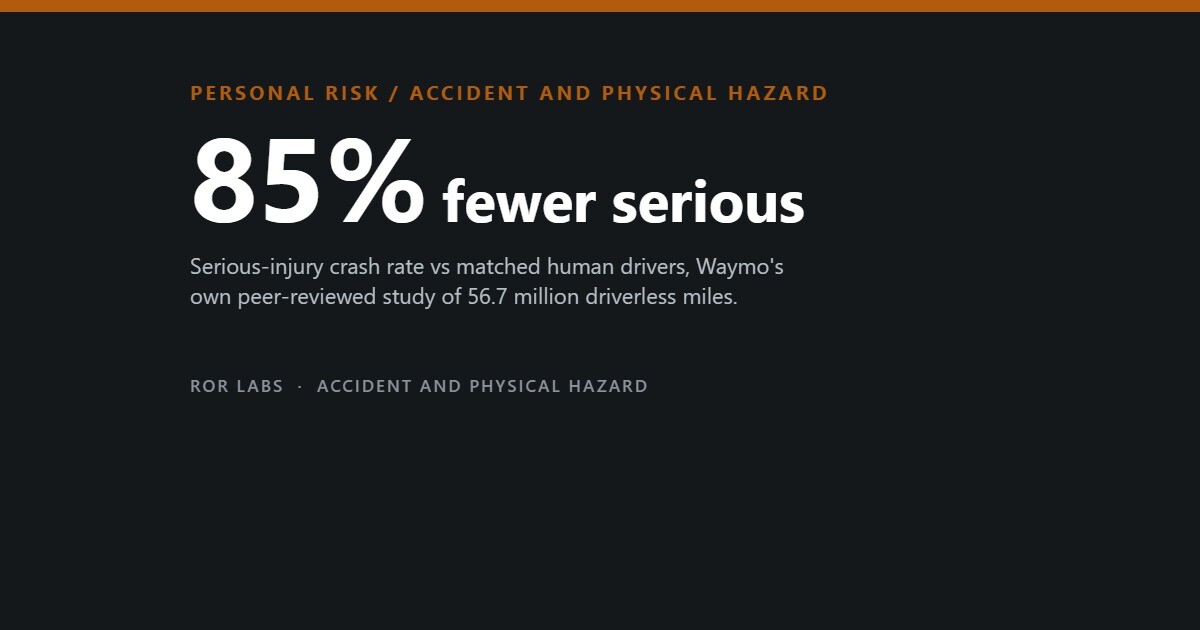
- Waymo’s peer-reviewed study of 56.7 million driverless miles found 79% fewer injury crashes and 85% fewer serious-injury crashes than matched human drivers, though the serious figure rests on two crashes.
- Nearly all this evidence comes from the companies, from a few sunny US cities, and from human benchmarks that are hard to match for road type, time of day and crash reporting.
- With Level 2 the main risk is the human: drivers look away more as they get used to automation, and NHTSA judged Tesla’s driver monitoring too weak.
In a growing list of American cities you can now open an app and be driven home by a car with nobody in the front seat. In February 2026 Waymo was providing more than 400,000 trips a week and adding Dallas, Houston, San Antonio and Orlando. Meanwhile millions of Teslas carry features called Autopilot and Full Self-Driving that still need a human watching the road.
This article looks at whether these cars are safer than people: Waymo’s published crash comparisons, an insurer’s claims study, the statistics of rare events, federal crash reports, and the failures at Cruise, Waymo and Tesla. Earlier pieces covered walking at night and seat belts in the back seat.
The answer has two parts. For one driverless system, in a few cities, the numbers look strongly favourable, though nearly all come from the company itself. For cars where a human is meant to supervise, the real question is what that human does once the car starts driving itself.
Level 2 and Level 4 are different risks
Engineers grade driving automation in levels. At Level 2 the car can steer, accelerate and brake, but the driver must watch the road and be ready to take over at once. Tesla describes Autopilot as a Level 2 driver-assistance system, and the Insurance Institute for Highway Safety (IIHS) states plainly that cars with partial automation ‘are not self-driving’.
At Level 4 the system does all the driving inside a defined area, and no human is expected to step in. Waymo’s rider-only service works this way. So the risks differ: with Level 4 the question is how good the software is; with Level 2 it is how well software and a person share the job, and people are poor at watching a machine that rarely needs them.
What Waymo’s crash studies found
The most cited figures come from Kristofer Kusano and colleagues at Waymo. Their first paper in Traffic Injury Prevention covered 7.1 million rider-only miles to October 2023 in Phoenix, San Francisco and Los Angeles. Waymo cars were in injury-reported crashes at 0.6 per million miles against a human benchmark of 2.80, and in police-reported crashes at 2.1 against 4.68.
A 2025 follow-up covered 56.7 million miles to January 2025, adding Austin. The team built benchmarks only from passenger cars on surface streets in the same counties, adjusted for where in each city Waymo drove. Injury-reported crashes were 79% lower and airbag-deployment crashes 81% lower, both statistically significant.
Crashes per million miles, Waymo and human drivers
Crashed-vehicle rates on surface streets in Phoenix, San Francisco, Los Angeles and Austin, 56.7 million rider-only miles to January 2025, against benchmarks matched by place and road type.
Source: Kusano et al., Traffic Injury Prevention (2025), Table 4. Authors are Waymo researchers. Only the injury benchmark is corrected for unreported crashes.
The headline figure is an 85% reduction in crashes where someone was seriously hurt or killed, with a confidence interval from 39% to 99%. The range is wide because Waymo had only two such crashes. Both were secondary: in one the Waymo was stopped in traffic, and in the other a red-light runner hit it and was pushed into pedestrians on the pavement.
The biggest drops were in intersection crashes and in crashes with pedestrians, cyclists and motorcyclists, the kinds that cause most deaths. Not every type improved: in Phoenix, Waymo cars were struck from behind more often than the benchmark, and the authors made no correction for running many comparisons at once.
Where the injury crashes fell
Reduction in injury-reported crashes for Waymo against the matched human benchmark, by crash type, all locations, 56.7 million miles.
Source: Kusano et al., Traffic Injury Prevention (2025), Table 5. The front-to-rear difference was not statistically significant.
Waymo now updates these figures on its website. Through June 2026 it reported 271.3 million rider-only miles in Phoenix, San Francisco, Los Angeles, Austin and Atlanta, with 95% fewer serious-injury crashes and 93% fewer pedestrian-injury crashes than its benchmarks. These updates are not peer reviewed, and Waymo says it does not yet have enough miles to measure fatal crashes on their own.
The insurance-claims view
Crash counts say nothing about who caused a crash. Liability claims get closer, because they are paid when a driver is judged at least partly responsible. In a 2024 Heliyon paper, Luigi Di Lillo of the reinsurer Swiss Re and Waymo colleagues built a human baseline from more than 600,000 claims and 125 billion miles, matched to the ZIP codes where Waymo operated.
Over 3.87 million rider-only miles, Waymo had no bodily-injury claims, against a baseline of 1.11 per million miles. A later study released by Waymo and Swiss Re in December 2024, covering 25.3 million miles, found 9 property-damage claims where human drivers would be expected to produce 78, and 2 bodily-injury claims against 26. Against newer cars fitted with driver-assistance features, the reductions were 86% and 90%.
Liability claims over 25.3 million miles
Third-party liability claims for Waymo’s driverless service compared with the number expected from human drivers over the same distance and places.
Source: Waymo and Swiss Re, December 2024 study (company release, not peer reviewed). The claims data are not public.
The caveats are real. The claims data belong to the insurer and cannot be checked by outsiders, as the Heliyon authors acknowledge. A fleet operator handles claims differently from a private motorist, and two claims is a thin base for a percentage. The insurance view and the crash view point the same way, but both pass through the company.
The benchmark problem
Every result depends on what ‘human drivers’ means. Robotaxis drive mostly in dense city centres, on surface streets, in good weather. A national average mixes in motorways, rural roads, snow, and drunk and drowsy drivers. As the engineer Noah Goodall put it, a car crashing at the average human rate is ‘somewhere between drunk and sober’.
Where and when a robotaxi drives matters too. When Waymo researchers matched benchmarks to the exact streets their cars used, San Francisco crash rates came out 10% to 47% higher than the plain county average. And 41% of Waymo’s San Francisco miles were driven in the evening and overnight, against 24% for human drivers.
Then there is reporting. NHTSA’s Standing General Order, first issued in 2021, requires companies to report crashes involving automated driving systems, including many minor ones a human would never report to police. Human benchmarks come from police reports, which miss small crashes. Waymo corrects for this only in its any-injury benchmark, using a federal estimate that about a third of injury crashes go unreported.

NHTSA warns that these reports are not adjusted for miles driven, may be incomplete or unverified, and cannot be used to compare companies. For Level 2 the gaps are bigger: only crashes with a death, a hospital visit, an airbag or a struck pedestrian or cyclist must be reported, and makers may never hear of some crashes, because not all cars send data back.
Independent researchers see the same pitfalls. In a 2024 preprint using San Francisco data, Jiayu Joyce Chen and Steven Shladover noted that ride-hail drivers skew young and male and drive long hours, and that most data filed with the state regulator are redacted. Their early figures put Waymo’s driverless crash rate below that of human ride-hail drivers, and Cruise’s above it.
How many miles are enough?
Serious crashes are rare, which makes them hard to measure. In 2016 Nidhi Kalra and Susan Paddock at RAND, using a US rate of 1.09 deaths per 100 million miles, calculated that about 275 million miles without a single death would be needed to show, with 95% confidence, that a driverless fleet was no worse than humans.
Showing it was clearly better is harder. Demonstrating a death rate 20% below the human rate would take more than 11 billion miles, or about 500 years for 100 cars running round the clock at 25 mph. RAND concluded that test-driving alone cannot settle the question.
Miles needed against miles driven
Driverless miles needed to show safety on deaths (RAND, 2016) compared with Waymo’s reported rider-only miles. Bars on a logarithmic scale.
Sources: Kalra and Paddock, RAND (2016); Kusano et al. (2025); Waymo Safety Impact data hub (accessed October 2026).
Waymo’s total is now close to RAND’s parity figure, but that figure assumed no deaths at all over those miles, and Waymo’s are spread over five cities with different benchmarks. Injury crashes are common enough to study, which is why the papers focus on them. On deaths, the honest answer in 2026 is that nobody knows yet.
When robotaxis fail
On 2 October 2023 in San Francisco, a human driver hit a pedestrian and threw the person into the path of a Cruise robotaxi, which braked hard but ran them over. It then tried to pull over, travelling about 20 feet at up to 7 mph with the pedestrian trapped underneath. On 24 October California suspended Cruise’s driverless permits, citing an ‘unreasonable risk to public safety’ and misrepresentation.
Cruise later admitted filing a false report to influence the federal investigation and agreed to a $500,000 criminal fine, on top of a $1.5 million NHTSA penalty. In December 2024 General Motors stopped funding its robotaxi work. The lesson: a rare post-crash decision can cause serious harm, and self-reported data are only as good as the reporter.
Waymo has had its own failures. Austin’s school district documented 19 cases of Waymo cars passing its stopped school buses. NHTSA opened an investigation in October 2025, and in December Waymo said it would file a voluntary software recall; no injuries were reported. Tesla, which began a small robotaxi service in Austin in June 2025, reported 14 crashes in its first eight months, with each narrative redacted.
Tesla, Level 2 and the attention problem
Most people who use automation do so in their own cars, with Level 2 systems. In a field trial published by IIHS in 2020, 20 volunteers drove for a month. After a month, those using Volvo’s Pilot Assist lane-centring were, on corrected data, more than three times as likely to show signs of disengagement and 17 times as likely to take both hands off the wheel as at the start.
A 2025 IIHS and MIT study gave 14 drivers a Tesla Model 3 for a month. They learned the timing of its attention reminders and used the gaps for other activities, glancing off the road more as the weeks passed. A 2025 meta-analysis of 41 studies with 1,482 participants found that partial automation made drivers more likely to look away and do other tasks.
NHTSA’s Autopilot investigation reviewed 956 crashes up to August 2023, 13 of them fatal, and found that Tesla’s ‘weak driver engagement system’ did not match what the system allowed. Tesla recalled about 2 million vehicles by software update in December 2023. In October 2025 NHTSA opened a probe into 2.88 million Teslas with Full Self-Driving after 58 reports of traffic violations, including six red-light crashes.
Partial automation safeguards, IIHS first ratings
How 14 partial driving automation systems scored on driver monitoring, attention reminders and other safeguards, March 2024.
Source: IIHS, partial driving automation safeguard ratings (12 March 2024). The Tesla systems tested ran software from before the December 2023 recall.
Where the evidence is weak
The strongest crash studies were written by Waymo employees using Waymo’s mileage, and the insurance studies used data outsiders cannot inspect. The methods are published and the crashes are filed with a federal agency, but independent replication is thin, and it covers one company in five warm-weather cities, mostly without motorways or snow.
Results for one company say little about another: Cruise’s early rate looked worse than Waymo’s, and Tesla has not published robotaxi mileage. An earlier IIHS analysis of Google’s test cars from 2009 to 2015 found 2.19 police-reportable crashes per million miles against 6.06 for humans, but the gap was not statistically significant. Each system, and each new city, needs its own evidence.
What to do
Steps sorted by when they matter. Each one says how strong the evidence is: Measured Official advice Untested
Before
- Find out which automation level your car has: Autopilot, Full Self-Driving and similar features are Level 2 driver assistance, not self-driving. Official advice see Sources
- Read your car’s manual on where its driver-assistance system is meant to be used and when it may hand control back to you. Untested see Sources
- Install safety recall software updates promptly; both the Tesla Autopilot and Waymo school-bus fixes were delivered as software recalls. Measured see Sources
If it happens
- In a Level 2 car, keep your hands on the wheel and your eyes on the road, even when the car is steering and braking. Official advice see Sources
- Watch yourself for the habit studies found: drivers look away more and take their hands off more as they get used to automation. Measured see Sources
- As a robotaxi passenger, wear your seat belt; other vehicles can still hit the car, often from behind. Untested see Sources
- On foot or on a bike, do not assume an automated car has seen you or will stop; wait until it has clearly stopped. Untested see Sources
Afterwards
- Report a crash, near miss or odd behaviour by an automated car to the operator or manufacturer, and to your national vehicle-safety regulator. Untested see Sources
- If you were in a robotaxi crash, note the time and place and keep your trip record from the app. Untested see Sources
What not to do
- Do not treat a Level 2 system as self-driving; IIHS says cars with partial automation are not self-driving. Official advice see Sources
- Do not try to defeat or switch off driver-monitoring safeguards; NHTSA found weak driver engagement contributed to foreseeable misuse. Official advice see Sources
- Do not read one company’s safety figures as proof for another company, another city, or snow and motorway driving. Measured see Sources
Not professional advice. Follow your vehicle maker’s instructions and local traffic rules.
Questions people ask
Is it safer to take a robotaxi than a human-driven taxi?
For Waymo in the cities studied, the data suggest fewer injury crashes than the average driver on the same streets. That benchmark is all drivers, not professional taxi drivers, and the data come mostly from the company. Wear your seat belt either way; someone else can still hit you.
Is Tesla’s Full Self-Driving a self-driving car?
No. It is a driver-assistance system: Tesla says it does not make the car self-driving, and the driver must pay attention and be ready to intervene. If you are behind the wheel, you are responsible, even while the car steers and brakes.
Why do robotaxis get rear-ended so often?
Many robotaxi crashes are other vehicles hitting them from behind, often while they are stopped. In Waymo’s 2025 study this was more common than the benchmark in Phoenix. Whether it reflects cautious braking, other drivers’ mistakes or both is not yet clear.
What should pedestrians and cyclists do around driverless cars?
The same as around any car: do not assume it has seen you or will stop. There is no driver to make eye contact with, and the school-bus cases show systems can get specific situations wrong. Wait until the car has clearly stopped.
Who is responsible when a self-driving car crashes?
With Level 2 the driver normally is. With driverless Level 4 services, the operator carries more of it, and US regulators can push for recalls. The law is still developing and varies by country.
The short version
- ‘Self-driving’ covers two different things. Level 2 systems such as Tesla Autopilot need a watching driver; Level 4 robotaxis such as Waymo drive themselves in a mapped area.
- Waymo’s peer-reviewed study of 56.7 million driverless miles found 79% fewer injury crashes and 85% fewer serious-injury crashes than matched human drivers, though the serious figure rests on two crashes.
- Nearly all this evidence comes from the companies, from a few sunny US cities, and from human benchmarks that are hard to match for road type, time of day and crash reporting.
- With Level 2 the main risk is the human: drivers look away more as they get used to automation, and NHTSA judged Tesla’s driver monitoring too weak.
- Proving a lower death rate takes huge mileage: RAND estimated 275 million crash-free miles to show parity with humans, and over 11 billion to show a 20% gain.
- Failures happen: Cruise dragged a pedestrian in 2023, and Waymo recalled software after passing stopped school buses. On foot or on a bike, never assume an automated car will stop.
This article summarises research, government reports and news coverage for general information. It is not legal, insurance or engineering advice. Follow your vehicle’s manual and local traffic law, and report vehicle safety problems to the manufacturer or your national vehicle-safety regulator.
Further reading: Kusano et al., Traffic Injury Prevention (2025), for the most detailed crash comparison of a driverless service. Kalra and Paddock, RAND (2016), for why proving safety takes so many miles. NHTSA’s Standing General Order page, for what federal crash data can and cannot show.
Sources
- Kusano KD, Scanlon JM, Chen YH, McMurry TL, Gode T, Victor T. Comparison of Waymo rider-only crash rates by crash type to human benchmarks at 56.7 million miles. Traffic Injury Prevention (2025), doi:10.1080/15389588.2025.2499887.
- Kusano KD, Scanlon JM, Chen YH, et al. Comparison of Waymo rider-only crash data to human benchmarks at 7.1 million miles. Traffic Injury Prevention (2024), doi:10.1080/15389588.2024.2380786.
- Di Lillo L, Gode T, Zhou X, Atzei M, Chen R, Victor T. Comparative safety performance of autonomous- and human drivers: a real-world case study of the Waymo Driver. Heliyon 10(14):e34379 (2024), doi:10.1016/j.heliyon.2024.e34379.
- Waymo. Blog post on the Swiss Re study of 25.3 million rider-only miles (19 December 2024).
- Chen YH, Scanlon JM, Kusano KD, McMurry TL, Victor T. Dynamic benchmarks: spatial and temporal alignment for automated driving systems performance evaluation. Transportation Research Record (2025), doi:10.1177/03611981251398744.
- Goodall NJ. Potential crash rate benchmarks for automated vehicles. Preprint, engrXiv (2021).
- Chen JJ, Shladover SE. Initial indications of safety of driverless automated driving systems. Preprint, arXiv:2403.14648 (2024).
- Teoh ER, Kidd DG. Rage against the machine? Google’s self-driving cars versus human drivers. J Safety Res (2017), doi:10.1016/j.jsr.2017.08.008.
- Kalra N, Paddock SM. Driving to Safety: How Many Miles of Driving Would It Take to Demonstrate Autonomous Vehicle Reliability? RAND Corporation, RR-1478-RC (2016).
- Waymo. Safety Impact data hub, data through June 2026 (accessed October 2026).
- National Highway Traffic Safety Administration. Standing General Order on Crash Reporting (accessed October 2026).
- NHTSA Office of Defects Investigation. Recall query RQ24009, Autopilot recall remedy 23V838 (2024).
- TechCrunch. Report on NHTSA closing its Autopilot investigation (26 April 2024).
- Insurance Journal. Report on NHTSA’s probe of 2.88 million Tesla vehicles with Full Self-Driving (13 October 2025).
- TechCrunch. Reports on the California DMV’s suspension of Cruise (24 October 2023) and Cruise’s $500,000 fine (15 November 2024).
- Silicon UK. GM kills Cruise robotaxi business, after funding is pulled (11 December 2024).
- NPR. Waymo will recall software after its self-driving cars passed stopped school buses (6 December 2025).
- Claims Journal (Bloomberg). Tesla’s Austin robotaxis report 14 crashes in first eight months (18 February 2026).
- TribLive. Waymo’s robotaxis now being dispatched in 10 major US markets (24 February 2026).
- Insurance Journal (Bloomberg). Tesla faces probe over claim of robotaxis speeding in school zones (13 October 2026).
- Insurance Institute for Highway Safety. Drivers let their focus slip as they get used to partial automation (19 November 2020, with correction).
- Mueller AS, Gershon P, Haus SH, Cicchino JB, Mehler B, Reimer B. Finding windows of opportunity: how drivers adapt to partial automation safeguards over time. Transp Res Part F (2025), doi:10.1016/j.trf.2025.02.019.
- Vasta N, Biondi FN. Effect of partially automated driving on mental workload, visual behavior and engagement in nondriving-related tasks: a meta-analysis. Human Factors (2025), doi:10.1177/00187208251323132.
- Insurance Institute for Highway Safety. First partial driving automation safeguard ratings show industry has work to do (12 March 2024).