Water Main Breaks: What the Evidence Shows
Key takeaways · 10 min read
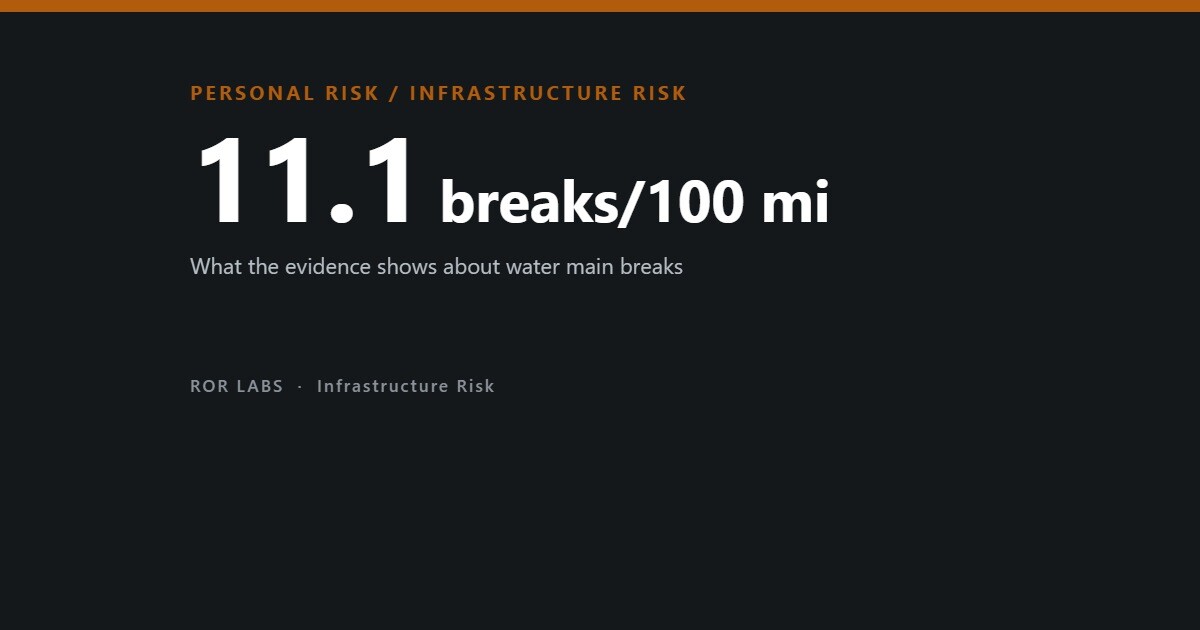
- US and Canadian mains broke 11.1 times per 100 miles per year in 2023, down from 14.0 in 2018.
- Cast iron breaks about ten times as often as PVC, and corrosive soil multiplies the risk.
- Cold snaps and past breaks are better warnings than age alone.
- Households near breaks and repairs had a modestly higher risk of stomach illness in the following week.
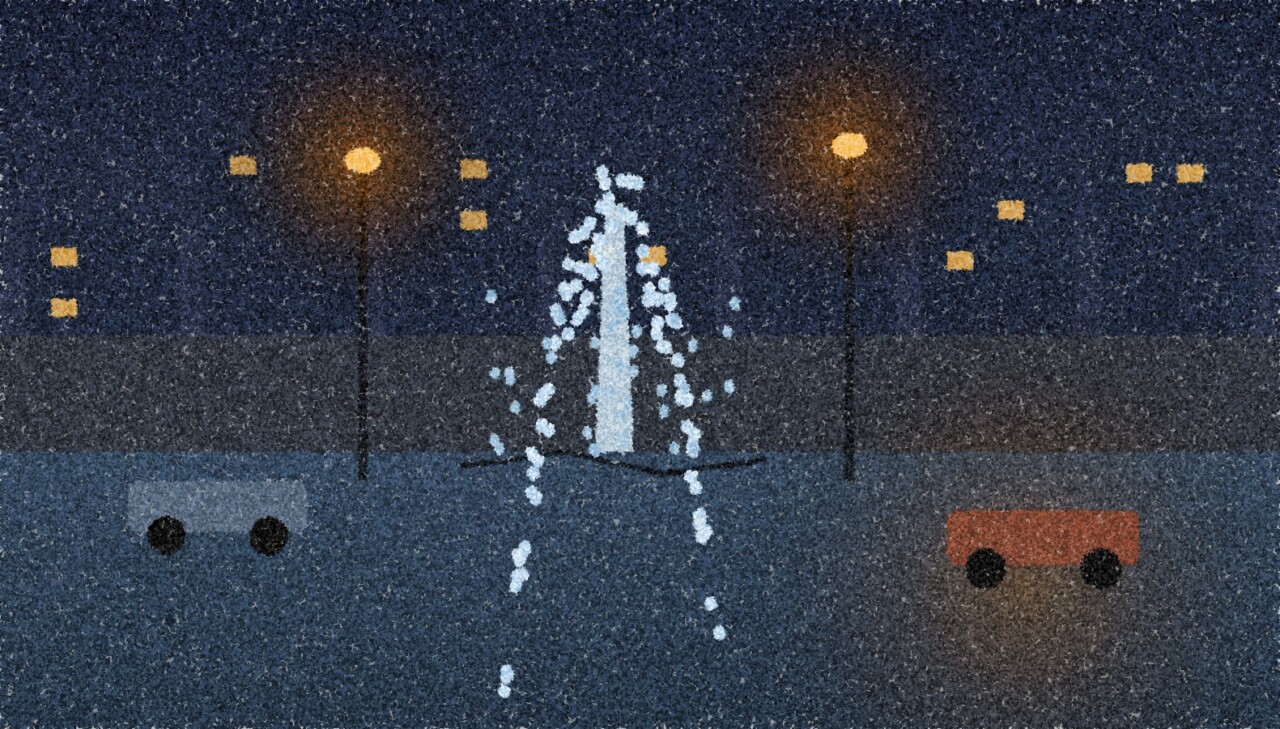
On Friday 31 May 2024, two water mains broke in Atlanta within hours of each other. One flooded a street in Midtown for days while crews waited for a replacement part. Businesses closed, a hospital diverted ambulances, and the city stayed under a boil-water advisory until 6 June. The mayor blamed decay, corrosion and the age of the system.
Scenes like this are common. The American Society of Civil Engineers estimates that the United States has about 240,000 water main breaks a year, and most cities have pipes that were laid more than half a century ago. A break can cut supply, flood homes and roads, undermine the ground beneath the street and, when pressure drops, let contaminated water into the pipes.
Researchers have measured how often mains break, what makes some pipes fail more than others, and whether people get sick afterwards. The results are more reassuring on some points than the headlines suggest, and less reassuring on others.
How often mains break
The best North American data come from surveys of utilities run by Utah State University. The 2012 survey of 188 utilities found 11.0 breaks per 100 miles of pipe per year. The 2018 survey, led by Steven Folkman and covering 281 utilities with break data, found 14.0, an increase of 27%. The 2023 survey, led by Steven Barfuss and covering 802 utilities and nearly 400,000 miles of pipe, found 11.1, a fall of about 20% from 2018.
That fall matters, because it cuts against the common assumption that breaks can only get worse. Part of it may reflect the much larger and different set of utilities in the 2023 survey rather than real improvement, so the trend is less certain than the numbers look. The American Society of Civil Engineers also revised its estimate down, from 250,000 to 300,000 breaks a year in its 2021 report card to about 240,000 in 2025, costing about $2.6 billion a year to repair.
US and Canadian water main break rates
Breaks per 100 miles of pipe per year, utility surveys.
Folkman, Utah State University, 2012 and 2018; Barfuss, Utah State University, 2023. The set of utilities differs between surveys.
What makes pipes break
Material is the biggest single difference. In the 2023 survey, cast iron mains broke 28.6 times per 100 miles per year, asbestos cement 10.3, steel 9.2, ductile iron 5.1 and PVC 2.9. Cast iron, much of it laid before the 1960s, breaks about ten times as often as PVC. In the 2018 survey, cast iron and asbestos cement together made up 41% of installed mains, and 82% of the cast iron was more than 50 years old.
Soil matters almost as much. Three-quarters of utilities in the 2018 survey reported areas of corrosive soil, and cast iron in highly corrosive soil broke more than 20 times as often as cast iron in soil with low corrosivity. Age matters too, though less simply than people assume. The 2023 survey found that 19.4% of mains were beyond their useful life and that the average failing main was 53 years old. But a 2024 doctoral study of more than 10 million pipe-years of records from four countries found that break rates peaked at around 40 years and then declined for decades, because the weakest pipes had already failed and been replaced.
Break rates by pipe material
Breaks per 100 miles per year, 2023 survey.
Barfuss, Utah State University, 2023. Materials with few responses were excluded.
Weather is the trigger. Breaks cluster in cold snaps, when the ground contracts and freezes around brittle pipe. A study of three North American utilities, by Balvant Rajani, Yehuda Kleiner and Jon-Eric Sink, found average temperature, the size of temperature rises and drops, and the speed of change were the most consistent predictors, with the strongest effect on cast iron. In the Netherlands, researchers found that cast iron failures rose in cold weather but asbestos cement failures rose in hot, dry weather, as clay soils shrank.
Can breaks be predicted?
Utilities increasingly use statistical and machine-learning models to rank pipes for replacement. In a 2018 study in Syracuse, New York, a model trained on the city’s records identified the riskiest 1% of pipes, and 62% of those broke within three years. Ranking by age alone would have caught 10%, and by past break history 48%. A pipe that has broken before is the best single warning.
Reviews are more cautious. In 2019, Neil Barton and colleagues at Cranfield University warned that models built on inconsistent utility data can misrepresent what is happening in the ground, and a 2022 review noted that machine learning performs better on large, complex datasets but requires expert knowledge to use well. Many utilities do not even have good records of which materials were laid decades ago, as the Utah surveys noted.
Do breaks make people ill?
When a main breaks or is shut off for repair, pressure in the pipes can drop, and contaminated water from the surrounding soil can be drawn in. Several studies have measured whether people nearby get sick. In Norway in 2003 and 2004, Karin Nygård and colleagues compared 612 households exposed to a main break or repair with 547 unexposed households. In the following week, 12.7% of exposed households reported gastrointestinal illness, against 8.0% of unexposed ones, a relative risk of 1.58.
A Swedish study of 69 incidents and more than 3,200 households found similar results: an odds ratio of 1.9 for acute gastrointestinal illness in affected households. Where the sewage and drinking water pipes lay at the same level in the trench, the odds were much higher, although the estimate was very imprecise. After freezing weather broke mains across parts of Alabama in January 2010, leaving some residents without water for up to 12 days, the risk of illness rose with the length of the outage.
Illness after breaks and repairs
Households with gastrointestinal illness in the week after a main break or repair, Norway.
Nygård and colleagues, International Journal of Epidemiology, 2007. 612 exposed and 547 unexposed households; relative risk 1.58.
Longer outages, more illness
Adjusted odds of acute gastrointestinal illness after freeze-related breaks, Alabama, January 2010.
CDC, MMWR, 2011. Survey of 470 households; about 18,000 residents lost water for up to 12 days.
The pooled evidence is weaker than it looks. In 2014, Ayse Ercumen, Joshua Gruber and John Colford combined studies of water distribution problems. Outages in normally continuous systems, mostly from breaks and repairs, were linked to about three times the risk of gastrointestinal illness. But the studies varied widely, the authors found signs of publication bias, and they warned the pooled estimate might be higher than the true risk. In blinded trials, where people did not know whether their tap water was being treated, household filters made no difference. We looked at what boil notices achieve in our article on boil-water advisories.
What happens after a break
For people nearby, the practical effects of a break follow a familiar sequence. The utility isolates the damaged section by closing valves, which can cut supply to a street or a whole district. Crews excavate, repair or replace the pipe, then flush and disinfect the section before restoring pressure. Where pressure fell low enough for contamination to be possible, many utilities issue a precautionary boil-water notice and lift it only after samples come back clean, which usually takes one to several days.
Water that escapes also does its own damage. A large main can release enough water to flood basements and roads within minutes, and water running through the soil can wash out the ground beneath the pavement. In the Swedish study, the risk of illness was highest when the repair trench also held a sewer pipe, a reminder that the repair itself, not only the break, is when contamination is most likely.
The cost of fixing it
Replacing old mains is expensive. The US Environmental Protection Agency’s seventh drinking water infrastructure needs survey, published in 2023, estimated that US systems need $625 billion over 20 years, of which $420.8 billion is for transmission and distribution pipes. At the current pace, one analysis estimated, US mains are being replaced roughly once every 200 years, far longer than any pipe lasts.
Yet replacing pipes is not always the best use of money. Studies going back to the 1980s found that many pipes did not show rising break rates over time, and that replacing a segment only after it had broken twice was the least-cost policy for New York City. Results depended heavily on the discount rate and on how much each break was assumed to cost. The right answer depends on the pipe, the soil and what a failure would damage.
Other countries measure the problem differently. In the United Kingdom, water companies are committed to halving leakage from 2017–18 levels by 2050. In South Korea, the environment ministry reported a leakage rate of 9.9% in 2023, and said 16 local governments that had finished replacing old pipes had cut leakage by 10.8 percentage points since 2016.
What US water pipes need
Estimated drinking water infrastructure needs over 20 years, in January 2021 dollars.
| Category | Estimated need |
|---|---|
| All drinking water infrastructure | $625 billion |
| Transmission and distribution pipes | $420.8 billion |
| Share for pipes | About 67% |
US Environmental Protection Agency, 7th Drinking Water Infrastructure Needs Survey and Assessment, 2023.
Recent cases
Atlanta’s 2024 breaks are one example among many. In Waterbury, Connecticut, a main installed around 1900 broke in December 2025; by the following Monday about 60% of residents had no water, and the National Guard handed out more than 30,000 gallons. On 10 May 2026, a 42-inch transmission main of the Great Lakes Water Authority burst in Auburn Hills, Michigan, prompting a state of emergency and a boil-water advisory that lasted until 16 May.
Not every water crisis is a main break. The 2022 crisis in Jackson, Mississippi, which left more than 150,000 people without safe water, began with failures at a treatment plant during flooding, although the city had also suffered many line breaks. And breaks do not only affect water supply. Leaking water and sewer pipes are the leading cause of the road collapses described in our article on sinkholes.
What the evidence suggests
For most households, a main break means a few days of disruption rather than illness. The risk of gastrointestinal illness after a break is real but modest, higher when outages are long and when repairs are done in trenches shared with sewers, and it is the reason boil-water advisories are issued. Break rates depend far more on pipe material, soil and weather than on age alone, and the latest US survey found them falling rather than rising.
The larger risk is slow: a stock of old cast iron and asbestos cement pipe, much of it in corrosive soil, replaced far more slowly than it wears out. That is a question for utilities and governments rather than households, and the research suggests that targeting pipes that have already broken, rather than simply the oldest ones, gets more value from the money.
Questions people ask
How many water main breaks are there each year?
The American Society of Civil Engineers estimates about 240,000 a year in the United States, down from an estimated 250,000 to 300,000 in its 2021 report.
Why do water mains break in winter?
Cold snaps make the ground freeze and contract around brittle pipes, especially cast iron. Temperature drops and rapid changes are among the strongest predictors of breaks.
Is it safe to drink tap water after a water main break?
Follow your utility’s instructions. Studies found a modestly higher risk of stomach illness after breaks and repairs, which is why utilities issue boil-water notices when pressure is lost.
Which pipes break most often?
Cast iron, at 28.6 breaks per 100 miles per year in the 2023 survey, compared with 2.9 for PVC.
Who pays for water main damage to my home?
It depends on where the break happened, local law and your insurance policy. Check with your utility and your insurer; many home policies treat sudden water damage and gradual leaks differently.
The short version
- US and Canadian mains broke 11.1 times per 100 miles per year in 2023, down from 14.0 in 2018.
- Cast iron breaks about ten times as often as PVC, and corrosive soil multiplies the risk.
- Cold snaps and past breaks are better warnings than age alone.
- Households near breaks and repairs had a modestly higher risk of stomach illness in the following week.
- US drinking water systems need an estimated $625 billion over 20 years, two-thirds of it for pipes.
This article summarises published research, utility surveys and official data on water main breaks. It is not engineering, legal, insurance or medical advice. During a water outage or boil-water notice, follow the instructions of your water utility and local health authority, and seek medical advice if you become unwell.
Further reading. Barfuss, ‘Water Main Break Rates in the USA and Canada: A Comprehensive Study’, Utah State University, 2023, is the most complete survey. Ercumen, Gruber and Colford, Environmental Health Perspectives, 2014, reviews the health evidence and its weaknesses.
- Water Always Wins, Erica Gies (2022). A journalist on how cities have tried to control water and what happens when it pushes back. Focused on floods and drought more than pipes.
- Engineering in Plain Sight, Grady Hillhouse (2022). An illustrated guide to the infrastructure around us, with a chapter on municipal water and wastewater.
- Proof, Adam Kucharski (2025). A mathematician on how people decide what counts as evidence, useful for weighing observational studies like those on illness after breaks.
Sources
- Folkman SL. Water Main Break Rates in the USA and Canada: A Comprehensive Study. Utah State University, 2012.
- Folkman SL. Water Main Break Rates in the USA and Canada: A Comprehensive Study. Utah State University, 2018.
- Barfuss SL. Water Main Break Rates in the USA and Canada: A Comprehensive Study. Utah Water Research Laboratory, Utah State University, 2023.
- American Society of Civil Engineers. Report Card for America’s Infrastructure: Drinking Water, 2021 and 2025.
- Rajani B, Kleiner Y, Sink JE. Exploration of the relationship between water main breaks and temperature covariates. National Research Council Canada, 2012.
- Wols BA, Vogelaar A, Moerman A, Raterman B. Effects of weather conditions on drinking water distribution pipe failures in the Netherlands. Water Supply, 2019;19(2):404.
- Kumar A, and colleagues. Using machine learning to assess the risk of and prevent water main breaks. arXiv:1805.03597, 2018.
- Barton NA, Farewell TS, Hallett SH, Acland TF. Improving pipe failure predictions: factors affecting pipe failure in drinking water networks. Water Research, 2019;164:114926. doi:10.1016/j.watres.2019.114926.
- Barton NA, Hallett SH, Jude SR, Tran TH. An evolution of statistical pipe failure models for drinking water networks: a targeted review. Water Supply, 2022;22(4):3784.
- Laven K. Practical application of machine learning to water pipe failure prediction. PhD thesis, University of Waterloo, 2024.
- Nygård K, and colleagues. Breaks and maintenance work in the water distribution systems and gastrointestinal illness: a cohort study. International Journal of Epidemiology, 2007;36(4):873–880. doi:10.1093/ije/dym029.
- Säve-Söderbergh M, and colleagues. Gastrointestinal illness linked to incidents in drinking water distribution networks in Sweden. Water Research, 2017;122:503–511. doi:10.1016/j.watres.2017.06.013.
- Ercumen A, Gruber JS, Colford JM. Water distribution system deficiencies and gastrointestinal illness: a systematic review and meta-analysis. Environmental Health Perspectives, 2014;122(7):651–660. doi:10.1289/ehp.1306912.
- Centers for Disease Control and Prevention. Gastrointestinal illness among persons with extended water outages after a freeze, Alabama, 2010. MMWR, 2011;60(6).
- Male JW, Walski TM, Slutsky AH. Analyzing water main replacement policies. Journal of Water Resources Planning and Management, 1990;116(3):362–374. doi:10.1061/(ASCE)0733-9496(1990)116:3(362).
- Grigg NS. Water main breaks: risk assessment and investment strategies. Journal of Pipeline Systems Engineering and Practice, 2013;4(4). doi:10.1061/(ASCE)PS.1949-1204.0000142.
- US Environmental Protection Agency. 7th Drinking Water Infrastructure Needs Survey and Assessment: fact sheet. April 2023.
- City of Auburn Hills. State of emergency: water main break and boil water advisory. May 2026.