What a bridge rated ‘poor’ is actually telling you
Key takeaways · 13 min read
- “Structurally deficient” was renamed “poor condition” in 2018 because the old phrase was read as a collapse warning. The test did not change: the lowest of deck, superstructure and substructure at 4 or below on a 0–9 scale.
- In 2026 that describes 41,148 of 624,939 bridges, about 6.6%. Half the inventory sits in fair.
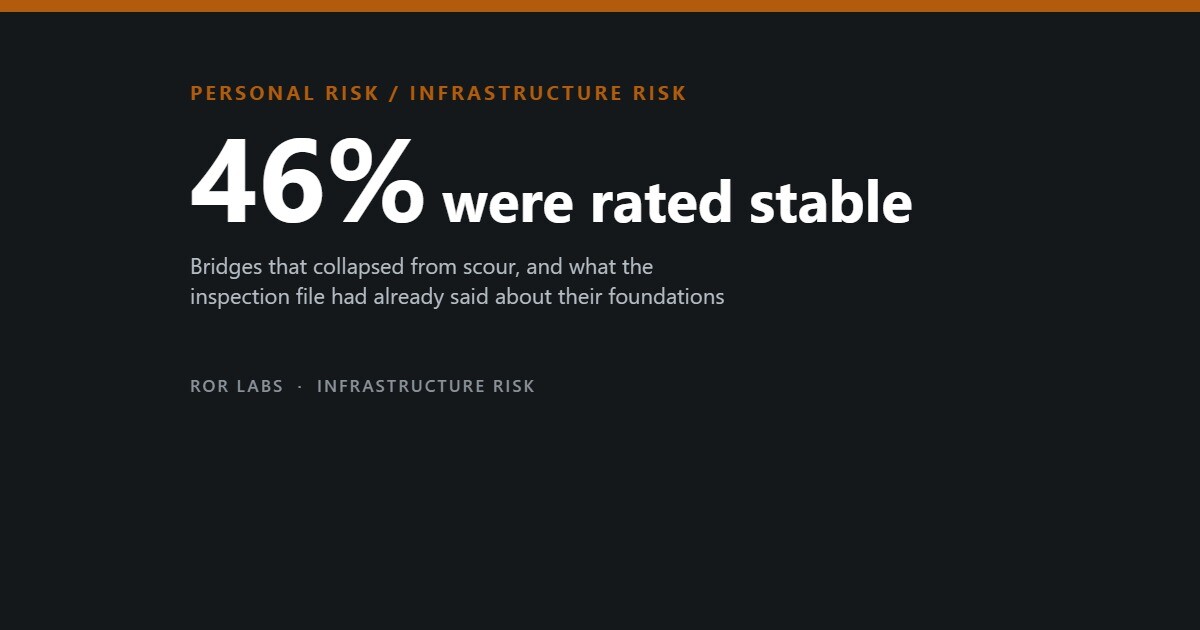
- Among bridges that actually collapsed, 46% had been rated structurally deficient beforehand — so most had not. The label roughly triples a small risk rather than identifying the ones that will go.
- Scour is the leading cause of collapse at 55%. Of the bridges that collapsed from scour, 46.4% had been appraised as scour stable.
In this article
- What the number is actually counting
- How often a bridge in poor condition actually falls
- The cause that dominates is not the one the rating watches
- The number moves with the person holding the clipboard
- Fern Hollow: the rating was right and it did not matter
- What the rating is good for
- Why the answer is not to avoid bridges
- The short version
- Sources
Every public highway bridge in the United States is looked at least once every two years, and somebody writes down a number. Three numbers, really: one for the deck you drive on, one for the superstructure that carries it, and one for the substructure standing in the ground or the water. The scale runs from 9 down to 0. If the lowest of those three falls to 4 or below, the bridge is filed under a single word, and that word travels a long way.
The word used to be structurally deficient. It is now poor condition. The Federal Highway Administration retired the older phrase because people kept hearing it as a warning about the next few minutes rather than a note about the next few years. The classification test did not change when the name did. What changed was the recognition that the name was doing damage.
That is the easy half of the story, and it is the half that usually gets told: the label is scarier than the thing. The harder half is that the rating is not merely misread. On the specific question most people want answered — is this bridge going to fall down — the number in the file is a weak instrument, and the evidence on which number would be a better instrument points somewhere most drivers have never heard of.
What the number is actually counting
The scale is condition, not capacity. A 9 is excellent; 7 is good; 5 is fair; 4 is poor; 3 is serious; 2 is critical; 1 is “imminent failure”; 0 is failed. An inspector assigns each of the three main components a value by looking at it. The bridge as a whole then takes the worst of the three.
That last step matters more than it sounds. A bridge with a pristine deck, a sound superstructure and one deteriorated abutment is a “poor” bridge. The classification is deliberately pessimistic, because it is built to find work that needs funding, not to estimate a probability of collapse. It is a maintenance queue wearing the clothes of a safety verdict.
The 2026 national picture
All 624,939 public highway bridges, by the lowest of deck, superstructure and substructure
Federal Highway Administration, National Bridge Inventory, Bridge Condition by Highway System, 2026. Poor = 41,148 bridges.
Half the inventory sits in “fair”. That is the number worth staring at, because fair is where poor comes from. The pipeline is larger than the problem.
In January 2017 the FHWA narrowed the definition as part of a rule on performance measures. Two older tests were dropped: a bridge no longer counts as deficient because its overall structural evaluation appraisal was low, or because the waterway opening underneath it was judged inadequate. Tens of thousands of bridges left the category without anyone touching them with a wrench. This is worth remembering whenever a figure from before 2018 is compared with one from after.

How often a bridge in poor condition actually falls
The honest way to ask this is backwards: take the bridges that did collapse, and look at what the file said about them beforehand. Wesley Cook and Paul Barr did exactly that for New York State, matching a set of collapsed bridges against the National Bridge Inventory record from the inspection immediately before each collapse.
Forty-six per cent of the collapsed bridges had been rated structurally deficient. Which means fifty-four per cent had not. The label was present at roughly a coin flip.
Read the other way, the label is not noise. Cook and Barr found structural deficiency and collapse to be statistically related, and estimated the annual collapse rate among structurally deficient bridges at about one in 1,200. Christopher Montalvo and colleagues, working the hydraulic subset against a matched control group drawn from the 2017 inventory, found structural deficiency in 44% of the collapsed bridges against 15% of the controls. A poor rating roughly triples the base rate.
Both things are true at once, and the arithmetic is the whole point. One in 1,200 a year is a real elevation over the background and a small number in absolute terms. A rating that triples a small risk leaves a small risk.
What the file said before the collapse
Collapsed bridges compared with matched controls from the inventory
Cook and Barr, Journal of Performance of Constructed Facilities, 2017. Montalvo, Cook and Keeney, same journal, 2020.
The New York dataset carries the limits of its own construction, and the authors do not hide them. Collapse lists are assembled after the fact from state records and reporting, so a small failure on a low-volume county road is less likely to be in the set than a dramatic one. The one-in-1,200 figure is an estimate derived from that assembled set, not a measured incidence across the full inventory. And it is one state.
The cause that dominates is not the one the rating watches
Ask people why bridges fall and they will describe rust and fatigue — things that accumulate slowly and would therefore show up in a condition rating. The record says otherwise. In the compiled national collapse database, 55% of failures were hydraulic: the water took the ground out from under the foundation. Scour, not corrosion.
Scour has its own rating. Bridges over water are appraised for scour vulnerability and coded as stable or scour-critical, separately from the condition numbers. So the obvious question is whether that appraisal caught the bridges that went.
It did not. Among the bridges that collapsed hydraulically, 46.4% had been appraised as having foundations stable for the calculated scour conditions. Cook and Barr report the same pattern from the New York set at 57%. The purpose-built warning was absent in roughly half the cases it exists to warn about.
The scour-critical flag still carries signal — 17% of hydraulic collapses were coded scour-critical against 6% of controls. But Montalvo and colleagues make a sharper finding, and it is the most useful sentence in this literature. The substructure condition rating predicted hydraulic collapse better than the scour-critical appraisal rating did. Thirty-four per cent of hydraulically collapsed bridges had a poor substructure condition rating, against 11% of controls.
The annual hydraulic failure rate across the inventory works out to roughly one in 8,500.
The scour appraisal against the substructure rating
Bridges that collapsed from hydraulic causes, versus matched controls
Montalvo and Cook, 2017; Montalvo, Cook and Keeney, 2020. Percentages of each group.
A separate appraisal was built to watch the single most common way bridges fail, and one of the ordinary condition numbers turned out to watch it better.
The number moves with the person holding the clipboard
All of this assumes the rating is a stable reading of the bridge. The Federal Highway Administration tested that assumption directly, and the result has never really been absorbed into how the numbers are quoted.

Forty-nine practising state bridge inspectors from 25 states were sent over the same small set of in-service and decommissioned bridges under normal summer conditions, with the inspections timed and observed. The finding: routine condition ratings are assigned with significant variability. About 68% of ratings landed within one point of the average for that bridge, and 95% within two points. The in-depth inspections did worse at their own job — they were not reliably detecting the specific local defects, such as crack indications, that the in-depth procedure is prescribed to find.
Two points of spread on a nine-point scale is the difference between fair and poor. It is the difference between a bridge that appears in the national deficient count and one that does not.
A 2026 study put 24 inspectors from six Indiana districts through simulated inspections in virtual reality, where the correct answer was known in advance. Only 30% of the assigned ratings matched the expected rating exactly.
Agreement depends entirely on how you define agreement
Phares and colleagues, 2004; Graybeal and colleagues, 2002; Huang and colleagues, 2026; Agrawal and colleagues, 2021.
That last bar is the balance. A New York study of 21 inspection teams found 96% of elements rated within one point of the median and concluded that consistency was good. It is the same kind of measurement reaching the opposite mood, because it moved the threshold. Ask for exact agreement and inspectors look unreliable; allow a point either way and they look fine. Neither framing is dishonest. The question is which threshold the decision actually needs, and a classification that turns on whether a component is a 4 or a 5 needs the strict one.
Fern Hollow: the rating was right and it did not matter
At 6:39 on the morning of 28 January 2022, the Fern Hollow Bridge carrying Forbes Avenue over a ravine in Pittsburgh dropped about 100 feet with a transit bus and several cars on it. Nine people were hurt. Nobody died, which was luck and the hour.
The bridge had been listed in poor condition since September 2011. Its superstructure was rated 5 from 2005 to 2011, then 4, and it held that 4 through the September 2021 inspection. For more than a decade the system said what it was built to say.
The National Transportation Safety Board published its final report in March 2024. The probable cause was the failure of a transverse tie plate on the southwest leg — a fracture-critical member — from corrosion and section loss, resulting from the city’s failure to act on repeated maintenance and repair recommendations in the inspection reports. Drains had clogged; water ran down the legs and pooled; the uncoated weathering steel never formed the protective patina it was designed to form.
Three things in that report are worth separating out, because they point in different directions.
First, the inspections were genuinely poor. Over more than fifteen years, contracted inspectors failed to clean corrosion before measuring it, failed to quantify the remaining material accurately, failed to rate the superstructure accurately, and failed to recommend a structural review of the legs. The legs were never consistently identified as fracture-critical, which would have forced hands-on inspection.
Second, the load rating arithmetic was wrong in a way that nothing on the condition scale would have caught. The rating had been cut to 26 tons in 2014. The bridge deck had been paved to roughly six inches of asphalt where the design called for three, and the paving records were not good enough for anyone to notice. Done correctly, accounting for the extra dead load and the corrosion, the NTSB engineer testified the rating would have come out below three tons, which would have required closing the bridge.
Third, and most uncomfortably: the condition rating did its job. It said poor for ten years. The failure was downstream of the measurement.
There is a coda. More than three years on, Pittsburgh has more city-owned bridges rated poor than it did at the time of the collapse — 25 against 21, out of roughly 80. City officials attribute much of that to far stricter inspection after 2022; an engineering professor quoted in the same reporting attributes it to deterioration outrunning repair. Both readings fit the number, and the number cannot separate them. Looking harder makes the inventory look worse, which is exactly what you would expect from a measure this sensitive to the observer.

What the rating is good for
None of this makes the National Bridge Inventory a bad instrument. It makes it a particular instrument, and the mismatch is between what it measures and what it gets quoted for.
It is a good funding queue. A component at 4 or below is work that needs money, and the classification exists to make that visible and comparable across 624,939 structures inspected by fifty different agencies. It is a reasonable deterioration tracker in aggregate, which is why the fair-condition half of the inventory is the honest headline.
It is a poor collapse predictor for any individual bridge, for three compounding reasons: it misses the dominant failure mode, it is assigned with two points of spread, and the thing that actually stops a bridge being used — the load rating and the posting decision — is a separate calculation that the condition number does not contain. Fern Hollow was posted at 26 tons with a poor rating. The arithmetic behind the 26 was the problem.
Two different questions, two different answers
Synthesis of the sources listed below.
Why the answer is not to avoid bridges
Put the numbers side by side. Roughly 6.6% of American bridges are in poor condition. Within the collapse literature, the estimated annual collapse rate for a structurally deficient bridge is about one in 1,200, and the overall hydraulic failure rate about one in 8,500. Those are per-structure-year figures, not per-crossing, and a crossing takes seconds.
The drive to the bridge is, by a wide margin, the larger risk in the trip. That is not a rhetorical flourish; it is the reason the profession spends its attention on inspection programmes and load postings rather than on advising the public to detour.
The useful reading of a poor rating, if you live near one, is not “this could go at any moment”. It is “this is on a list, and the question worth asking at a council meeting is whether anything has been done since it went on the list”. That is the question nobody asked in Pittsburgh for eleven years, and the answer was in the inspection reports the whole time.
Questions people ask
Is a bridge in poor condition safe to drive on?
It is open, which means the responsible agency has load-rated it and either posted a weight limit or determined it does not need one. Poor condition means a component is deteriorated enough to need repair or replacement. It is not a closure threshold; closure follows from the load rating, which is calculated separately.
Why did the number of deficient bridges drop suddenly around 2018?
The definition changed. The FHWA rule of January 2017 dropped two older tests — a low structural evaluation appraisal and an inadequate waterway opening — leaving only the condition-rating test. Comparisons across that line are comparing two different measures.
If inspections are subjective, why not just use sensors?
Structural health monitoring and non-destructive evaluation both exist and both work, and neither is deployed at 624,939-structure scale. The research consistently recommends them as a supplement that targets the bridges visual inspection has already flagged, not a replacement for a biennial walk-around.
Does an old bridge mean a dangerous bridge?
Partly, and it depends on the failure mode. Cook and Barr found that collapses caused by deterioration and by overload were age-related, while collapses caused by hydraulic action and by vehicle collision showed no age relationship at all. Scour does not care how old the deck is.
What actually changed after Fern Hollow?
The FHWA adopted an NTSB recommendation to resolve outstanding maintenance on uncoated weathering steel structures nationally, and the NTSB asked that the collapse be built into bridge inspection training. The updated National Bridge Inspection Standards took effect in 2022, and the inventory is currently moving from the old Coding Guide to the newer specification, a transition running through 2027.
The short version
- “Structurally deficient” was renamed “poor condition” in 2018 because the old phrase was read as a collapse warning. The test did not change: the lowest of deck, superstructure and substructure at 4 or below on a 0–9 scale.
- In 2026 that describes 41,148 of 624,939 bridges, about 6.6%. Half the inventory sits in fair.
- Among bridges that actually collapsed, 46% had been rated structurally deficient beforehand — so most had not. The label roughly triples a small risk rather than identifying the ones that will go.
- Scour is the leading cause of collapse at 55%. Of the bridges that collapsed from scour, 46.4% had been appraised as scour stable.
- The substructure condition rating predicted hydraulic collapse better than the purpose-built scour appraisal did.
- Condition ratings are assigned with about two points of spread between inspectors, which is the whole distance between fair and poor.
- Fern Hollow had been rated poor since 2011. The rating was not the failure. The load rating arithmetic and eleven years of inaction were.
This article summarises published research and public inspection data on bridge condition ratings in the United States. It is not an engineering assessment of any particular structure, and nothing here should be used to judge whether a specific bridge is safe to cross. Bridge condition data for any American bridge is public through the National Bridge Inventory; concerns about a specific structure belong with the agency that owns it.
Further reading: The Montalvo, Cook and Keeney paper is the one to read. The control group is the part that does the work — almost every other bridge-collapse study describes collapsed bridges without ever asking what the bridges that did not collapse looked like.
- Force, Henry Petroski (2022). How a safe structural design turns unsafe by small increments — the physics behind every sentence above.
- Noise, Daniel Kahneman, Olivier Sibony & Cass Sunstein (2021). Why two inspectors rating the same bridge can disagree, and what that does to a number meant to be a verdict.
- Doom, Niall Ferguson (2021). Why institutions built to prevent catastrophe so often fail to, in bridges as much as in pandemics.
Sources
- Federal Highway Administration. Bridge Condition by Highway System, 2026, and Tables of Frequently Requested NBI Information. National Bridge Inventory. Totals: 624,939 bridges; Good 268,737; Fair 315,054; Poor 41,148.
- Federal Highway Administration. Pavement and Bridge Condition Performance Measures final rule, January 2017 — the condition-rating test that replaced the older structurally deficient definition.
- Cook, W. and Barr, P. (2017). Observations and Trends among Collapsed Bridges in New York State. Journal of Performance of Constructed Facilities 31(4). 46% structurally deficient before collapse; estimated collapse rate about 1 in 1,200 annually; 57% of hydraulic collapses rated scour stable; age relationship present for deterioration and overload causes, absent for hydraulic and collision.
- Montalvo, C., Cook, W. and Keeney, T. (2020). Retrospective Analysis of Hydraulic Bridge Collapse. Journal of Performance of Constructed Facilities 34(1). Hydraulic causes 55% of collapses; annual hydraulic failure rate about 1 in 8,500; structural deficiency 44% versus 15% in controls; scour-critical 17% versus 6%; poor substructure condition 34% versus 11%.
- Montalvo, C. and Cook, W. (2017). A Retrospective Analysis of Hydraulic Bridge Collapse. 428 collapsed bridges, 1992–2014; 237 hydraulic; 46.4% of those appraised scour stable.
- Phares, B., Washer, G., Rolander, D., Graybeal, B. and Moore, M. (2004). Routine Highway Bridge Inspection Condition Documentation Accuracy and Reliability. Journal of Bridge Engineering 9(4). 49 inspectors from 25 states; 95% of primary element condition ratings within two points.
- Graybeal, B., Phares, B., Rolander, D., Moore, M. and Washer, G. (2002). Visual Inspection of Highway Bridges. Journal of Nondestructive Evaluation 21(3). About 68% of condition ratings within one point of the average; in-depth inspections unlikely to detect the local defects they are prescribed for.
- Huang, Y.-T. and colleagues (2026). Investigating Consistency among Bridge Inspectors Using Simulated Virtual Reality Testbeds. Journal of Bridge Engineering 31(2). 24 inspectors, six Indiana districts; 30% exact match with the expected rating.
- Agrawal, A., Washer, G., Alampalli, S., Gong, X. and Cao, R. (2021). Evaluation of the Consistency of Bridge Inspection Ratings in New York State. Journal of Infrastructure Systems 27(3). 21 inspection teams; 96% of elements within one point of the median.
- National Transportation Safety Board (2024). Collapse of the Fern Hollow Bridge, Pittsburgh, Pennsylvania, January 28, 2022. Highway Investigation Report HIR-24-02. Probable cause, contributing factors, load rating findings and the uncoated weathering steel recommendation.
- PublicSource (2025). Reporting on Pittsburgh city-owned bridges rated poor after the collapse: 25 against 21 of roughly 80.