American Football Injuries: What Gets Hurt, and the Rule Change That Worked
Key takeaways · 9 min read
- Football has the highest college competition injury rate: 39.9 per 1,000 athlete-exposures, against 15.0 for basketball and 6.8 for baseball.
- Most injuries are to the legs (lower limb 50.4%, knee 17.1%); head, face and neck are 4.3%, and concussions 7.4% of injuries.
- A game hour carries about seven times the risk of a practice hour (39.9 against 5.9 per 1,000).
- Moving the kickoff line five yards removed about four-fifths of the concussions on that play.
American football has the highest competition injury rate of any college sport: 39.9 injuries per 1,000 athlete-exposures, against 15.0 for basketball and 6.8 for baseball. It also has the clearest demonstration in all of sport that changing a rule changes the injury count — a single alteration to where a kickoff starts cut concussions on that play by about four-fifths, and left every other play alone.
Both of those facts belong on the same page. This is the third entry in the sports branch of this appendix: what actually gets injured, when, what has been measured to prevent it, and why the answer is a rule change rather than an exit.
What actually gets injured
Not the head, mostly. Across five seasons of NCAA surveillance, the lower limb accounted for 50.4 per cent of football injuries, the upper limb 16.9 per cent, the torso and pelvis 11.9 per cent, and the head, face and neck 4.3 per cent. The knee alone was 17.1 per cent — four times the whole head-face-neck region.
Concussions were 7.4 per cent of injuries in the same data. That figure and the 4.3 per cent above count different things — one classifies by body region and the other by diagnosis — so they should not be subtracted from one another. What both say, in different ways, is that the injury which has driven every rule change in the sport for two decades is not the injury that happens most.
Where football injuries land, by body region
NCAA injury surveillance, five seasons.
Source: NCAA injury surveillance, 2004–05 through 2008–09. The knee alone accounted for 17.1 per cent of all injuries.
That is not an argument for relaxing about concussion. It is the reason concussion gets the attention: it is the injury category where the damage is least visible at the time, least well repaired afterwards, and most plausibly cumulative. A torn knee ligament announces itself and is then treated. Nobody has ever needed a rules committee to notice a knee.
The severity mix is where football earns its reputation rather than the count. Across all college sport, 21.9 per cent of injuries cost seven days or more and 4.0 per cent needed surgery — and football carries the largest share of both, along with the largest share of injuries requiring emergency transport off the field. A sport can have a rate close to another sport’s and a much worse distribution of outcomes behind it, and football does.
It does mean, though, that a parent or a player thinking about football is thinking about a sport where half of what goes wrong is a leg. Football’s overall injury rate across games and practices was 8.1 per 1,000 athlete-exposures in that surveillance period, and 9.2 in the later national dataset — the highest of the twenty-five sports tracked, but in the same range as basketball’s 8.5.
Injury rate per 1,000 athlete-exposures, NCAA sports
Overall rate across practices and competitions, 2009–10 through 2013–14. One athlete-exposure is one athlete in one practice or one game.
Source: CDC, MMWR 64(48), 2015, college sports-related injuries, NCAA Injury Surveillance Program.
Two things about that chart are worth holding together. Football is the highest of the twenty-five sports, and the gap between it and basketball is 0.7 per 1,000 exposures — smaller than most people would guess. What separates football from everything else is not its overall rate. It is the shape of that rate, which the next section is entirely about.
When the risk concentrates
Here football is completely unlike the other two sports in this branch. Its competition rate is 39.9 per 1,000 exposures and its practice rate is 5.9. A player is close to seven times more likely to be hurt in a game hour than a practice hour. In basketball that ratio is about 2.2 and in baseball about 1.9.
The season has a shape too. The preseason injury rate was 9.7 per 1,000 exposures, against 7.5 in season and 4.2 in the postseason. Preseason is where the contact volume is highest and the conditioning lowest, and it is the part of the calendar a coaching staff has the most freedom to redesign.
Football injury rate by part of the season
Per 1,000 athlete-exposures, NCAA surveillance.
Source: NCAA injury surveillance, 2004–05 through 2008–09. Overall rate across the period 8.1 per 1,000.
Competition against practice, per 1,000 athlete-exposures
How much more costly a game hour is than a practice hour, in three sports.
| Sport | Competition | Practice | Ratio |
|---|---|---|---|
| Men’s football | 39.9 | 5.9 | 6.8x |
| Men’s basketball | 15.0 | 6.7 | 2.2x |
| Men’s baseball | 6.8 | 3.5 | 1.9x |
Source: CDC, MMWR 64(48), 2015. Ratios are calculated from the published rates.
A concentrated risk is, counter-intuitively, good news. A risk spread evenly across every hour of a sport can only be reduced by doing less of the sport. A risk that piles up on particular plays, particular weeks and particular practice formats can be reduced by changing those, and everything else stays as it was. Football’s distribution is the most lopsided of the three sports here, which is exactly why it has the best prevention result of the three.
And within a game, the concentration goes further still. The kickoff is a play on which two lines of players run at each other from a standing start over forty yards or more, and it produces concussions at a rate far above any other play type. In Ivy League football before 2016, concussions occurred on kickoffs at 10.93 per 1,000 kickoff plays. On all other play types combined, the rate was 2.56.
That is the kind of structure a rules committee can actually do something about, and in 2016 one did.
What has been measured to work
The Ivy League moved the kickoff line from the 35-yard line to the 40, and the touchback line from the 25 back to the 20. The first change puts the kicking team five yards closer, making it easier to kick the ball out of the end zone. The second makes a touchback less attractive to return. Together they were designed to produce more touchbacks and fewer returns, and they did: touchbacks went from 17.9 per cent of kickoffs to 48.0 per cent.
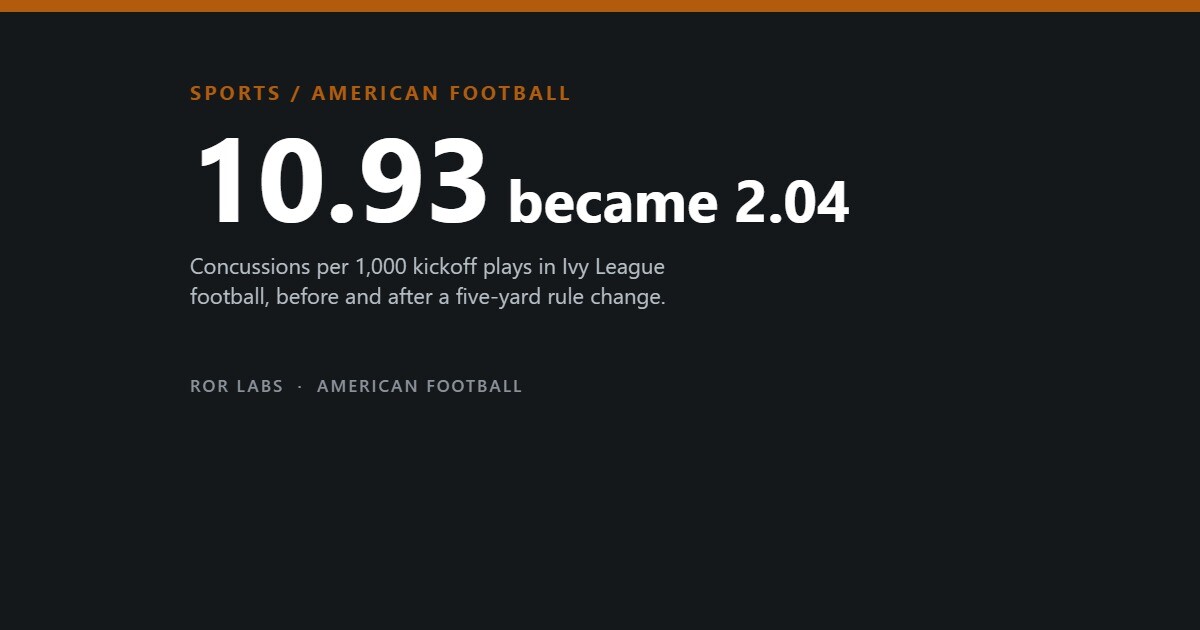
Concussions on kickoffs fell from 10.93 per 1,000 plays to 2.04 — a difference of 8.88 per 1,000, with a confidence interval running from 13.68 to 4.09. On every other play type, the rate went from 2.56 to 1.18, a change that was not statistically significant. The effect landed exactly where the rule was aimed and nowhere else, which is about as clean a natural experiment as injury prevention research ever gets.
Concussions per 1,000 plays, before and after the Ivy League kickoff rule
2013–2015 seasons against 2016–2017. 2,379 kickoff plays before, 1,467 after.
Source: Wiebe, D.J. et al., JAMA, 1 October 2018, doi:10.1001/jama.2018.14165. Difference on kickoffs −8.88 per 1,000, interval −13.68 to −4.09.
Five yards. No equipment, no new helmet technology, no change to how anyone tackles, and nothing asked of the players at all. The intervention was a line on a field, and it removed roughly four-fifths of the concussions on the most dangerous play in the sport.
It is worth being precise about what this study does and does not establish. It is a before-and-after comparison within one conference, not a randomised trial, and the seasons differ in more than the rule. But the control is built in: if something else had made Ivy League football safer over those years, it should have shown up on the other play types too, and it did not. That is why the paper landed where it did.
There is a second reason the kickoff was the right target, and it is mechanical rather than statistical. On most football plays the collision happens between players who started a few yards apart. On a kickoff both lines have been accelerating for thirty or forty yards when they meet, and kinetic energy scales with the square of speed. The play that produced the most concussions was the play with the most run-up, and the rule removed the run-up by removing the return.
The same logic has been applied to practice. The conference had already moved to eliminate full-contact hitting from regular-season practices, on the same reasoning that most of the exposure is not in games. Given that the practice injury rate is 5.9 against a competition rate of 39.9, the leverage there is smaller per hour and much larger in total hours.
Why the answer is not to stop
Football accounts for more injuries each year than any other college sport, and the largest share of the injuries that cost a week or more, that need surgery, or that require emergency transport. That is genuinely the worst record on the chart and it should be said without softening.
But part of why the raw count is so large is arithmetic that nobody quotes. In 2013–14 there were 71,291 college football players, 16.1 per cent of all NCAA athletes in the twenty-five sports tracked — more than any other sport by a wide margin. A sport with the most participants will produce the most injuries even at an average rate, and football’s rate is not average, but the count and the rate are two different arguments and only one of them is about how dangerous the game is.
The same is true of the comparison with other sports. Football’s 9.2 sits above basketball’s 8.5 by less than a point, and both sit below wrestling. If the question were simply which sport has the highest injury rate, the answer would be wrestling and the conversation would be somewhere else entirely. The reason football gets the scrutiny is not the rate but the severity mix behind it — and that is a fair reason, provided the two are not confused.
What the kickoff study demonstrates is the thing worth holding on to. The risk in football is not a fixed property of the sport. It is distributed very unevenly across plays, across parts of the season, and across practice formats, and where it concentrates it can be moved. A five-yard change to a line removed four-fifths of the concussions on the play that produced the most of them, and the game it was played in remained recognisably football.
The counter-argument that deserves an answer is the one about cumulative exposure rather than diagnosed injury — the concern that repeated sub-concussive head contact over many seasons matters even when no single event is recorded as a concussion. That question is not settled by the kickoff study or by anything else quoted on this page, and it is the reason the contact-practice rules exist alongside the game rules. What can be said is that every intervention aimed at diagnosed concussion also removes the sub-concussive contacts on those plays, because it removes the plays.
That is the argument for changing how the sport is played rather than for leaving it, and it is an argument with a measured result behind it rather than a hope.
This is a reference page, not medical advice. Any suspected concussion needs assessment by a qualified person before a return to play, and no table is a substitute for that.
Further reading: The Wiebe kickoff paper is two pages and worth reading in full — the built-in control on other play types is the part that makes it convincing, and it is easy to miss.
- Take Back the Game, Linda Flanagan (2022). The professionalization and physical toll of organized sport, including the injuries it produces.
- The Scout Mindset, Julia Galef (2021). On reasoning to see clearly rather than to defend a position — useful for a debate this contested.
- How to Read Numbers, Tom Chivers & David Chivers (2021). Common statistical traps — relative risk, small samples, confounding — explained through news examples.
Sources
- NCAA injury surveillance, football, 2004–05 through 2008–09. (Overall 8.1 injuries per 1,000 athlete-exposures; lower limb 50.4 per cent, upper limb 16.9, torso and pelvis 11.9, head, face and neck 4.3; knee alone 17.1; concussions 7.4 per cent of injuries; preseason 9.7, in season 7.5, postseason 4.2 per 1,000.)
- CDC, “College Sports-Related Injuries — United States, 2009–10 Through 2013–14 Academic Years”, MMWR 64(48), 2015. (Men’s football 9.2 per 1,000 overall, 39.9 in competition and 5.9 in practice, the highest competition rate of 25 sports; basketball 8.5, baseball 4.7, all sports 6.0; 71,291 football players in 2013–14, 16.1 per cent of NCAA athletes; football carries the largest share of injuries costing seven days or more, requiring surgery, or requiring emergency transport.)
- Wiebe, D.J., D’Alonzo, B.A., Harris, R. et al., “Association between the experimental kickoff rule and concussion rates in Ivy League football”, JAMA, published online 1 October 2018, doi:10.1001/jama.2018.14165. (Kickoff line moved from the 35 to the 40 and the touchback line from the 25 to the 20; 2,379 kickoff plays before and 1,467 after; concussions 10.93 against 2.04 per 1,000 kickoff plays, difference −8.88, interval −13.68 to −4.09; other play types 2.56 against 1.18, not significant; touchbacks 17.9 per cent against 48.0.)