
Trend summary
- Japan’s building fires rose in 2025 after several flat years, while deaths in those fires fell slightly. Two town fires that spread from block to block, at Wajima in 2024 and Saganoseki in Oita in 2025, have changed what the national fire agency is working on.
- Fire services recorded 22,345 building fires in calendar year 2025, up 6.5% on 2024 and the highest in the last ten years of national figures (Fire and Disaster Management Agency, FDMA, provisional).
- 1,171 people died in building fires in 2025, down from 1,199 in 2024. Most of them died at home: homes accounted for 53.4% of building fires but 86.9% of building fire deaths (FDMA, provisional).
- The Saganoseki fire of 18 November 2025 burned 196 buildings in a tightly packed fishing district of Oita City, with one death (FDMA and the land ministry, MLIT).
What the numbers show
The national source is the FDMA’s annual fire report, published first as provisional figures (概数, gaisū) in late spring and then as confirmed figures (確定値, kakuteichi) in the autumn of the following year. It counts by calendar year (January to December), not the fiscal year. The provisional 2025 report (in Japanese), released on 28 May 2026, counts 40,783 fires of all kinds, of which 22,345 were building fires (建物火災, tatemono kasai), up from 20,972 in 2024. Over the previous ten years the building fire count stayed between about 19,400 (2020) and 21,400 (2017), so 2025 is the highest in that run, and above the 22,197 of 2015. Fires in homes barely changed (11,929, up 0.8%). The larger increases were in shared-use buildings, apartment blocks and buildings classed as “other uses”, a group that more than doubled in a year that included the Saganoseki town fire.
Deaths moved the other way. Building fires killed 1,171 people in 2025, against 1,199 in the confirmed 2024 figures (in Japanese). Homes remain where people die: 1,018 of the 2025 building fire deaths were in houses and flats. Leaving out arson-suicides, 970 people died in home fires, and 730 of them (75.3%) were aged 65 or over. In buildings, the leading recorded causes in 2025 were cooking stoves (2,779 fires), electrical appliances (2,541), cigarettes (1,883) and plugs and cords (1,619). The 2025 figures are provisional and the FDMA says they may change as fire investigations finish.
What is driving it
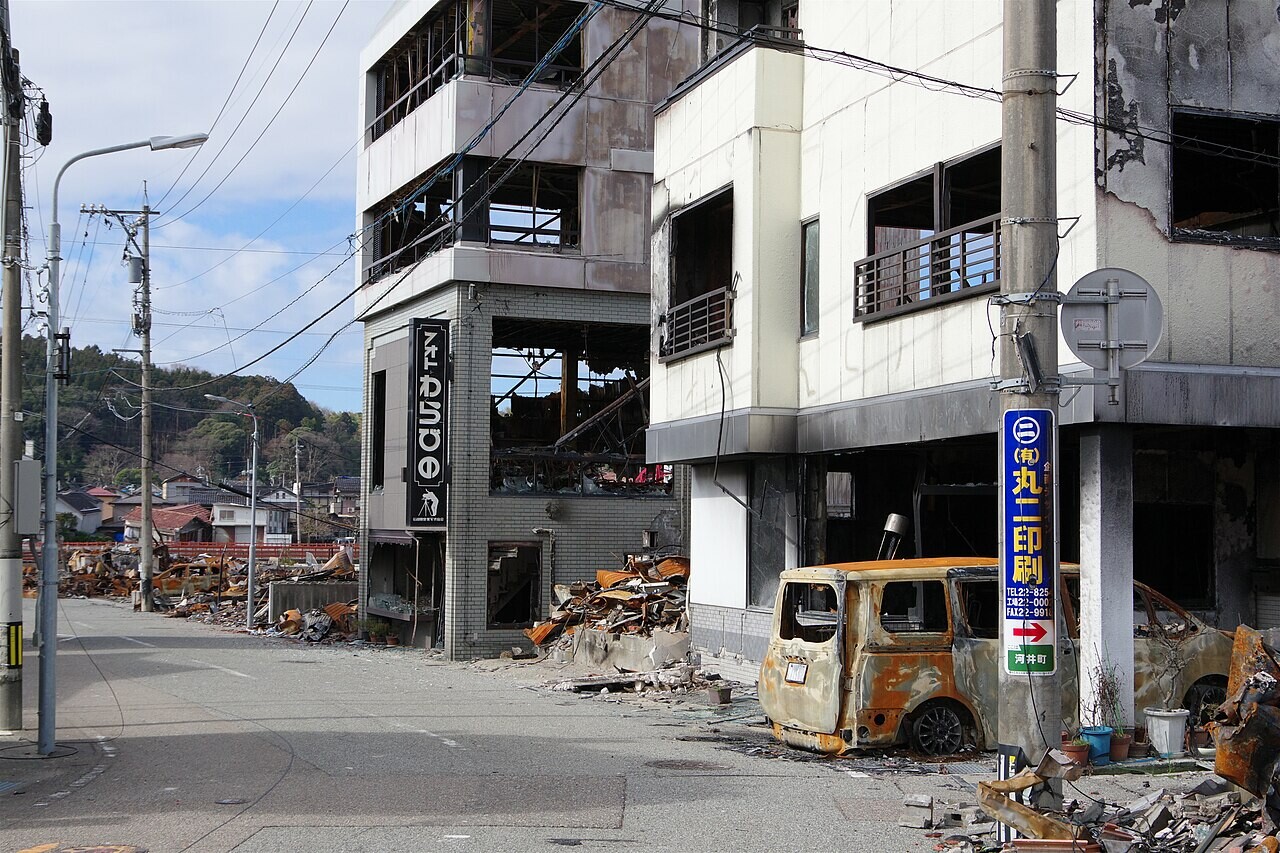
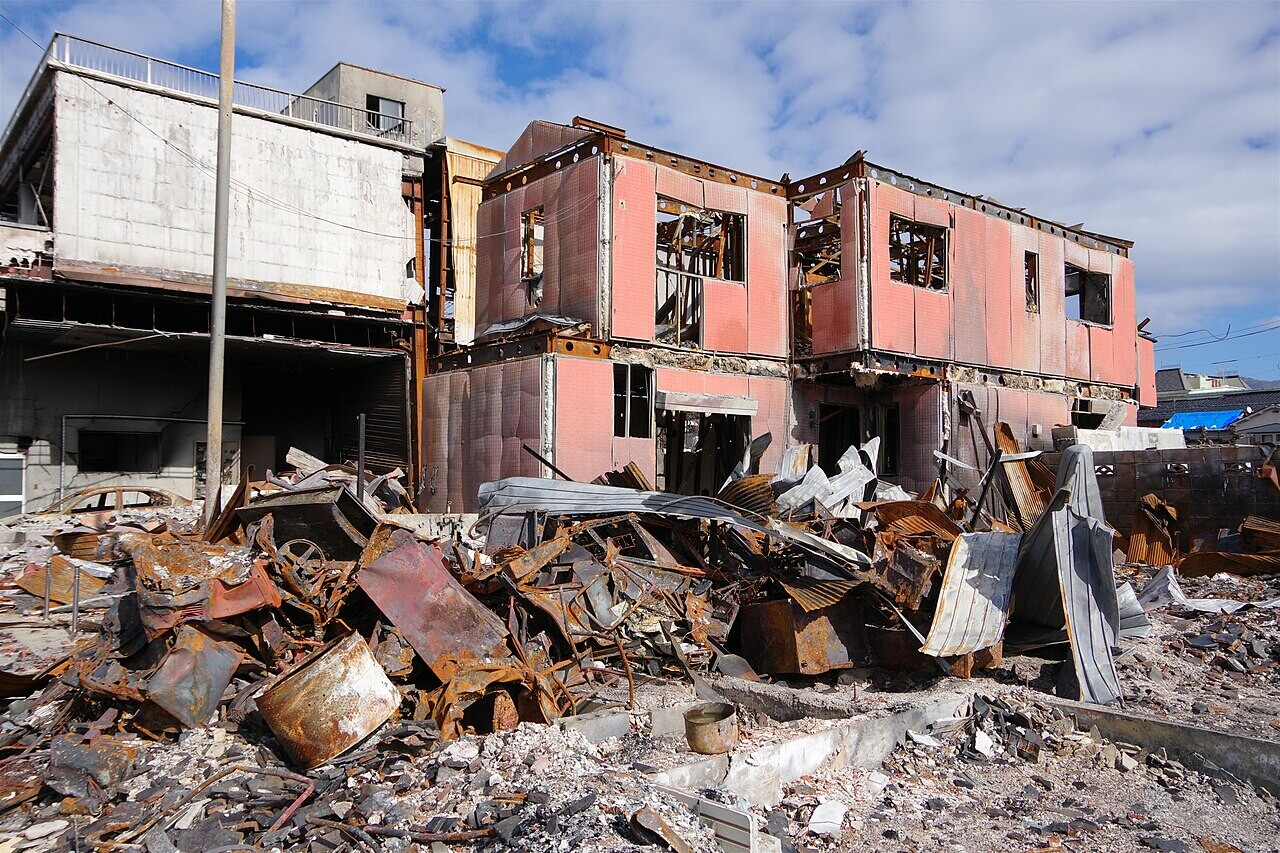
Two forces stand out. The first is an ageing population living in older wooden housing, often alone, which keeps home fire deaths high even as overall numbers fall. The second is the risk of fires spreading through whole districts of old, closely packed wooden buildings with narrow streets. After the earthquake on 1 January 2024, fire destroyed about 240 buildings around Wajima’s Asaichi morning market, and the FDMA and MLIT review of that fire (in Japanese) found that broken roads, damaged hydrants and tsunami warnings had held firefighters back. In Saganoseki in November 2025, the official review (in Japanese) found that strong winds carried embers between buildings in a crowded district of narrow lanes with many empty houses, some of them poorly maintained. The cause could not be found.
Deliberate fires in buildings with a single way out are a separate and deadly pattern. The 2019 Kyoto Animation arson killed 36 people, and after the arson at a clinic in Osaka’s Kitashinchi district in December 2021 the FDMA found that the only stairway and lift lay behind the point where the fire started. Its emergency inspections of 29,229 single-stairway multi-tenant buildings (in Japanese) found faults in evacuation routes at 13.3% of them. Newer risks are growing too. The FDMA counted 1,297 fires started by lithium-ion batteries in 2025 (in Japanese), more than double the 601 of 2022, and its 2026 prevention review covers fire protection for data centres and kitchen equipment (in Japanese).
The trend, 2015–2025
| Year | Fires | Change on year before |
|---|---|---|
| 2015 | 22,197 | – |
| 2016 | 20,991 | −5.4% |
| 2017 | 21,365 | +1.8% |
| 2018 | 20,764 | −2.8% |
| 2019 | 21,003 | +1.2% |
| 2020 | 19,365 | −7.8% |
| 2021 | 19,549 | +1.0% |
| 2022 | 20,167 | +3.2% |
| 2023 | 20,974 | +4.0% |
| 2024 | 20,972 | −0.0% |
| 2025p | 22,345 | +6.5% |
Notes: A building fire is one in which a building or its contents burned. 2025 is provisional (+6.5%).
Source: FDMA, White Paper on Fire Service (2016–2025 editions) and 2025 provisional fire release
Common questions
Are building fires in Japan going up or down?
In 2025 the figure was 22,345 fires (provisional). That is 0.7% higher than in 2015 (22,197) and 6.5% up on 2024.
Which year was highest and which was lowest?
In this 2015–2025 series the highest year was 2025 (22,345) and the lowest was 2020 (19,365).
Were there more fires overall in Japan in 2025?
Yes, on provisional figures. All fires rose to 40,783 and building fires to 22,345, the most in this 2015–2025 series. Final figures are due around November 2026.
Policy and budget changes
The main government measures and money figures behind this risk, newest first. Each item links to the official text we checked; where only a news report was available, the source says so.
Main policy changes
- 13 October 2026 Fire services told to step up checks in dense districts. After a shopping-street fire in Ise, Mie, on 31 August 2026 burned many buildings including empty houses and shops, the FDMA asked fire services to keep up fire safety guidance in high-risk wooden districts, act on poorly kept empty buildings and revise their firefighting plans. (FDMA)
- 27 March 2026 Fire prevention guideline for empty houses issued. Following the review of the November 2025 Oita City (Saganoseki) fire, the FDMA issued a guideline under which owners’ duty to manage empty houses in dense districts also covers preventing fire spread and flying embers, with orders under the Fire Service Act as a last resort. (FDMA)
- 16 December 2022 Evacuation guideline for single-stairway buildings. After the December 2021 arson at a clinic in Osaka’s Kita Ward, the FDMA issued a guideline on evacuation from buildings with only one direct stairway, including the use of fire-protected refuge areas and routine checks of fire doors and stairs. (FDMA)
- 11 July 2022 Stricter enforcement against fire code breaches. Following the expert review of the Osaka Kita Ward fire, the FDMA told fire services to carry out focused inspections of single-stairway buildings and to use warnings, orders and criminal referrals without hesitation against breaches found. (FDMA)
- 1 April 2015 Sprinklers required in small care facilities. The main provisions of an amended Order for Enforcement of the Fire Service Act (Cabinet Order No. 368 of 2013) came into force, extending sprinkler requirements to certain care and welfare facilities under 275 m² and automatic fire alarms to more small buildings. (FDMA)
Budget and costs
- August 2026 Fire agency asks for ¥29.3bn for FY2027. The Fire and Disaster Management Agency’s FY2027 budget request, published in August 2026, is ¥29.34 billion in the general account plus unquantified items, ¥16.34 billion (125.7%) more than the FY2026 initial budget. Subsidies for fire and disaster facilities stay at ¥1.37 billion. (Fire and Disaster Management Agency)
- 2025 Building fires caused ¥76.9bn of damage in 2024. The 2025 Fire White Paper records ¥76,875 million of damage from building fires in 2024, down from ¥82,040 million in 2023 (nominal). Building fires accounted for most of the ¥99,876 million total fire damage in 2024. (FDMA, Fire White Paper 2025 (table 1-1-9))
Recent cases
- 12 October 2026: a pre-dawn fire breaks out near a product warehouse at a plastics factory in Nakagawa, Tochigi; all 46 workers on site escape unharmed, but the blaze is still burning that night (Kyodo News via Kumamoto Nichinichi, in Japanese).
- 5 September 2026: three people die after a reported stabbing and a petrol fire at a cake shop in Motosu, Gifu Prefecture, where 11 people had gathered after closing. About 300 square metres of the two-storey steel-framed building burn (The Japan Times).
- 14 July 2026: Osaka police send papers to prosecutors on a man accused of starting the August 2025 Dotonbori fire with a carelessly thrown cigarette. The fire spread up two buildings through outdoor advertising signs, and two firefighters died. Some of the signs did not use the fire-resistant materials the building code requires (The Japan Times).
- 19 June 2026: fire breaks out in a fourth-floor music room at Takinogawa Daisan Elementary School in Kita Ward, Tokyo, injuring 11 people, eight of them children. Tokyo Fire Department sends 74 vehicles and rescues four people (FDMA, in Japanese).
Our read: what the numbers add up to
The two headline numbers point in opposite directions, and I think both are telling the truth. Building fires rose to 22,345 in 2025, up 6.5% and the highest in the ten years of national figures on the page, while deaths in building fires fell slightly, to 1,171 from 1,199. The rise, though, did not come from homes, where fires barely moved (11,929, up 0.8%). It came from shared-use buildings, apartment blocks and the “other uses” group, which more than doubled in a year that included the Saganoseki town fire. So part of the jump is likely to be one event rather than a new trend.
Read together with the death figures, this suggests that the number of fires and the number of deaths are driven by different things. Homes accounted for 53.4% of building fires but 86.9% of the deaths, and of the 970 people who died in home fires outside arson-suicides, 730 were aged 65 or over. Deaths follow older people living at home, often in older wooden housing. Fire counts, by contrast, are pushed around by district-wide spread in crowded old neighbourhoods and by newer ignition sources: lithium-ion battery fires reached 1,297 in 2025, more than double the 601 of 2022. Saganoseki itself makes the point, with 196 buildings burned and one death: enormously destructive, yet not what drives the national death toll.
All of the 2025 figures are provisional, and the FDMA says they may change as investigations finish; a fall in deaths this small could easily disappear in the confirmed count. What I would watch is whether the “other uses” category falls back in 2026, which would confirm the one-off reading, and whether battery fires keep climbing. My bottom line: more fires but fewer deaths is a fair summary for 2025, yet the deaths that matter most are still in ordinary homes.
Press releases and official reports, 2023–2026
Five key releases a year for the last four years, newest first. Most come from Japanese government ministries and agencies, regulators, accident investigators and national statistics; a few news reports are included where they are the clearest public record of an event. Many official releases are published only in Japanese; for those we give an English translation of the title and mark the link (in Japanese). Releases from 2007–2022 are in the expandable list after 2023.
2026
- 29 Jun 2026FDMA2026 study group on the future of fire prevention administration convened (data centres, digital inspections, kitchen equipment) (in Japanese)
- 19 Jun 2026FDMADamage from the fire in Kita Ward, Tokyo, and the response of fire services (3rd report) (in Japanese)
- 28 May 2026FDMAFires in Japan, January–December 2025 (provisional figures) (in Japanese)
- 27 Mar 2026FDMA / MLITReport of the review panel on fire and disaster measures following the large fire in Oita City (in Japanese)
- 27 Mar 2026FDMAFindings of the 2025 study group on fire prevention administration, including fire safety guidelines for unstaffed shops (in Japanese)
2025
- 19 Dec 2025FDMAReview panel on fire and disaster measures following the large fire in Oita City to be convened (in Japanese)
- 25 Nov 2025FDMAFires in Japan, January–December 2024 (confirmed figures) (in Japanese)
- 19 Nov 2025The Japan TimesMassive fire engulfs more than 170 buildings in Oita
- 30 Jul 2025FDMARevised technical standards for closed-type sprinkler heads and the Fire Service Act Enforcement Regulations published (in Japanese)
- 30 May 2025FDMAFires in Japan, January–December 2024 (provisional figures) (in Japanese)
2024
- 8 Nov 2024FDMAFires in Japan, January–December 2023 (confirmed figures) (in Japanese)
- 5 Jul 2024FDMA / MLITReport of the review panel on fire and disaster measures following the large fire in Wajima City (in Japanese)
- 12 Mar 2024FDMAReview panel on fire and disaster measures following the large fire in Wajima City to be convened (in Japanese)
- 25 Jan 2024The Japan TimesKyoto Animation arsonist given death penalty over 2019 mass murder
- 17 Jan 2024FDMAAmended Fire Service Act Enforcement Order published, aligning fire equipment rules with building code changes on fire-resistant structure (in Japanese)
2023
- 29 Nov 2023FDMAFires in Japan, January–December 2022 (confirmed figures) (in Japanese)
- 25 Oct 2023FDMAPublic consultation on a draft amendment to the Fire Service Act Enforcement Order (in Japanese)
- 5 Sep 2023The Japan TimesSuspect in 2019 Kyoto Animation arson attack admits setting blaze
- 20 Jul 2023FDMA2023 study group on the future of fire prevention administration convened (in Japanese)
- 31 Mar 2023FDMAFDMA Commissioner’s fire cause investigation report (summary) on the 2022 confectionery factory fire in Murakami, Niigata (in Japanese)
View 20 years of major Japanese building fire press releases (2007–2026)68 more from 2007–2022, up to five a year, newest first
2022
- 16 Dec 2022FDMAInterim report of the FDMA Commissioner’s fire cause investigation into the factory fire in Murakami, Niigata (in Japanese)
- 28 Oct 2022FDMAFires in Japan, January–December 2021 (confirmed figures) (in Japanese)
- 21 Jun 2022FDMAFDMA Commissioner’s fire cause investigation report on the building fire in Kita Ward, Osaka (in Japanese)
- 1 Mar 2022FDMASpring 2022 national fire prevention campaign (in Japanese)
- 28 Feb 2022FDMAResults of emergency inspections after the building fire in Kita Ward, Osaka (in Japanese)
2021
- 19 Dec 2021FDMAEmergency inspections ordered after the building fire in Kita Ward, Osaka (in Japanese)
- 17 Dec 2021The Japan Times24 confirmed dead in suspected case of arson in Osaka
- 5 Nov 2021FDMAAutumn 2021 national fire prevention campaign (in Japanese)
- 29 Oct 2021FDMAFires in Japan, January–December 2020 (confirmed figures) (in Japanese)
- 18 Jun 2021FDMAReport of the working group on home fire safety measures suited to the way older people live (in Japanese)
2020
- 15 Oct 2020FDMAFires in Japan, January–December 2019 (confirmed figures) (in Japanese)
- 29 May 2020FDMAReport on automatic kitchen fire suppression for small restaurants, with technical guidelines for simple systems (in Japanese)
- 31 Mar 2020FDMATrial app for inspecting fire protection equipment released (in Japanese)
- 24 Mar 2020FDMAFire drill manual for national treasure and important cultural property buildings, issued after the Shuri Castle fire (in Japanese)
- 28 Feb 2020FDMASpring 2020 national fire prevention campaign (in Japanese)
2019
- 4 Nov 2019The Japan TimesCrowdfunding drive in Japan to help rebuild Okinawa’s Shuri Castle raises over ¥250 million
- 6 Sep 2019FDMAFires in Japan, January–December 2018 (confirmed figures) (in Japanese)
- 3 Aug 2019The Japan TimesRe-examining 2001’s fatal Kabukicho blaze in the wake of the Kyoto Animation attack
- 12 Jul 2019FDMAApartment buildings built by Leopalace21 found not to comply with fire laws (in Japanese)
- 12 Apr 2019FDMAHomes supplied by Daiwa House Industry found not to meet fire protection standards (in Japanese)
2018
- 7 Aug 2018FDMAFires in Japan, January–December 2017 (in Japanese)
- 14 Jun 2018FDMAWorking group on in-house firefighting at very large buildings to be convened (in Japanese)
- 28 Mar 2018FDMAAmended Fire Service Act Enforcement Order published, requiring fire extinguishers in restaurants that use open flames, whatever their size (in Japanese)
- 15 Feb 2018The Japan TimesNew report highlights risks of fire and building collapse in central Tokyo following predicted megaquake
- 9 Feb 2018FDMAPublic consultation on a draft amendment to the Fire Service Act Enforcement Order (in Japanese)
2017
- 28 Jul 2017FDMAFires in Japan, January–December 2016 (in Japanese)
- 30 Jun 2017FDMAReport of the review panel on fire protection and firefighting after the warehouse fire in Miyoshi, Saitama (in Japanese)
- 19 May 2017FDMAReport of the review panel on the future of fire services after the large fire in Itoigawa City (in Japanese)
- 10 Mar 2017FDMAReview panel on fire protection and firefighting after the warehouse fire in Miyoshi, Saitama to be convened (in Japanese)
- 25 Jan 2017FDMAReview panel on the future of fire services after the large fire in Itoigawa City to be convened (in Japanese)
2016
- 8 Nov 2016FDMAAutumn 2016 national fire prevention campaign (in Japanese)
- 11 Oct 2016FDMAWorking group on evacuation guidance in facilities used by foreign visitors to be convened (in Japanese)
- 19 Aug 2016FDMAFires in Japan, January–December 2015 (in Japanese)
- 26 Feb 2016FDMASpring 2016 national fire prevention campaign (in Japanese)
- 24 Feb 2016FDMAPublic consultation on draft amendments to the Fire Service Act Enforcement Regulations and fire alarm transmitter standards (in Japanese)
2015
- 6 Nov 2015FDMAAutumn 2015 national fire prevention campaign (in Japanese)
- 16 Jul 2015FDMAFires in Japan, January–December 2014 (confirmed figures) (in Japanese)
- 31 Mar 2015FDMAReport of the panel on preventing electrical fires in large earthquakes (in Japanese)
- 30 Mar 2015FDMAReport of the working group on technical standards for fire-using equipment (in Japanese)
- 27 Feb 2015FDMAAmended ordinances on fire safety equipment for specified apartment buildings published (in Japanese)
2014
- 16 Oct 2014FDMAAmended Fire Service Act Enforcement Order published, revising rules for sprinklers, extinguishers and automatic fire reporting (in Japanese)
- 25 Jul 2014FDMAFire safety compliance marks for buildings start to be displayed (in Japanese)
- 23 Jul 2014FDMAFires in Japan, January–December 2013 (confirmed figures) (in Japanese)
- 4 Jul 2014FDMAReport on fire safety measures for clinics with beds and hospitals (in Japanese)
- 28 Mar 2014FDMAFire safety self-check system for clinics with beds launched (in Japanese)
2013
- 19 Dec 2013FDMAPublic naming of buildings with serious fire code violations begins (in Japanese)
- 6 Sep 2013FDMAReport on fire safety measures for group homes for older people with dementia (in Japanese)
- 31 Jul 2013FDMAFires in Japan, January–December 2012 (confirmed figures) (in Japanese)
- 17 Jul 2013FDMAReport of the working group on hotel fire safety (in Japanese)
- 28 May 2013FDMAFire cause investigation findings on the hotel fire in Fukuyama, Hiroshima (in Japanese)
2012
- 2012 ed.FDMAFire White Paper 2012: fire safety measures after the Fukuyama hotel fire (in Japanese)
- 2012 ed.FDMAFire White Paper 2012: strengthening fire and disaster management in multi-tenant buildings (in Japanese)
- 2012 ed.FDMAFire White Paper 2012: inspections and correcting violations (in Japanese)
2011
- 2011 ed.FDMAFire White Paper 2011: fires caused by the Great East Japan Earthquake (in Japanese)
- 2011 ed.FDMAFire White Paper 2011: fire safety in small facilities (in Japanese)
- 2011 ed.FDMAFire White Paper 2011: fire safety inspections (in Japanese)
2010
- 2010 ed.FDMAFire White Paper 2010: fire safety in small facilities (in Japanese)
- 2010 ed.FDMAFire White Paper 2010: buildings subject to fire regulations (in Japanese)
2009
- 2009FDMAMajor fires of 2009 (Fire White Paper, 2010 edition) (in Japanese)
- 2009 ed.FDMAFire White Paper 2009: fire safety measures after the private video booth fire in Naniwa Ward, Osaka (in Japanese)
- 2009 ed.FDMAFire White Paper 2009: fire safety measures after the care home fire in Shibukawa, Gunma (in Japanese)
- 2009 ed.FDMAFire White Paper 2009: fire safety in small facilities (in Japanese)
2008
- 28 Oct 2008The Japan TimesA peep at video parlors
- 2008FDMAMajor fires of 2008 (Fire White Paper, 2009 edition) (in Japanese)
- 2008 ed.FDMAFire White Paper 2008: in-house firefighting capacity at large and high-rise buildings (in Japanese)
- 2008 ed.FDMAFire White Paper 2008: fire safety in group homes and other small facilities (in Japanese)
- 2008 ed.FDMAFire White Paper 2008: fire safety inspections (in Japanese)
2007
- 2007FDMAMajor fires of 2007 (Fire White Paper, 2008 edition) (in Japanese)
Some early years list fewer than five items. Many older Japanese government releases are no longer online at their original addresses, and we only list items we could find and check.
Photo list
How this page is built. Figures come from the official statistical releases linked above; where agencies publish provisional numbers we say so, because they are revised. Japanese statistics often use the fiscal year (April to March) and some are published only in Japanese, so we say which period each figure covers and translate titles. Photos are public-domain or Creative Commons images credited in each caption; file photos are illustrative and are not from the events described unless the caption says so. This page tracks trends and is not personal safety, medical, legal or financial advice.