Baseball Injuries: What Gets Hurt, and the Schedule That Decides It
Key takeaways · 10 min read
- Baseball’s college injury rate is 4.7 per 1,000 athlete-exposures, against 6.0 across all twenty-five sports tracked.
- In a ten-year study of 481 young pitchers, 25 (5.0%) had surgery or gave up throwing because of injury.
- Pitching more than 100 innings in a year raised the odds of serious injury by a factor of 3.5; a curveball before age thirteen showed no clear effect (odds ratio 1.6, interval 0.60 to 4.47).
- Most of the risk comes from volume decisions that adults make, not from the game itself.
Start with the number that almost nobody quotes. Across five academic years of college sport, baseball had an injury rate of 4.7 per 1,000 athlete-exposures. The average across all twenty-five sports tracked was 6.0. Football was 9.2 and basketball 8.5. Baseball is, by the most consistent surveillance data available, one of the safer team sports a person can play.
That is the honest headline, and it is not the reason this page exists. Baseball has a specific, well-documented injury problem that the overall rate hides completely, because it falls on one position, accumulates over years rather than in a moment, and is produced almost entirely by decisions adults make with a calendar.
This is the first entry in a new branch of this appendix: what actually gets injured in a sport, when the risk concentrates, what has been measured to prevent it, and why none of that adds up to a reason to stop playing.
What actually gets injured
Injury rate per 1,000 athlete-exposures, NCAA sports
Overall rate across practices and competitions, 2009–10 through 2013–14. One athlete-exposure is one athlete in one practice or one game.
Source: CDC, MMWR 64(48), 2015, college sports-related injuries, NCAA Injury Surveillance Program.
Roughly 45 per cent of all college sport injuries are sprains or strains, and baseball follows that pattern for most of the roster. Ankles roll on the bases, hamstrings go on the sprint to first, wrists and fingers get hit. Those injuries are ordinary, they are what the 4.7 figure is mostly made of, and they resolve.
The rate also splits the way every sport’s does. Baseball’s competition rate was 6.8 per 1,000 exposures and its practice rate 3.5 — games are about twice as costly per hour on the field. But a season contains far more practices than games, and across all college sport 63.8 per cent of injuries happened in practice for that reason alone. Where the injuries are is not the same question as where the risk per hour is, and the two answers point in opposite directions.
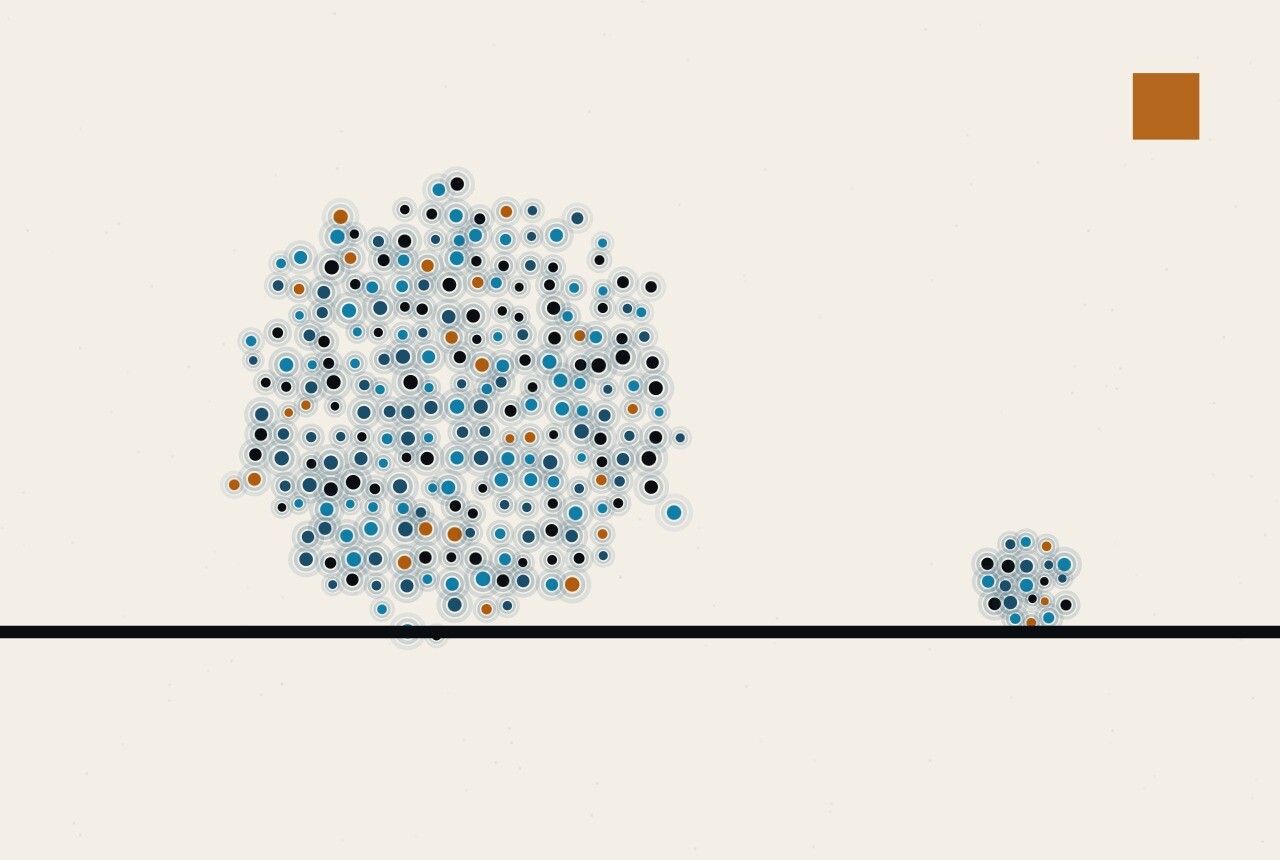
The arm is different. A ten-year prospective study followed 481 pitchers who were nine to fourteen years old when they enrolled, and tracked what happened to them through adolescence. By the end, 25 of the 481 — 5.0 per cent — had either had surgery or given up throwing because of injury. Three had elbow surgery, seven had shoulder surgery, and fourteen retired from throwing without an operation. The average age at which it happened was 17.6.
Five per cent over a decade is not an epidemic, and the study’s authors were careful not to present it as one. But it is a very different shape of risk from a rolled ankle. It is cumulative, it usually ends a playing career rather than costing a fortnight, and it lands on the one position in the sport that repeats a single violent movement several hundred times a week.
What happened to 481 youth pitchers over ten years
Enrolled at ages 9 to 14 and followed to a mean injury age of 17.6.
Source: Fleisig, G.S. et al., American Journal of Sports Medicine 38(12), 2010, 2426–2432. Cumulative incidence 5.0 per cent, 25 of 481.
When the risk concentrates
The same ten-year study tested which childhood habits predicted that outcome, and the answer was unambiguous. Pitching more than 100 innings in a single year raised the odds of serious injury by a factor of 3.5. Nothing else in the model reached significance.
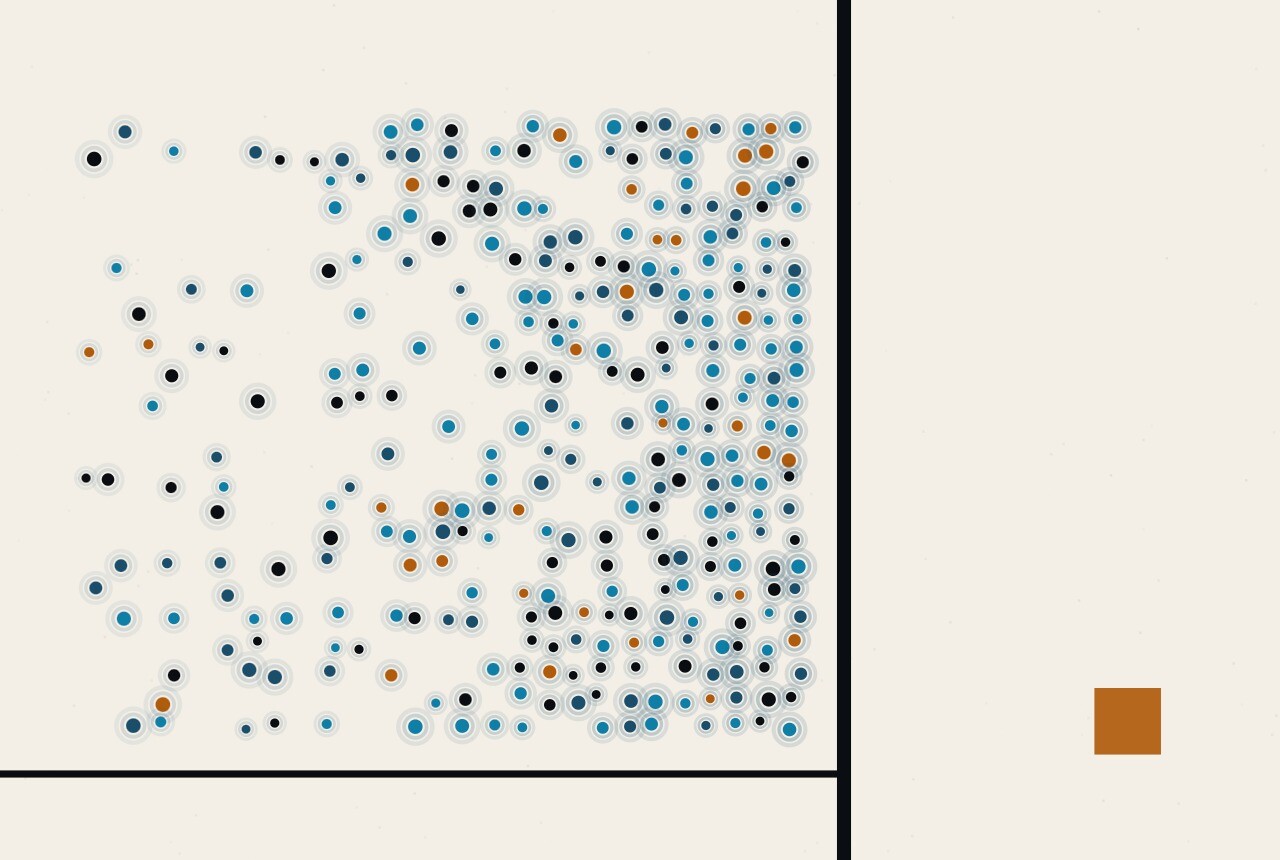
That includes the habit parents worry about most. Throwing a curveball before the age of thirteen carried an odds ratio of 1.6, with a confidence interval running from 0.60 to 4.47 — an interval that comfortably includes no effect at all. The breaking ball has been the folk villain of youth baseball for forty years, and the best prospective data on the question cannot find it. What the data can find is volume: innings, months, pitches, and above all whether the young pitcher keeps going after the arm has stopped working properly.
A separate case-control study compared 95 adolescent pitchers who had needed elbow or shoulder surgery against 45 who had never had a significant arm injury, and quantified the habits that separated them. The injured group had pitched eight months a year against five and a half; 88 pitches a game against 66; roughly 2,562 pitches a year against 1,269. They had attended 3.9 showcase events against 1.0.
What separated 95 injured adolescent pitchers from 45 uninjured ones
Odds ratios from multivariable analysis. Bars are on a logarithmic scale.
Source: Olsen, S.J. et al., American Journal of Sports Medicine 34(6), 2006, 905–912. Confidence intervals: fatigue 5.92–221.22; months 1.39–18.32; pitches 1.36–10.77; velocity 0.94–7.02.
The top bar deserves a caveat rather than a headline. An odds ratio of 36 with an interval running from 6 to 221 is telling you that the effect is large and that the study was nowhere near big enough to say how large. Fifty-two per cent of the injured pitchers said they routinely pitched with a tired arm, against 11 per cent of the uninjured ones. The direction is not in doubt; the magnitude is a wide guess.
Two of the differences between those groups are not in the bars at all. Sixty-seven per cent of the injured pitchers reported pitching despite arm pain, against 42 per cent of the uninjured. And the injured group threw 34 warm-up pitches before an outing against 26 — more preparation, not less, which is a useful reminder that the total is what counts and warm-up pitches are part of the total.
The velocity finding is the awkward one. The injured group threw 88.3 miles per hour on average against 82.7, with an odds ratio of 2.58 whose interval just crosses one. Throwing hard is the thing every pitcher is being coached, scouted and paid to do more of, and it is also associated with getting hurt. There is no version of that sentence that resolves into advice. It is simply the trade the sport is built on, and it is better stated than hidden.
Read the four bars together and a pattern emerges that has nothing to do with technique. Every one of them is a scheduling decision. How many months, how many pitches, whether to leave him in. Those are made by adults holding a fixture list, and mostly they are made one game at a time, which is precisely why they add up.
What has been measured to work
Two interventions in baseball have been tested properly, and they are worth putting side by side because they represent the two honest categories: the one where the evidence is a controlled comparison, and the one where the evidence is a plausible rule built on risk-factor studies.
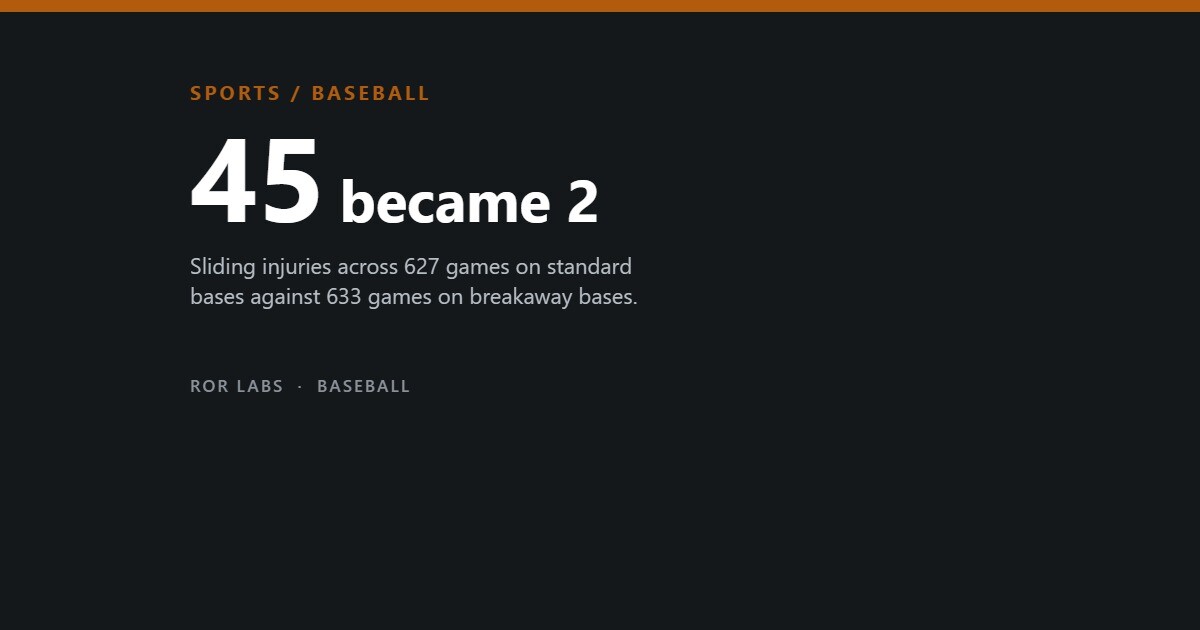
The controlled comparison is about bases. In 1988 a prospective study ran one recreational softball season on fields fitted with standard stationary bases and a parallel season on fields fitted with breakaway bases — bases held to the ground by rubber grommets that release when a sliding runner hits them. Across 627 games on stationary bases there were 45 sliding injuries. Across 633 games on breakaway bases there were two. That is one injury every 13.9 games against one every 316.5.
The cost side was equally stark: about $55,050 in medical charges for the stationary-base injuries against about $700 for the breakaway ones, and a set of breakaway bases cost $95 more than a set of standard ones. An equipment change that nobody notices while playing removed almost the entire injury category it was aimed at. Breakaway bases are now standard in much of organised softball and baseball, and the reason is that single study.
Sliding injuries, standard bases against breakaway bases
One prospective season on each, matched fields.
Source: Janda, D.H. et al., JAMA 259(12), 1988, 1848–1850.
The second intervention is the pitch count, and its evidence is weaker in kind. Nobody has randomised children to pitch 120 times or 60 times a game and watched what happened to their elbows, and nobody is going to. What exists instead is the set of risk-factor studies above, converted into limits by Major League Baseball and USA Baseball as the Pitch Smart guidelines.
Pitch Smart daily maximum pitch counts
With required days of rest above each threshold.
| Age | Daily maximum | 4 days’ rest required above |
|---|---|---|
| 7–8 | 50 pitches | — (2 days above 35) |
| 9–10 | 75 pitches | 66 pitches |
| 11–12 | 85 pitches | 66 pitches |
| 13–14 | 95 pitches | 66 pitches |
| 15–16 | 95 pitches | 76 pitches |
| 17–18 | 105 pitches | 81 pitches |
| 19–22 | 120 pitches | 81 pitches |
Source: MLB and USA Baseball, Pitch Smart pitching guidelines.
Alongside the counts sit the guidelines that map directly onto the risk factors: take at least four months off from throwing every year with two to three of them continuous, do not exceed 80 innings pitched in any twelve-month period at ages nine to twelve, never pitch on three consecutive days, avoid catching when not pitching, and do not play for two teams at once. Read them next to the Olsen odds ratios and they are almost a line-by-line answer.
One more finding points the same way. In the ten-year study, having played catcher for three or more seasons carried an odds ratio of 2.7 for serious arm injury, with an interval of 0.93 to 8.19 — suggestive rather than established. Catcher is the other position that throws several hundred times a session, and Pitch Smart tells young pitchers to avoid it on days they are not pitching. The guideline runs slightly ahead of the evidence, in the direction the evidence points.
These are rules built on observational evidence, and they should be described that way. They are also the most sensible thing available, they cost nothing, and the one thing that would make them work better is the least technical item on the list — stopping when the arm is tired.
Why the answer is not to stop
It is worth restating where baseball sits. Its overall injury rate is below the average for college sport and roughly half of football’s. Most of what happens is a sprain that costs a week. Sixty-four per cent of all college sport injuries happen in practice rather than competition, which is also where most of the hours are.
The arm problem is real, and it is the clearest case in sport of a risk that is manufactured rather than inherent. A nine-year-old throwing a baseball is not in danger. A nine-year-old throwing on two teams across eleven months of the year, at showcases, while tired, is in a different situation entirely — and every element of that situation was chosen by someone else.
It is also worth keeping the severity in view. Across all college sport, 21.9 per cent of injuries cost seven days or more before a return to full participation and 4.0 per cent needed surgery. The overwhelming majority of what happens in a baseball season is a player sitting out for a few days. The 5 per cent of young pitchers in the ten-year study were not a slice of that population — they were a different outcome reached by a different route.
Which is the useful way to read all of it. The question is not whether the game is safe. The question is which of the decisions around it are yours, and in youth baseball an unusually large share of them are: how many months, how many pitches, which weekend to skip, and whether the answer to “my arm is tired” is one more inning.
This is a reference page, not medical advice. Arm pain in a young thrower is a reason to see a doctor, not a reason to consult a table.
Further reading: The Fleisig ten-year study and the Olsen case-control study are best read as a pair — one asks what happens, the other asks what preceded it, and they were run by overlapping groups on overlapping populations.
- Take Back the Game, Linda Flanagan (2022). The youth-sports culture and calendar behind overuse injuries like the ones pitch counts try to prevent.
- Noise, Daniel Kahneman, Olivier Sibony & Cass Sunstein (2021). On unwanted variability in expert judgment — relevant to how differently coaches read the same pitch count.
- The Scout Mindset, Julia Galef (2021). On reasoning to see clearly rather than to defend a position.
Sources
- CDC, “College Sports-Related Injuries — United States, 2009–10 Through 2013–14 Academic Years”, MMWR 64(48), 2015. (1,053,370 injuries over 176.7 million athlete-exposures; baseball 4.7, basketball 8.5, football 9.2, all sports 6.0, wrestling 13.1, swimming and diving 1.7 per 1,000; 63.8 per cent of injuries in practice; about 45 per cent sprains or strains; 21.9 per cent costing seven days or more; 4.0 per cent requiring surgery.)
- Fleisig, G.S., Andrews, J.R., Cutter, G.R. et al., “Risk of serious injury for young baseball pitchers: a 10-year prospective study”, American Journal of Sports Medicine 38(12), 2010, 2426–2432. (481 pitchers aged 9–14; 25 injured, 5.0 per cent; 3 elbow and 7 shoulder operations, 14 retirements; mean injury age 17.6; more than 100 innings a year OR 3.5, 1.16–10.44; curveball before 13 OR 1.6, 0.60–4.47.)
- Olsen, S.J., Fleisig, G.S., Dun, S., Loftice, J. and Andrews, J.R., “Risk factors for shoulder and elbow injuries in adolescent baseball pitchers”, American Journal of Sports Medicine 34(6), 2006, 905–912. (95 injured against 45 uninjured; fatigue OR 36.18, 5.92–221.22; more than 8 months a year OR 5.05; more than 80 pitches a game OR 3.83; 52 versus 11 per cent regularly pitching tired.)
- Janda, D.H., Wojtys, E.M., Hankin, F.M. and Benedict, M.E., “Softball sliding injuries: a prospective study comparing standard and modified bases”, JAMA 259(12), 1988, 1848–1850. (627 games on stationary bases, 45 injuries; 633 games on breakaway bases, 2; $55,050 against $700 in medical charges; $95 extra per base set.)
- Major League Baseball and USA Baseball, Pitch Smart pitching guidelines. (Daily maximum pitch counts and required rest by age; four months off a year with two to three continuous; 80 innings maximum in twelve months at ages 9–12; no pitching on three consecutive days.)