A Teenager Would Need Sixty-Three More Hours of Screen Time a Day to Move Their Wellbeing Half a Standard Deviation.
Key takeaways · 12 min read
- Across three datasets and 355,358 adolescents, technology use explained at most about 0.4% of the variation in wellbeing, median β between −0.01 and −0.04.
- That association was about the same size as the one for regularly eating potatoes, and smaller than the one for wearing glasses.
- Remembered screen time correlates with a time-use diary of the same day at r = .18 in the UK and Ireland, and .05 to .08 in the US.
- Specifications using remembered screen time produced the most negative results in every dataset.
Ask most parents what is damaging teenagers and screens will be near the top of the list. The belief is strong enough to have produced school phone bans, national guidelines and a whole product category. It rests on a research literature that is genuinely enormous — and on an effect that, when three of the largest datasets in the world were analysed with every reasonable method at once, came out about the same size as the association between misery and eating potatoes.
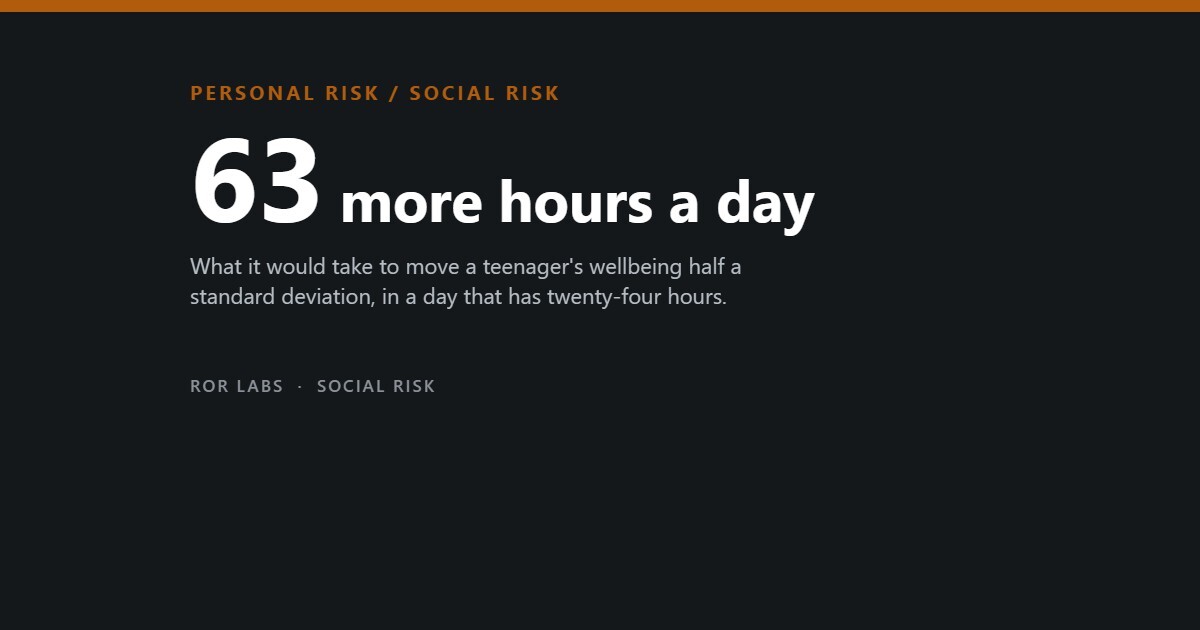
The team that produced that comparison then went further. They stopped asking teenagers to remember how long they had spent on screens and used time-use diaries instead, ran a preregistered confirmatory test, and worked out what the effect would mean in hours. To move a teenager’s wellbeing by half a standard deviation you would need to add sixty-three hours and thirty-one minutes of screen time to their day.
Other researchers have re-run the same analysis on the same data and reached a different conclusion, and one of the largest single studies in the field does find a substantial association for girls. Both things are in this article. What is not in dispute is that the number everyone argues about is far smaller than the argument.

The analysis that started the row
In 2019 Amy Orben and Andrew Przybylski published a specification curve analysis in Nature Human Behaviour. The technique exists because of a specific problem: when a dataset is large and the analyst has many defensible choices — which wellbeing scale, which technology measure, which controls — the same data can produce almost any answer. Specification curve analysis runs all the defensible combinations and shows the whole distribution rather than the one the analyst liked.
Across three large adolescent datasets totalling 355,358 respondents, the median standardised association between technology use and wellbeing sat between −0.01 and −0.04, explaining at most about 0.4 per cent of the variation in how adolescents said they were doing.
The comparison that made the paper famous was placing that number beside other variables sitting in the same datasets. The association between poor wellbeing and regularly eating potatoes was nearly as negative as the association with technology use. Wearing glasses was more negative. Being bullied, in the same data, was several times larger.
How large the technology association is, next to things in the same datasets
Specification curve analysis across three large adolescent datasets, 355,358 respondents. Standardised association with wellbeing.
Source: Orben, A. and Przybylski, A.K., “The association between adolescent well-being and digital technology use”, Nature Human Behaviour 3, 2019, pp.173–182.
Then they measured screen time properly
Almost everything in this literature depends on asking adolescents to estimate their own screen time, usually for a typical week, retrospectively. That measure has been known to be poor for years. The follow-up study tested how poor.
Using nationally representative cohorts from Ireland, the United States and the United Kingdom — 17,247 adolescents after exclusions — the researchers compared each teenager’s remembered screen time against a time-use diary they filled in for a specific assigned day. In the Irish and British data the two correlated at r = 0.18. In the American data, r = 0.08 for a weekday and r = 0.05 for a weekend day.
Two measures correlating at 0.18 are not two readings of the same quantity. And the discrepancy is not neutral: in every dataset, the specifications using remembered screen time produced the most negative associations with wellbeing. The worse the measure, the worse screens looked.
Remembered screen time against a diary of the same day
Correlation between retrospective self-report and time-use-diary estimates of digital engagement, by dataset. 17,247 adolescents.
Source: Orben, A. and Przybylski, A.K., “Screens, teens, and psychological well-being: evidence from three time-use-diary studies”, Psychological Science 30(5), 2019, pp.682–696.
The preregistered test, and what it did to the hypotheses
The two smaller datasets were used to generate hypotheses; the British cohort was used to test them, with the analysis plan registered publicly before the data were released. Five hypotheses went in. The researchers also declared in advance what would count as an effect worth discussing: a correlation of 0.10, meaning the association would have to explain at least 1 per cent of the variation in wellbeing.
Remembered screen time did associate negatively with wellbeing, at a median standardised coefficient of −0.08 — below the threshold, with a confidence interval that touched it. Time actually recorded in the diary associated at −0.02, explaining about a tenth of one per cent.
The two bedtime hypotheses did not merely fail. Using a screen in the thirty minutes and the hour before bed on a school night came out positively associated with wellbeing. And the fifth hypothesis — that the negative associations would shrink once you controlled for confounders, the usual reassurance offered about this literature — was not supported either. Adding controls pulled the extreme results in from both ends.
Five preregistered hypotheses, tested on the British cohort
Median standardised coefficients. The threshold set in advance for a practically meaningful effect was r = 0.10.
Source: Orben and Przybylski, Psychological Science 30(5), 2019. Retrospective self-report median β = −0.08, partial r² = .008; diary time spent β = −0.02, partial r² = .001. Preregistration at the Open Science Framework.
What the number means in hours
Standardised coefficients are hard to feel. So the authors converted theirs into the currency the debate is actually conducted in, which is time.
Half a standard deviation is a common rule of thumb for a change a person would notice in themselves. Working from the median effect in the British cohort, a teenager would have to add 63 hours and 31 minutes of screen time per day to move their wellbeing by that much. A day has 24.
That is the median specification, and it is fair to ask about the worst case rather than the middle one. Taking the single specification with the largest effect anywhere in the analysis, the figure falls to 11 hours and 14 minutes of additional screen time per day. Still more waking hours than most teenagers have spare, and that is the most alarming number the dataset can be made to produce.
How much extra screen time a day would be needed to move wellbeing by half a standard deviation
Derived from the Millennium Cohort Study analysis. Half a standard deviation is a conventional threshold for a change someone would notice.
Source: Orben and Przybylski, Psychological Science 30(5), 2019, discussion and supplemental material.
The case on the other side
Three serious objections stand against all of this, and none of them is a quibble.

The first is that lumping everything into “screen time” buries the thing people are worried about. In 2018 a study of 10,904 fourteen-year-olds in the same British cohort looked specifically at social media and separated girls from boys. Compared with one to three hours of daily use, girls using social media three to under five hours had depressive symptom scores 26 per cent higher, and those using it five hours or more, 50 per cent higher. For boys the figures were 21 and 35 per cent. The study also traced the pathways: heavier use was linked to online harassment, poor sleep, low self-esteem and body dissatisfaction, and each of those to higher depressive scores.
The second is a direct challenge to the specification curve itself. In 2022 Jean Twenge, Jonathan Haidt and colleagues re-ran the analysis on the same three datasets. They reproduced the original result exactly under the original settings, then changed four choices: separating social media from television, separating girls from boys, excluding likely mediators from the control set, and stopping one multi-subscale questionnaire from dominating the others. Under those constraints they concluded that social media use is linked to poor mental health, especially among girls.
The third is statistical. A separate group has argued that the median of a specification curve can carry substantial bias and variance because it gives weight to implausible control specifications, and that averaging across heterogeneous specifications can mask real effects in particular subgroups. They propose a Bayesian version and report that it recovers associations for certain technologies which the median hides.
Same three datasets, four different analytical choices
What changes when the specification space is constrained differently.
Source: Twenge, J.M., Haidt, J., Flórez Lozano, J.A. and Cummins, K., “Specification curve analysis shows that social media use is linked to poor mental health, especially among girls”, Acta Psychologica 224:103512, 2022.
Which way the arrow points
Every study above is a snapshot. They can show that heavier users report worse wellbeing; none of them can say which came first. That question needs the same people measured repeatedly, and it has been asked.
A 2019 study followed 594 adolescents annually for two years and 1,132 undergraduates annually for six. In both samples, social media use did not predict later depressive symptoms — not for males, not for females. What it did find ran the other way: among adolescent girls, greater depressive symptoms predicted more frequent social media use later on.
That is one longitudinal study against a great many cross-sectional ones, and it should not be treated as the last word. But it is the design that can answer the question everyone thinks the cross-sectional studies are answering, and it points at a teenager reaching for a phone because she already feels bad, rather than feeling bad because she reached for the phone.
Two samples, followed over time
Cross-lagged associations between social media use and depressive symptoms, measured annually.
Source: Heffer, T., Good, M., Daly, O., MacDonell, E.T. and Willoughby, T., “The longitudinal association between social-media use and depressive symptoms among adolescents and young adults”, Clinical Psychological Science 7(3), 2019.
Questions people ask
Is screen time bad for teenagers or not?
On the best-measured evidence, the amount of time is a very weak predictor of how a teenager is doing — weak enough that no plausible reduction in hours would produce a change anyone would notice. That is a claim about hours in aggregate. It is not a claim about a specific child, about a specific platform, or about what happens on the screen, and the studies finding larger effects are the ones that look at social media specifically and at girls specifically.
Why does the research keep contradicting itself?
Mostly because the exposure is measured badly and the analytical choices are consequential. Remembered screen time correlates at about 0.18 with a diary of the same day, so different studies using different measures are not studying the same thing. And two teams working from the same three datasets reached opposite conclusions by making four different defensible choices — which is a property of the question, not misconduct by either side.
What about phones before bed?
This is the one where the evidence most clearly contradicts the received advice. Two preregistered hypotheses predicted that screen use in the thirty minutes and the hour before bed would be associated with worse wellbeing. Both came out positively associated instead. The authors are careful to say the results were mixed rather than reassuring, and sleep displacement remains a plausible mechanism — but the specific bedtime claim did not survive its own test.
So the phone bans are pointless?
That does not follow from this evidence, in either direction. These studies measure the association between hours of use and self-reported wellbeing in the general adolescent population. A school policy is aimed at attention in a classroom, at bullying, and at a social norm, and none of those is the outcome measured here. The honest position is that the wellbeing literature is not the evidence base for that decision, and is often cited as though it were.
What does have a large effect in these datasets?
Bullying, sleep, and family conflict all show associations several times larger than technology use in the same data. When the 2018 study traced how social media reached depressive symptoms, the pathways it found were online harassment, poor sleep, self-esteem and body image — which suggests the useful question is not how many hours, but whether any of those four things is happening.
The short version
- Across three datasets and 355,358 adolescents, technology use explained at most about 0.4% of the variation in wellbeing, median β between −0.01 and −0.04.
- That association was about the same size as the one for regularly eating potatoes, and smaller than the one for wearing glasses.
- Remembered screen time correlates with a time-use diary of the same day at r = .18 in the UK and Ireland, and .05 to .08 in the US.
- Specifications using remembered screen time produced the most negative results in every dataset.
- In the preregistered test, remembered use gave β = −0.08 and diary-recorded time β = −0.02; neither cleared the threshold the authors set in advance.
- Screen use 30 minutes and 1 hour before bed came out positively associated with wellbeing, the opposite of the hypothesis.
- Moving wellbeing half a standard deviation would take 63 hours 31 minutes more screen time a day at the median, or 11 hours 14 minutes using the largest effect in the analysis.
- A 2018 study of 10,904 fourteen-year-olds found girls using social media five or more hours daily had depressive symptom scores 50% higher than one-to-three-hour users; boys 35%.
- Re-running the same specification curve with four different constraints produced the opposite conclusion, especially for girls.
- Followed over time, social media did not predict later depressive symptoms; among adolescent girls, depressive symptoms predicted later social media use.
This article summarises published research on the association between adolescent screen use and wellbeing. It is not medical advice, and it describes population averages rather than any individual young person. A teenager who is struggling is struggling whatever the average coefficient says; a general practitioner, a school counsellor or a local young people’s mental health service is the right place to take that, and none of the measures described here is a screening tool.
Further reading: Orben’s 2020 narrative review of reviews is the fairest short summary of the field by someone in it, and is candid that the average association is negative, very small, and of unclear direction. Reading the 2022 re-analysis immediately afterwards is the quickest way to see how much of this argument is about analytical choices rather than data.
- Attention Span, Gloria Mark (2023). A researcher who has spent two decades measuring attention on screens, on what the evidence actually shows.
- The Scout Mindset, Julia Galef (2021). On reasoning to see clearly rather than to defend a position.
- How to Talk to a Science Denier, Lee McIntyre (2021). On engaging contested claims without dismissing or overselling them.
Sources
- Orben, A. and Przybylski, A.K., “The association between adolescent well-being and digital technology use”, Nature Human Behaviour 3, 2019, pp.173–182. (Specification curve analysis across three large datasets, 355,358 adolescents. Median standardised associations between −0.01 and −0.04, explaining at most about 0.4% of variance; comparison specifications include eating potatoes and wearing glasses.)
- Orben, A. and Przybylski, A.K., “Screens, teens, and psychological well-being: evidence from three time-use-diary studies”, Psychological Science 30(5), 2019, pp.682–696. (17,247 adolescents from Ireland, the United States and the United Kingdom after exclusions. Self-report against diary r = .18 in Ireland and the UK, .08 weekday and .05 weekend in the US. Preregistered confirmatory analysis: retrospective self-report median β = −0.08, partial r² = .008; diary time spent β = −0.02, partial r² = .001; both below the prespecified r = .10 threshold, with confidence intervals touching it. Bedtime hypotheses came out positive, β = +0.03 at 30 minutes and +0.02 at one hour. 63 hours 31 minutes of additional daily use required for a 0.5 SD change at the median, 11 hours 14 minutes using the maximum-effect specification.)
- Kelly, Y., Zilanawala, A., Booker, C. and Sacker, A., “Social media use and adolescent mental health: findings from the UK Millennium Cohort Study”, EClinicalMedicine 6, 2018. (10,904 fourteen-year-olds. Against one to three hours of daily use: three to under five hours, 26% higher depressive symptom scores for girls and 21% for boys; five hours or more, 50% and 35%. Pathways via online harassment, poor sleep, low self-esteem and body image; those using five hours or more were 31% more likely to be dissatisfied with body weight.)
- Twenge, J.M., Haidt, J., Flórez Lozano, J.A. and Cummins, K., “Specification curve analysis shows that social media use is linked to poor mental health, especially among girls”, Acta Psychologica 224:103512, 2022. (Re-ran the 2019 analysis on the same three datasets. Reproduced the original results under the original configurations; under four revised constraints — separating specific activities, separating boys and girls, excluding potential mediators from the controls, and treating scales equally — reached the opposite conclusion.)
- Heffer, T., Good, M., Daly, O., MacDonell, E.T. and Willoughby, T., “The longitudinal association between social-media use and depressive symptoms among adolescents and young adults: an empirical reply to Twenge et al. (2018)”, Clinical Psychological Science 7(3), 2019. (594 adolescents surveyed annually for two years and 1,132 undergraduates annually for six. Social media use did not predict depressive symptoms over time in either sample, for males or females; greater depressive symptoms predicted more frequent social media use among adolescent girls.)
- Orben, A., “Teenagers, screens and social media: a narrative review of reviews and key studies”, Social Psychiatry and Psychiatric Epidemiology 55, 2020, pp.407–414. (More than 80 systematic reviews and meta-analyses surveyed. The field is dominated by cross-sectional work of generally low quality; the average association is negative but very small, and the direction of the link remains unclear.)
- Odgers, C.L. and Jensen, M.R., “Adolescent mental health in the digital age: facts, fears and future directions”, Journal of Child Psychology and Psychiatry 61(3), 2020. (Synthesis of reviews, meta-analyses and preregistered cohort studies; the most rigorous large-scale work reports small associations unlikely to be of clinical or practical significance that cannot distinguish cause from effect.)
- Przybylski, A.K. and Weinstein, N., “A large-scale test of the Goldilocks hypothesis”, Psychological Science 28(2), 2017. (Preregistered, 120,115 English adolescents. The links follow quadratic functions; moderate use is not intrinsically harmful.)
- Semken, C. and Rossell, D., “Specification analysis for technology use and teenager well-being: statistical validity and a Bayesian proposal”, 2020. (Argues the specification curve median carries bias and variance by over-weighting implausible control specifications and masks heterogeneity; proposes a Bayesian alternative that recovers associations for specific technologies.)
- Whelan, E., “On the associations between adolescent social media use and health outcomes: an exploratory specification curve analysis and comparison with other concurrent predictors”, Acta Psychologica, 2026. (2,876 fifteen- and sixteen-year-olds in Ireland. Most specifications negative, some positive; aside from anger management and alcohol, most fell below accepted thresholds for reliability or clinical significance.)