Hurricane Deaths: What the Official Count Misses
Key takeaways · 12 min read
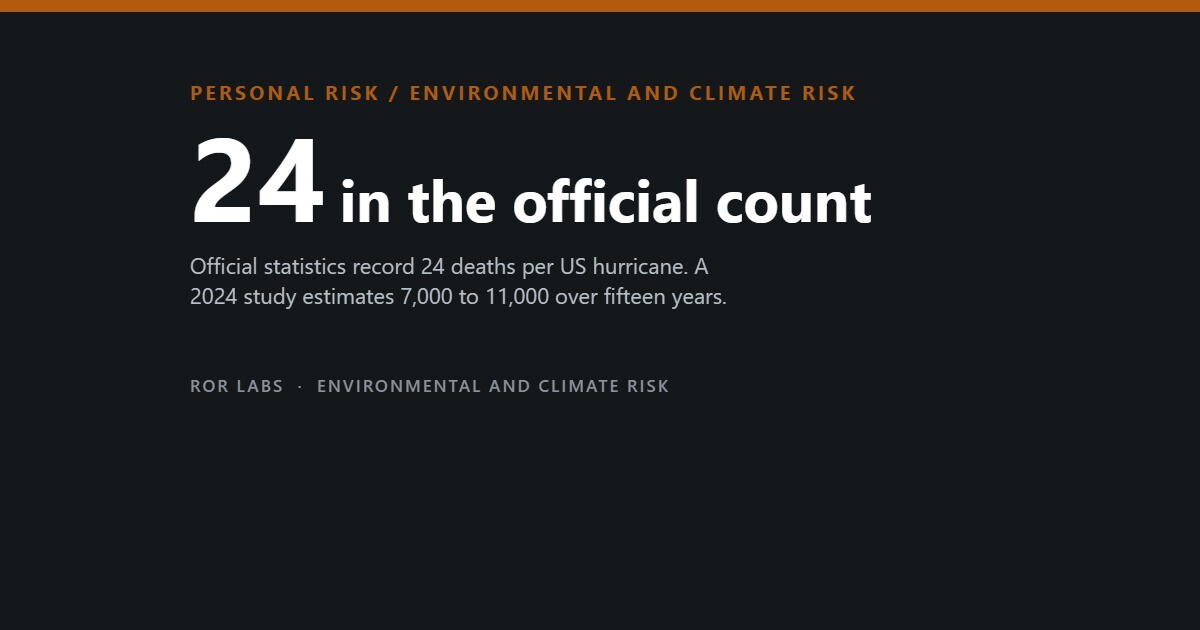
- Government statistics count about 24 deaths per US tropical storm or hurricane. A 2024 study estimates 7,000 to 11,000 excess deaths per storm over fifteen years.
- Of 2,642 direct deaths from 1963 to 2024, 36 per cent were freshwater flooding and 33 per cent storm surge. Rain has overtaken surge as the leading direct cause.
- About 80 per cent of direct deaths since 1970 have happened outside landfall counties, mostly from inland flooding.
- After Florida’s 2004 hurricanes, only about 4 per cent of the excess deaths were storm trauma. Heart disease and cancer made up more than half.
Government statistics record an average of 24 deaths for each tropical storm or hurricane that hits the mainland United States. In October 2024 two researchers published an estimate in Nature that put the true toll of the average storm at between 7,000 and 11,000 deaths, most of them arriving months and years after the wind had gone.
Both numbers can be defended. They are answering different questions. The first counts people killed by the storm itself: drowned in surge or floodwater, crushed by a tree, struck by debris. The second counts every death that would not have happened if the storm had missed, for fifteen years afterwards, and it can only be estimated by modelling what would have happened otherwise.
Between those two figures sits almost everything worth knowing about hurricane risk: what actually kills people on the day, who dies in the weeks that follow, why one storm in Puerto Rico produced official counts ranging from 64 to nearly 3,000, and how much weight a fifteen-year estimate can carry.
Water kills, not wind
The standard reference is Edward Rappaport’s count of deaths directly caused by Atlantic tropical cyclones in the continental United States. For 1963 to 2012 he found 2,544 of them, about 50 a year. A 2026 update in npj Natural Hazards extended the record to 2024 and reached 2,642 direct deaths, roughly 43 a year.
Across both periods the pattern is the same. Water, in one form or another, accounts for most of the dying. In the original record storm surge was the largest single cause at about 49 per cent, with rain-driven freshwater flooding at about 27 per cent. In the extended record the order has flipped: freshwater flooding now leads at 36 per cent and surge follows at 33.
What killed people directly, 1963 to 2024
Share of 2,642 direct tropical cyclone deaths in the continental United States, by cause.
Muller and colleagues, npj Natural Hazards, 2026. Water-related causes together account for 80 per cent. The 1963 to 2012 record (Rappaport, 2014) put surge at about 49 per cent and freshwater flooding at about 27.
The shift matters because the two kill in different places. Surge deaths are concentrated in a small number of catastrophic coastal events; the 2026 authors found that 10 per cent of storms caused more than one freshwater flood death, but only 3 per cent caused more than one surge death. Katrina alone accounts for 520 direct deaths, most of them surge. Rain deaths are spread thinly across many storms and far from the sea.
An analysis of landfalling hurricanes from 1970 to 2007 found that about 80 per cent of direct deaths occurred outside the counties where the storm came ashore, mostly from inland flooding. Each additional inch of rain was associated with 28 per cent more deaths. Hurricane Helene in 2024 is the recent illustration: of its 176 direct deaths in the updated record, 95 were freshwater flooding in the mountains, hundreds of kilometres inland, and 65 were wind, mostly falling trees.
The deaths that come after
Direct deaths are the ones a medical examiner can tie to the storm. Public health agencies also count indirect deaths: carbon monoxide from a generator, a fall during clean-up, a heart attack while evacuating, a missed dialysis appointment. These are harder to count, and the counting has usually been done case by case.
A different approach is to ignore the death certificates and look at the totals. A study of the four hurricanes that hit Florida in 2004 compared observed deaths with the expected pattern and found raised mortality for up to two months after each storm, 624 deaths in all. Only about 4 per cent were trauma of the kind that gets attributed to a storm. The largest shares were heart disease and cancer.
What the 2004 Florida storms added to the death count
Share of 624 storm-related excess deaths after Charley, Frances, Ivan and Jeanne, by cause.
McKinney, Houser and Meyer-Arendt, International Journal of Biometeorology, 2010. The remaining excess falls across other causes.
A 2023 study in Science Advances did the same thing at national scale, applying an ensemble of 16 statistical models to 40.7 million US deaths and 179 tropical cyclones from 1988 to 2019. Katrina came out deadliest, with 1,491 excess deaths in the months after landfall, a credible interval of 563 to 3,206. Across all storms where the evidence was strong, the authors counted 3,112 excess deaths after hurricane-force winds and 15,590 after weaker gale-to-storm-force winds.
That second number is the one that gets missed. Weaker storms are far more common, nobody evacuates for them, and their deaths never make the news. Only 6.2 per cent of the excess deaths occurred in the least socially vulnerable counties, though the authors note those counties are also hit less often.
One storm, seven numbers
Hurricane Maria reached Puerto Rico on 20 September 2017. For months the official death toll stood at 64. What followed became a public lesson in how many honest answers the question “how many died?” can have.
Hurricane Maria: published estimates of deaths
Each number answers a slightly different question, over a different period, with a different method.
Kishore and colleagues, NEJM, 2018 (95 per cent interval 793 to 8,498); Santos-Burgoa and colleagues, Lancet Planetary Health, 2018; Cruz-Cano and Mead, AJPH, 2019; Spagat and van Weezel, Population and Environment, 2020.
The highest figure came from a Harvard-led household survey of 3,299 randomly chosen homes, carried out in early 2018. It estimated 4,645 excess deaths to the end of 2017, a 62 per cent rise in the death rate. Its interval ran from 793 to 8,498, which tells you how few deaths a survey of 3,000 households actually observes. The authors called their number conservative and said adjustments for survivor bias pushed it past 5,000.
The number that became official was 2,975, from a George Washington University team commissioned by the governor. The same study produced 1,191 without adjusting for the people who left the island. After Maria, roughly 8 per cent of the population departed, and fewer people means fewer expected deaths, which means more of the observed deaths count as excess. The researchers argued the adjusted figure was the right one; critics argued the adjustment was too large. The disagreement is about the denominator, not the dead.
What every estimate agrees on is the shape. The excess was among older people, it ran for months rather than days, and the survey found households had gone an average of 84 days without electricity. Interruption of medical care, the survey authors concluded, was the main driver of the sustained rise.
What households in Puerto Rico went without
Average days without each service between landfall and 31 December 2017, from 3,299 surveyed households.
Kishore and colleagues, NEJM, 2018. In the most remote areas, 83 per cent of households were without power for the entire period, and 31 per cent of households overall reported disrupted medical care.
The fifteen-year tail
Rachel Young and Solomon Hsiang took the idea of excess mortality much further. They reconstructed wind exposure for 501 tropical cyclones affecting the contiguous United States between 1930 and 2015, linked it to monthly state death records from 1950, and looked for changes in mortality for up to twenty years after each storm.
They found a rise in deaths that persisted for about fifteen years. Summed over that period, the average storm was associated with 7,000 to 11,000 excess deaths. Across all 501 storms, the burden came to roughly 3.2 to 5.1 per cent of all deaths. The authors estimate Black populations to be about 3.2 times more vulnerable to a comparable storm, and the largest per-person effect was among infants.
Three ways to count a hurricane
The window of time you count over changes the answer by a factor of hundreds.
Young and Hsiang, Nature, 2024; Parks and colleagues, Science Advances, 2023.
The authors were clear that they cannot say why. The mechanisms they proposed are plausible and unproven: housing damage and mould, financial strain that cuts access to health care for years, broken social networks, and the pressure a disaster puts on public budgets. Kerry Emanuel of MIT, a hurricane scientist, called the finding persuasive and said he expected it to prove controversial, while noting that he was not an expert in the statistical method. Eugenio Paglino, a demographer, said the numbers seemed large but that the authors had checked their robustness thoroughly.
Who carries the weight
Across the studies the same groups keep appearing. In Puerto Rico the time-series analysis that broke deaths down by age found the entire excess among people aged 60 and over. The leading causes were heart disease, diabetes, Alzheimer’s disease and septicaemia, conditions that depend on electricity, refrigeration, medication and regular care.
The survey found the most remote households waited longest for power and water, and that the waits were bimodal: homes either got services back quickly or went without for months. The national studies point the same way. Deaths concentrate in socially vulnerable counties, and the fifteen-year estimate finds larger effects in Black populations.
None of this is surprising. It is still worth stating plainly, because the way hurricane risk is usually described, as a matter of category, landfall and wind speed, points attention at the one hour of the storm that kills the fewest people.
What the evidence does not show
The fifteen-year estimate is a model, not a count. No death certificate in the dataset says “hurricane, 2004”. The method detects a statistical association between wind exposure and later mortality at state level and month level, and the authors themselves list its limits: wind is the only storm variable, so rain and surge are not modelled directly; state totals hide where within a state the deaths occur; and the analysis does not account for people moving between states after a storm. An association that holds up across many robustness checks is strong evidence of something. It is not yet evidence of a mechanism, and I could find no formal published reply testing the result, which is different from the result having been confirmed.
The short-window and long-window studies are not in conflict, but they are not interchangeable either. The 2023 national study found fewer than 20,000 excess deaths across three decades; the fifteen-year estimate implies millions over a longer span. Quoting “11,000 deaths per storm” next to a storm’s official toll compares a modelled fifteen-year association with a coroner’s count from the first week.
The Maria range is partly a range of choices. The survey’s wide interval comes from a modest number of observed deaths. The official 2,975 depends on how much the island’s population shrank, which was itself estimated. A commentary by the GWU team argued that the published estimates are more consistent than they look once their time windows and assumptions are lined up. That is fair, and it is also an argument made by one of the teams whose number is being compared.
Direct death records are not clean either. The 2026 update lists incomplete early records, changing classification rules, missing people sometimes counted as dead, and overlapping hazards that make it hard to say whether someone drowned in surge or in rain. It found no significant trend in direct deaths from 1963 to 2024, which could mean warnings have held deaths steady as coastal populations grew, or could simply reflect how noisy a record dominated by a few catastrophic storms is.
And the research itself is lopsided. A mapping review of 150 studies on tropical cyclone deaths found that the United States accounted for 0.76 per cent of the world’s cyclone fatalities but was the subject of 51 per cent of the articles. Asian countries accounted for 90.4 per cent of the deaths and 39 per cent of the research. Most of what is known about hurricane mortality comes from the country where the fewest people die of it.
Questions people ask
What kills most people in a hurricane?
Among direct deaths, water. Freshwater flooding from rain and storm surge together caused about two thirds of direct US deaths from 1963 to 2024, and water-related causes overall about 80 per cent. Wind and tornadoes caused about 13 per cent.
Is it safer to be inland?
Safer from surge, not from flooding. Since 1970, about 80 per cent of direct hurricane deaths in the US have occurred outside the counties where the storm made landfall, mostly from inland flooding. Rainfall totals, not wind category, are the better guide to that risk.
Why did Hurricane Maria’s death toll change so much?
Because the first figure counted only deaths certified as storm-related, while later studies estimated all deaths above what would normally be expected. The estimates differ further in their time windows and in whether they adjust for the people who left the island.
Do hurricanes really cause deaths for fifteen years?
One large study finds a statistical association that lasts about that long. It is published in a leading journal and was checked carefully, but the mechanism is unknown and it has not yet been independently replicated with different data. Treat it as a strong signal that official counts miss most of the harm, not as a settled number.
Who is most at risk after the storm?
Older people with chronic illness, anyone dependent on powered medical equipment, medication or dialysis, and people in poorer and more remote areas where power, water and care take longest to return.
The short version
- Government statistics count about 24 deaths per US tropical storm or hurricane. A 2024 study estimates 7,000 to 11,000 excess deaths per storm over fifteen years.
- Of 2,642 direct deaths from 1963 to 2024, 36 per cent were freshwater flooding and 33 per cent storm surge. Rain has overtaken surge as the leading direct cause.
- About 80 per cent of direct deaths since 1970 have happened outside landfall counties, mostly from inland flooding.
- After Florida’s 2004 hurricanes, only about 4 per cent of the excess deaths were storm trauma. Heart disease and cancer made up more than half.
- Hurricane Maria’s estimates run from 64 to 4,645. The official figure is 2,975, and it depends on how much the island’s population shrank.
- The fifteen-year estimate is a strong association with an unknown mechanism, and it rests on state-level data and wind exposure alone.
This article summarises published mortality research and official records. It is not emergency guidance. In a hurricane, follow the instructions of your local emergency management office and national weather service, including evacuation orders. If you rely on powered medical equipment, medication that needs refrigeration or dialysis, talk to your clinician and provider before the season about what happens if power fails.
Further reading. Young and Hsiang, ‘Mortality caused by tropical cyclones in the United States’, Nature, 2024, is the study behind the fifteen-year estimate. Parks and colleagues, ‘Short-term excess mortality following tropical cyclones in the United States’, Science Advances, 2023, is the best national picture of the months after a storm and is open access. Kishore and colleagues, ‘Mortality in Puerto Rico after Hurricane Maria’, New England Journal of Medicine, 2018, is the survey that forced the recount.
- Disasterology, Samantha Montano (2021). An emergency manager on why disaster response keeps failing the same people. Part memoir and openly an argument, so read it as a case being made rather than a survey.
- The Great Displacement, Jake Bittle (2023). Reporting on what happens to people and places after floods and storms, which is where the long tail of this article lives. Journalism, not epidemiology.
- How to Read Numbers, Tom Chivers and David Chivers (2021). A short guide to exactly the traps in a death toll: denominators, time windows and comparisons that are not like for like.
Sources
- Young R, Hsiang S. Mortality caused by tropical cyclones in the United States. Nature, 2024. doi:10.1038/s41586-024-07945-5.
- Parks RM, Kontis V, Anderson GB, and colleagues. Short-term excess mortality following tropical cyclones in the United States. Science Advances, 2023. doi:10.1126/sciadv.adg6633.
- Muller J, Idzik AM, Benzi D, and colleagues. Continental United States direct Atlantic tropical cyclone fatalities: 1963–2024. npj Natural Hazards, 2026.
- Rappaport EN. Fatalities in the United States from Atlantic tropical cyclones: new data and interpretation. Bulletin of the American Meteorological Society, 2014.
- Czajkowski J, Simmons KM, Sutter D. An analysis of coastal and inland fatalities in landfalling US hurricanes. Natural Hazards, 2011. doi:10.1007/s11069-011-9849-x.
- McKinney N, Houser C, Meyer-Arendt K. Direct and indirect mortality in Florida during the 2004 hurricane season. International Journal of Biometeorology, 2010. doi:10.1007/s00484-010-0370-9.
- Kishore N, Marqués D, Mahmud A, and colleagues. Mortality in Puerto Rico after Hurricane Maria. New England Journal of Medicine, 2018. doi:10.1056/NEJMsa1803972.
- Santos-Burgoa C, Sandberg J, Suárez E, and colleagues. Differential and persistent risk of excess mortality from Hurricane Maria in Puerto Rico. Lancet Planetary Health, 2018. doi:10.1016/S2542-5196(18)30209-2.
- Cruz-Cano R, Mead EL. Causes of excess deaths in Puerto Rico after Hurricane Maria. American Journal of Public Health, 2019. doi:10.2105/AJPH.2019.305015.
- Spagat M, van Weezel S. Excess deaths and Hurricane María. Population and Environment, 2020. doi:10.1007/s11111-020-00341-x.
- Sandberg J, Santos-Burgoa C, Roess A, and colleagues. All over the place? Differences in and consistency of excess mortality estimates in Puerto Rico after Hurricane Maria. Epidemiology, 2019. doi:10.1097/EDE.0000000000000970.
- Dresser C, Hart A, Law AK, and colleagues. Where are people dying in disasters, and where is it being studied? Prehospital and Disaster Medicine, 2022.
- Ebi KL, Vanos J, Baldwin JW, and colleagues. Extreme weather and climate change: population health and health system implications. Annual Review of Public Health, 2021. doi:10.1146/annurev-publhealth-012420-105026.
- Comments by Kerry Emanuel (Heatmap News, October 2024) and Eugenio Paglino (Scientific American, October 2024) on the Young and Hsiang study.