
Trend summary
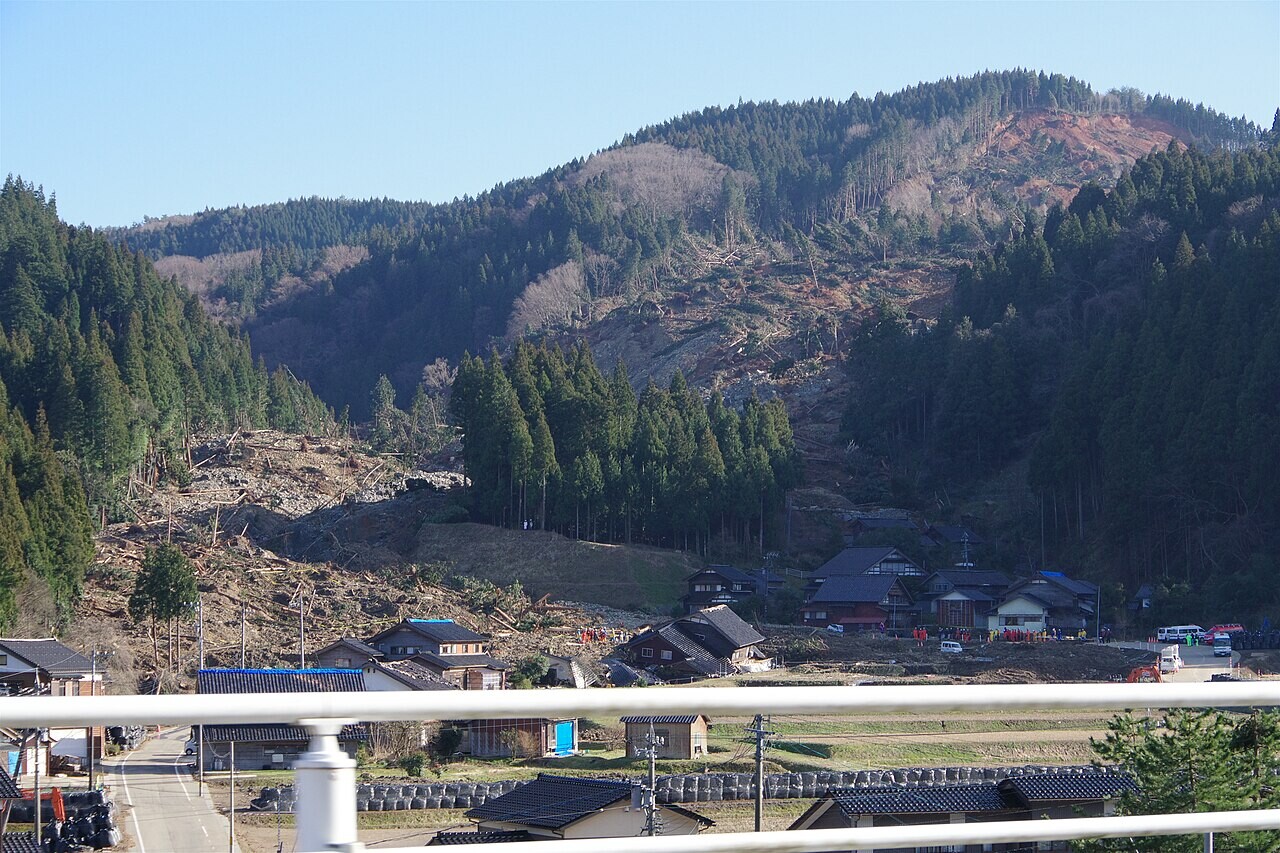
- Japan has suffered two deadly earthquakes in under three years: the Noto Peninsula earthquake of 1 January 2024 and an M7.1 earthquake in Kumamoto Prefecture on 28 July 2026.
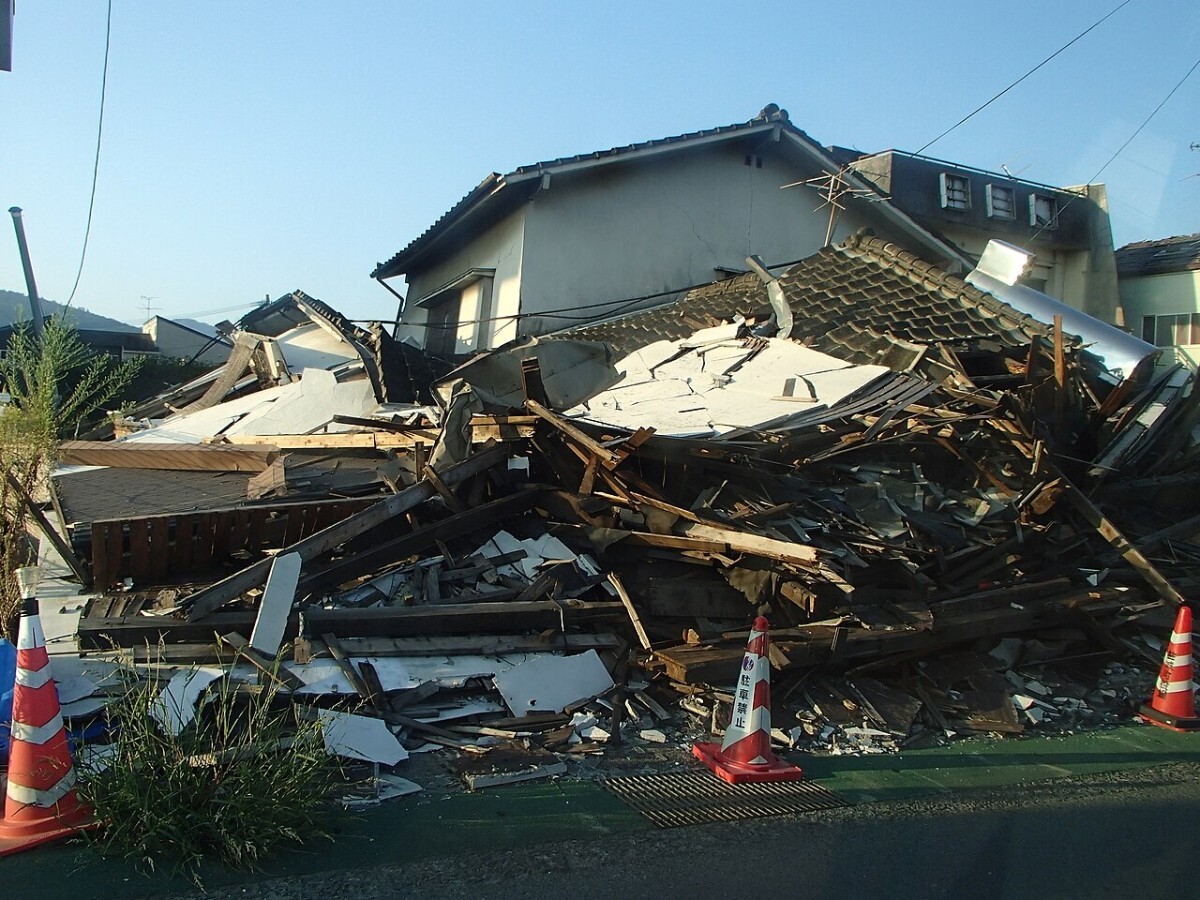
- The 2026 Kumamoto Earthquake has killed 38 people and damaged about 69,600 homes, 2,408 of them destroyed (FDMA, provisional, 5 October 2026).
- The 2024 Noto Peninsula Earthquake has now claimed 720 lives, 492 of them disaster-related deaths in the months after the shaking (Cabinet Office, 31 March 2026).
- Japan recorded 4,456 felt earthquakes in 2025, up from 3,678 first reported for 2024, and the government still rates a Nankai Trough megaquake within 30 years as highly likely (JMA; HERP).
What the numbers show
The Japan Meteorological Agency (JMA) counts every earthquake felt somewhere in Japan at shindo 1 or more, shindo being JMA’s 0 to 7 scale of how strongly the ground shakes at a place. Its annual review of 2025 (in Japanese) counted 4,456 felt earthquakes, against 3,678 first reported for 2024; 112 reached shindo 4 or more and 15 reached shindo 5-lower or more (28 in 2024). The total swings with swarms and aftershocks: a swarm near the Tokara Islands that began on 21 June 2025 alone produced 2,271 felt earthquakes by 12 August (in Japanese), and in March 2026 JMA added 323 earthquakes (in Japanese) to the early Noto aftershock count after rechecking it, so the 2024 figure will be revised up. From January to August 2026, JMA’s monthly reports list 266 earthquakes of shindo 3 or more and 67 of shindo 4 or more, 24 of them in July alone.
The number of earthquakes says little about the human cost, which comes from a few large events. The M7.1 earthquake of 28 July 2026, which JMA named the 2026 Kumamoto Earthquake, reached shindo 7, the top of the scale, in Uki and Hikawa. By 5 October the Fire and Disaster Management Agency (FDMA) reported 38 deaths, 376 injured and about 69,600 damaged homes (in Japanese, provisional), 20 of the deaths in Yatsushiro. At the peak 9,931 people were in 506 shelters and about 108,100 households lost piped water (Cabinet Office, in Japanese). For comparison, the 2016 Kumamoto earthquakes (in Japanese) killed 273 people, and the 2011 Great East Japan Earthquake and tsunami remain far deadlier than any event since.
What is driving it
Japan sits where four tectonic plates meet, so the hazard itself does not change from year to year; what changes is where large earthquakes strike and how well people survive the weeks afterwards. The government’s Earthquake Research Committee says the 2026 Kumamoto earthquake ruptured mainly the Hinagu fault zone (in Japanese), next to the faults of the 2016 sequence, and that one of its sections had already been rated as having a high chance of an M7.5 earthquake within 30 years. Disaster-related deaths, from illness, stress and harsh conditions in shelters after the shaking stops, are now a major share of the toll: they make up 492 of Noto’s 720 deaths (Cabinet Office, in Japanese), and most of the 2016 Kumamoto deaths were of this kind.
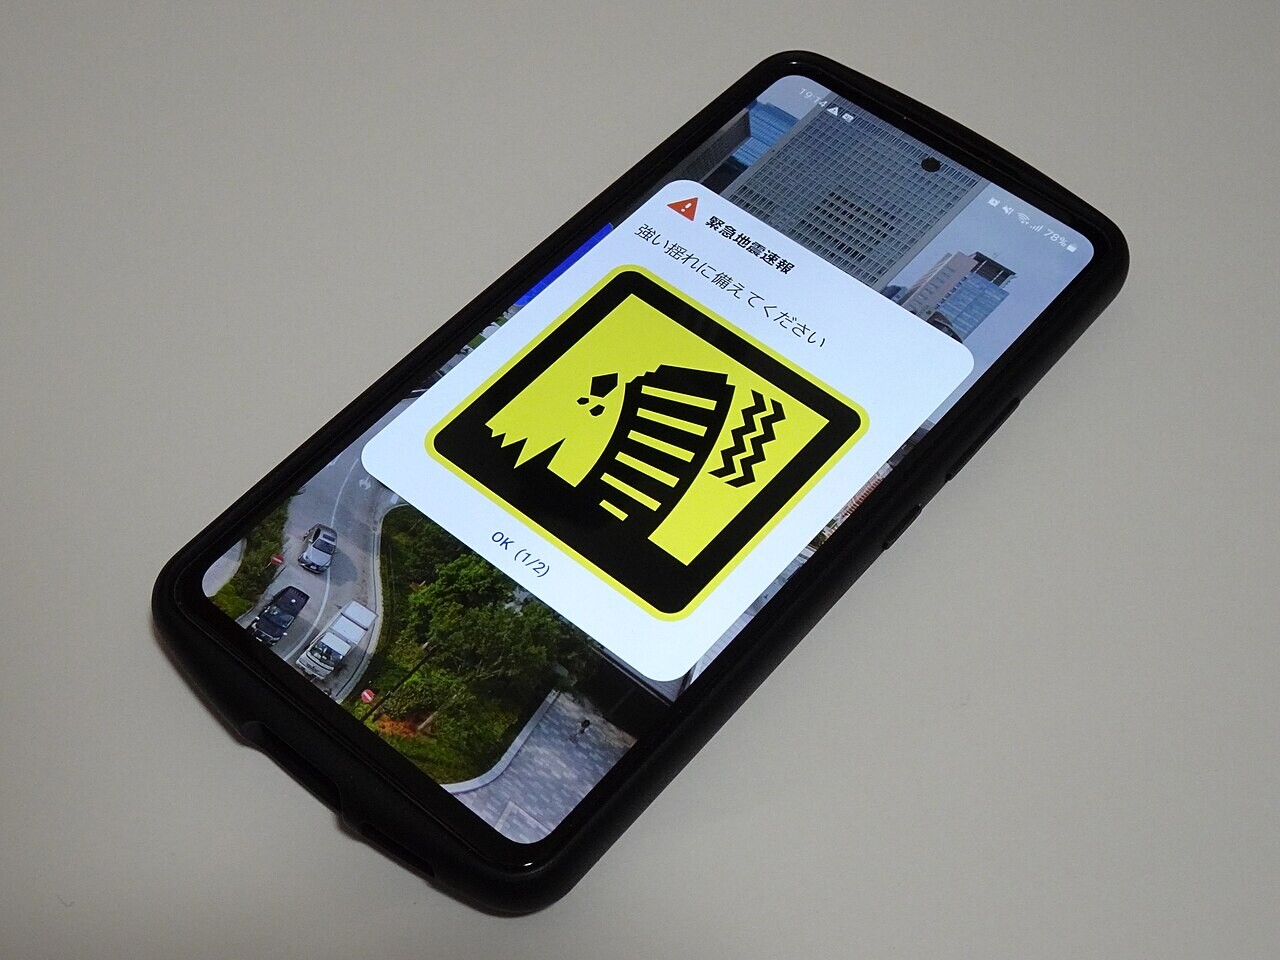
The largest future risk is the Nankai Trough off south-western Japan. In September 2025 the Headquarters for Earthquake Research Promotion (HERP) replaced its single 30-year figure of “about 80%” with two ranges, 60–90% or more and 20–50% (in Japanese), depending on the model, both still ranked “high”. The Cabinet Office’s March 2025 estimate puts the worst case at about 298,000 deaths (in Japanese), plus 26,000 to 52,000 disaster-related deaths. Warning systems are being tested for real: JMA issued its first Nankai Trough Earthquake Extra Information (Megaquake Advisory) in August 2024, tsunami warnings along much of the Pacific coast after the M8.8 Kamchatka earthquake in July 2025, when the tsunami reached 1.3 m at Kuji port (in Japanese), and Hokkaido and Sanriku subsequent-earthquake advisories after large offshore earthquakes in December 2025 and April 2026.
Policy and budget changes
The main government measures and money figures behind this risk, newest first. Each item links to the official text we checked; where only a news report was available, the source says so.
Main policy changes
- 2 November 2026 Disaster Management Agency launched. The Disaster Management Agency (防災庁) was formally launched as the government’s command centre for disasters, covering preparation, first response, shelters and supplies, and recovery, with powers to make recommendations to other ministries. (Disaster Management Agency (bousai.go.jp))
- 1 July 2025 Nankai Trough disaster plan revised. The Central Disaster Management Council revised the Basic Plan for Promotion of Nankai Trough Earthquake Disaster Management, aiming within ten years to cut the estimated 298,000 deaths by about 80% and destroyed or burned buildings by about half. (Cabinet Office (Disaster Management))
- 1 July 2025 Disaster law adds welfare services to relief. The Act Partially Amending the Disaster Countermeasures Basic Act and Other Acts (Act No. 51 of 2025), promulgated on 4 June 2025, came into force. It adds welfare services to relief under the Disaster Relief Act, creates a register of volunteer groups that support evacuees, and asks the state to help local governments without waiting for a request. (Cabinet Office (Disaster Management))
- 31 March 2025 New Nankai Trough damage estimate published. The government’s Nankai Trough megaquake working group published its report and updated damage estimates for a maximum-class earthquake. (Cabinet Office (Disaster Management))
- 20 May 2021 Evacuation advisories and orders merged into one. An amendment to the Disaster Countermeasures Basic Act (Act No. 30 of 2021) came into force, abolishing the separate evacuation advisory so that municipalities issue a single evacuation order, and asking them to prepare individual evacuation plans for people who need help. (Cabinet Office (Disaster Management))
Budget and costs
- 2025 Disaster management budget doubled to about ¥14.6bn. The 2025 Disaster Management White Paper says the Cabinet Office’s disaster management budget was doubled to about ¥14.6 billion in the FY2025 initial budget, drawing on lessons from the 2024 Noto Peninsula Earthquake. (Cabinet Office, Disaster Management White Paper 2025)
- 2025 ¥35.05bn in the FY2024 supplementary budget. The same white paper says the Cabinet Office’s disaster management team put ¥35.05 billion into the FY2024 supplementary budget, including ¥28.85 billion for disaster relief costs; a further ¥100 billion regional grant for disaster preparedness is counted separately. (Cabinet Office, Disaster Management White Paper 2025)
Recent cases
- 23 August 2026: an M5.9 earthquake in southern Ibaraki Prefecture reaches shindo 5-lower and injures 38 people, according to JMA’s monthly review citing FDMA figures (JMA, in Japanese).
- 28 July 2026: an M7.1 earthquake in Kumamoto Prefecture reaches shindo 7 in Uki and Hikawa and triggers a tsunami advisory for the Ariake and Yatsushiro seas; 38 people have died (JMA, in Japanese; FDMA, in Japanese).
- 25 June 2026: an M7.2 earthquake off Iwate Prefecture reaches shindo 6-upper and causes a small tsunami; FDMA reports 17 people injured (JMA, in Japanese; FDMA, in Japanese).
Our read: what the numbers add up to
The headline count of felt earthquakes is a poor guide to whether Japan’s earthquake risk is changing. The rise to 4,456 in 2025 from the 3,678 first reported for 2024 owes a great deal to a single swarm near the Tokara Islands, which alone produced 2,271 felt earthquakes by mid-August, and the 2024 figure is itself being revised up after JMA added 323 Noto aftershocks. Swarms come and go. The hazard, as the page says, does not change from year to year; what moves is where the large events strike and what happens to people afterwards.
On that second point the numbers are striking. Of the 720 deaths now attributed to the Noto Peninsula Earthquake, 492 were disaster-related, from illness, stress and harsh shelter conditions in the months after the shaking. Most of the 273 deaths of the 2016 Kumamoto earthquakes were of the same kind. Put next to that, the 38 deaths recorded so far for the 2026 Kumamoto Earthquake look like an early count rather than a final one: at the peak 9,931 people were in shelters and about 108,100 households had no piped water, conditions of the sort that drove the later toll at Noto. The part of earthquake risk that policy can most clearly influence is the weeks after the shaking stops.
The FDMA figures are provisional, so the 2026 toll may still change. The Nankai Trough estimate also needs care: replacing about 80% with ranges of 60–90% or more and 20–50% reflects model uncertainty, not a sign that the danger has eased, and both are still ranked high. Even the worst-case estimate of about 298,000 deaths comes with 26,000 to 52,000 disaster-related deaths on top. What I would watch is the disaster-related death count for Kumamoto over the coming months. My bottom line: the shaking cannot be changed, but how many people die after it can.
Press releases and official reports, 2023–2026
Five key releases a year for the last four years, newest first. Most come from Japanese government ministries and agencies, regulators, accident investigators and national statistics; a few news reports are included where they are the clearest public record of an event. Many official releases are published only in Japanese; for those we give an English translation of the title and mark the link (in Japanese). Releases from 2007–2022 are in the expandable list after 2023.
2026
- 5 Oct 2026FDMADamage from the 2026 Kumamoto Earthquake and the response of fire services (66th report) (in Japanese)
- 24 Sep 2026JMAThe 2026 Kumamoto Earthquake (12th report) (in Japanese)
- 9 Sep 2026Cabinet OfficeDamage from the 2026 Kumamoto Earthquake (as of 9 September 2026) (in Japanese)
- 28 Jul 2026JMAThe earthquake in the Kumamoto region of Kumamoto Prefecture at about 16:27 on 28 July 2026 (in Japanese)
- 20 Apr 2026JMAHokkaido and Sanriku Subsequent Earthquake Advisory issued (in Japanese)
2025
- 15 Dec 2025Cabinet OfficeDamage from the earthquake centred east off Aomori Prefecture (as of 15 December 2025) (in Japanese)
- 9 Dec 2025JMAHokkaido and Sanriku Subsequent Earthquake Advisory issued (in Japanese)
- 26 Sep 2025HERPLong-term evaluation of seismic activity along the Nankai Trough (second edition, partly revised) (in Japanese)
- 30 Jul 2025JMAThe earthquake near the Kamchatka Peninsula at about 08:25 on 30 July 2025 (in Japanese)
- 31 Mar 2025Cabinet OfficeReport of the Nankai Trough Megaquake Countermeasures Working Group, with revised damage estimates (in Japanese)
2024
- 20 Dec 2024Cabinet OfficeReview of the response to the Nankai Trough Earthquake Extra Information (Megaquake Advisory) and measures to improve it (in Japanese)
- 15 Aug 2024JMAEnd of the government’s special call for caution under the Nankai Trough Megaquake Advisory (in Japanese)
- 8 Aug 2024JMANankai Trough Earthquake Extra Information (Megaquake Advisory) issued (in Japanese)
- 8 Aug 2024JMAThe earthquake in the Hyuga-nada Sea at about 16:43 on 8 August 2024 (in Japanese)
- 1 Jan 2024JMAThe earthquake in the Noto region of Ishikawa Prefecture at about 16:10 on 1 January 2024 (in Japanese)
2023
- 3 Dec 2023JMAThe earthquake near the Philippines at about 23:37 on 2 December 2023 (in Japanese)
- 9 Oct 2023JMAThe earthquake near Torishima at about 05:25 on 9 October 2023 (in Japanese)
- 18 May 2023Cabinet OfficeDamage from the earthquake centred in the Noto region of Ishikawa Prefecture (as of 18 May 2023) (in Japanese)
- 12 May 2023JMASeismic activity in the Noto region of Ishikawa Prefecture: stay alert to continued active seismicity (in Japanese)
- 5 May 2023JMAThe earthquake in the Noto region of Ishikawa Prefecture at about 14:42 on 5 May 2023 (in Japanese)
View 20 years of major Japanese earthquake press releases (2007–2026)80 more from 2007–2022, up to five a year, newest first
2022
- 8 Nov 2022JMAPublication of the study group report on information urging caution about subsequent earthquakes along the Japan and Kuril trenches (in Japanese)
- 20 Jun 2022Cabinet OfficeDamage from the earthquake centred in the Noto region of Ishikawa Prefecture (as of 20 June 2022) (in Japanese)
- 19 Jun 2022JMAThe earthquake in the Noto region of Ishikawa Prefecture at about 15:08 on 19 June 2022 (in Japanese)
- 19 Apr 2022Cabinet OfficeDamage from the earthquake centred off Fukushima Prefecture (as of 19 April 2022) (in Japanese)
- 17 Mar 2022JMAThe earthquake off Fukushima Prefecture at about 23:36 on 16 March 2022 (in Japanese)
2021
- 8 Oct 2021Cabinet OfficeDamage from the earthquake centred in north-western Chiba Prefecture (as of 8 October 2021) (in Japanese)
- 8 Oct 2021JMAThe earthquake in north-western Chiba Prefecture at about 22:41 on 7 October 2021 (in Japanese)
- 20 Mar 2021JMAThe earthquake off Miyagi Prefecture at about 18:09 on 20 March 2021 (in Japanese)
- 22 Feb 2021Cabinet OfficeDamage from the earthquake centred off Fukushima Prefecture (as of 22 February 2021) (in Japanese)
- 14 Feb 2021JMAThe earthquake off Fukushima Prefecture at about 23:08 on 13 February 2021 (in Japanese)
2020
- 4 Sep 2020JMAStart date for urgent improvements to Earthquake Early Warnings (in Japanese)
- 7 Aug 2020JMAUrgent improvements to Earthquake Early Warnings (in Japanese)
- 30 Jul 2020JMAThe Earthquake Early Warning issued at 09:38 on 30 July 2020 (in Japanese)
- 24 Jun 2020JMATsunami flags come into use (in Japanese)
- 13 Mar 2020JMAThe earthquake in the Noto region of Ishikawa Prefecture at about 02:18 on 13 March 2020 (in Japanese)
2019
- 31 Jul 2019Cabinet OfficeDamage from the earthquake centred off Yamagata Prefecture (as of 31 July 2019) (in Japanese)
- 19 Jun 2019JMAThe earthquake off Yamagata Prefecture at about 22:22 on 18 June 2019 (in Japanese)
- 31 May 2019JMAStart of Nankai Trough Earthquake Extra Information (in Japanese)
- 21 Feb 2019JMAThe earthquake in central and eastern Iburi at about 21:22 on 21 February 2019 (Hokkaido Eastern Iburi Earthquake, 11th report) (in Japanese)
- 28 Jan 2019Cabinet OfficeDamage from the 2018 Hokkaido Eastern Iburi Earthquake (as of 28 January 2019) (in Japanese)
2018
- 6 Sep 2018JMAThe earthquake in central and eastern Iburi at about 03:08 on 6 September 2018 (3rd report): shindo 7 observed in Atsuma (in Japanese)
- 5 Jul 2018Cabinet OfficeDamage from the earthquake centred in northern Osaka Prefecture (as of 5 July 2018) (in Japanese)
- 18 Jun 2018JMAThe earthquake in northern Osaka Prefecture at about 07:58 on 18 June 2018 (in Japanese)
- 9 Apr 2018JMAThe earthquake in western Shimane Prefecture at about 01:32 on 9 April 2018 (in Japanese)
- 8 Mar 2018JMATechnical improvement of Earthquake Early Warnings: better shaking forecasts for very large earthquakes (in Japanese)
2017
- 26 Oct 2017JMAInterim operation of information related to Nankai Trough earthquakes and of the Nankai Trough evaluation committee (in Japanese)
- 26 Sep 2017JMAIssuing information related to Nankai Trough earthquakes (in Japanese)
- 9 Sep 2017Cabinet OfficeDamage from the earthquake centred in southern inland Akita Prefecture (as of 9 September 2017) (in Japanese)
- 11 Jul 2017Cabinet OfficeDamage from the earthquake centred in Kagoshima Bay (as of 11 July 2017) (in Japanese)
- 26 Jun 2017Cabinet OfficeDamage from the 2017 earthquake centred in southern Nagano Prefecture (as of 26 June 2017) (in Japanese)
2016
- 21 Dec 2016Cabinet OfficeDamage from the 2016 earthquake centred in central Tottori Prefecture (as of 21 December 2016) (in Japanese)
- 22 Nov 2016JMAThe earthquake off Fukushima Prefecture at about 05:59 on 22 November 2016 (Great East Japan Earthquake series, 78th report) (in Japanese)
- 21 Oct 2016JMAThe earthquake in central Tottori Prefecture at about 14:07 on 21 October 2016 (in Japanese)
- 16 Apr 2016JMAThe 2016 Kumamoto Earthquake (7th report): the M7.3 earthquake of 16 April (in Japanese)
- 14 Apr 2016JMAThe earthquake in the Kumamoto region of Kumamoto Prefecture at about 21:26 on 14 April 2016 (in Japanese)
2015
- 18 Sep 2015Cabinet OfficeTsunami from the earthquake centred off central Chile (as of 18 September 2015) (in Japanese)
- 17 Sep 2015JMAThe earthquake off central Chile at about 07:54 on 17 September 2015 (in Japanese)
- 13 Jul 2015Cabinet OfficeDamage from the earthquake centred in southern Oita Prefecture (as of 13 July 2015) (in Japanese)
- 30 May 2015JMAThe earthquake west of the Ogasawara Islands at about 20:24 on 30 May 2015 (in Japanese)
- 17 Feb 2015JMAThe earthquake off Sanriku at about 08:06 on 17 February 2015 (Great East Japan Earthquake series, 74th report) (in Japanese)
2014
- 16 Dec 2014Cabinet OfficeDamage from the earthquake centred in northern Nagano Prefecture (as of 16 December 2014) (in Japanese)
- 23 Nov 2014JMAThe earthquake in northern Nagano Prefecture at about 22:08 on 22 November 2014 (in Japanese)
- 14 Jul 2014JMAPlanned technical improvements to Earthquake Early Warnings (in Japanese)
- 2 Apr 2014JMAThe earthquake off the coast of northern Chile at about 08:46 on 2 April 2014 (in Japanese)
- 14 Mar 2014JMAThe earthquake in the Iyo-nada Sea at about 02:07 on 14 March 2014 (in Japanese)
2013
- 8 Aug 2013JMAThe Earthquake Early Warning for the earthquake centred in northern Wakayama Prefecture at about 16:56 on 8 August 2013 (in Japanese)
- 28 May 2013Cabinet OfficeCountermeasures for a Nankai Trough megaquake (final report) (in Japanese)
- 14 May 2013Cabinet OfficeThe earthquake centred near Awaji Island (10th report, as of 14 May 2013) (in Japanese)
- 13 Apr 2013JMAThe earthquake near Awaji Island at about 05:33 on 13 April 2013 (in Japanese)
- 7 Mar 2013JMAImprovements to tsunami warnings: new system in operation (in Japanese)
2012
- 7 Dec 2012JMAThe earthquake off Sanriku at about 17:18 on 7 December 2012 (Great East Japan Earthquake series, 66th report) (in Japanese)
- 29 Aug 2012Cabinet OfficeDamage estimates for a Nankai Trough megaquake (in Japanese)
- 14 Mar 2012JMAThe earthquake off Sanriku at about 18:09 on 14 March 2012 (in Japanese)
- 7 Feb 2012JMARecommendations on criteria and wording for tsunami warnings (in Japanese)
- 5 Jan 2012JMANumber of earthquakes of shindo 1 or more since the 2011 Great East Japan Earthquake (in Japanese)
2011
- 12 Sep 2011JMADirection for improving tsunami warnings after the Great East Japan Earthquake tsunami (final report) (in Japanese)
- 18 Aug 2011JMADisaster natural phenomena report on the 2011 off the Pacific coast of Tohoku Earthquake (in Japanese)
- 29 Mar 2011JMAEarthquake Early Warnings issued since the 2011 off the Pacific coast of Tohoku Earthquake (in Japanese)
- 11 Mar 2011JMAThe magnitude of the 2011 off the Pacific coast of Tohoku Earthquake (3rd report) (in Japanese)
- 11 Mar 2011JMAThe earthquake off Sanriku at about 14:46 on 11 March 2011 (in Japanese)
2010
- 23 Jun 2010Cabinet OfficeThe 2008 Iwate–Miyagi Nairiku Earthquake (as of 23 June 2010) (in Japanese)
- 23 Apr 2010Cabinet OfficeTsunami from the earthquake centred off the central coast of Chile (as of 23 April 2010) (in Japanese)
- 16 Mar 2010Cabinet OfficeDamage from the earthquake centred in Suruga Bay (as of 16 March 2010) (in Japanese)
- 9 Mar 2010JMAThe earthquake off the central coast of Chile on 27 February 2010 (in Japanese)
- 27 Feb 2010JMAThe earthquake off the central coast of Chile at about 15:34 on 27 February 2010 (in Japanese)
2009
- 18 Dec 2009Cabinet OfficeThe earthquake centred east off the Izu Peninsula (as of 18 December 2009) (in Japanese)
- 18 Dec 2009JMAThe earthquake east off the Izu Peninsula at about 23:45 on 17 December 2009 (in Japanese)
- 11 Sep 2009JMAMeasures to prevent false Earthquake Early Warnings (in Japanese)
- 11 Aug 2009JMAThe earthquake in Suruga Bay at about 05:07 on 11 August 2009 (in Japanese)
- 22 Jan 2009Cabinet OfficeThe earthquake centred in the northern coastal area of Iwate Prefecture (as of 22 January 2009) (in Japanese)
2008
- 28 Nov 2008JMAUse of Earthquake Early Warnings in the 2008 Iwate–Miyagi Nairiku Earthquake and the northern coastal Iwate earthquake (in Japanese)
- 11 Aug 2008JMAUse of Earthquake Early Warnings in the 2008 Iwate–Miyagi Nairiku Earthquake (in Japanese)
- 24 Jul 2008JMAThe earthquake in the northern coastal area of Iwate Prefecture at about 00:26 on 24 July 2008 (in Japanese)
- 20 Jun 2008JMAMore tsunami observation points in tsunami information: from 107 to 160 (in Japanese)
- 14 Jun 2008JMAThe earthquake in southern inland Iwate Prefecture at about 08:43 on 14 June 2008 (in Japanese)
2007
- 21 Nov 2007JMAPromulgation of the amended Meteorological Service Act: names of earthquake ground-motion and volcanic warnings (in Japanese)
- 21 Sep 2007JMAEarthquake Early Warnings to the general public from 09:00 on 1 October (in Japanese)
- 16 Jul 2007JMAThe earthquake off the Joetsu and Chuetsu coast of Niigata Prefecture at about 10:13 on 16 July 2007 (in Japanese)
- 23 Apr 2007Cabinet OfficeThe earthquake centred in central Mie Prefecture (5th report, as of 23 April 2007) (in Japanese)
- 25 Mar 2007JMAThe earthquake off the Noto Peninsula at about 09:42 on 25 March 2007 (in Japanese)
Photo list
How this page is built. Figures come from the official statistical releases linked above; where agencies publish provisional numbers we say so, because they are revised. Japanese statistics often use the fiscal year (April to March) and some are published only in Japanese, so we say which period each figure covers and translate titles. Photos are public-domain or Creative Commons images credited in each caption; file photos are illustrative and are not from the events described unless the caption says so. This page tracks trends and is not personal safety, medical, legal or financial advice.