Ground-Level Ozone: What the Evidence Shows
Key takeaways · 15 min read
- In 95 US cities, each 10 ppb rise in the previous week’s ozone was linked to a 0.52% rise in daily deaths.
- Long-term effects are less certain: one large US cohort found a 12% higher risk of respiratory death per 10 ppb, but a 2016 meta-analysis found no link between annual ozone and death from all causes.
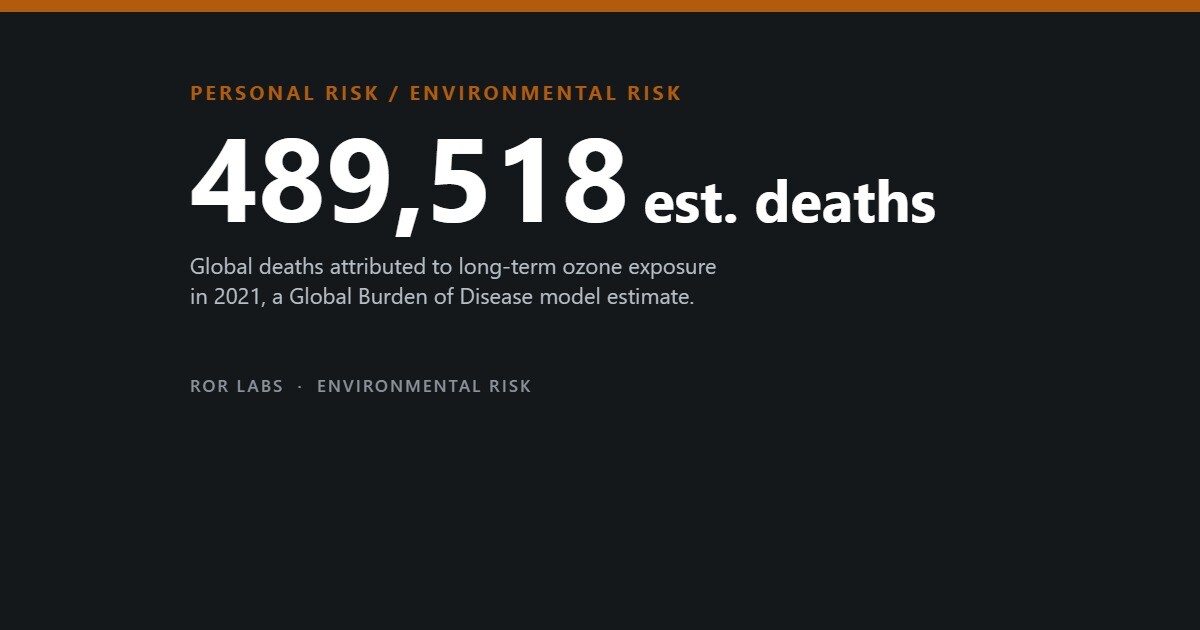
- Global Burden of Disease models attribute about 489,518 deaths in 2021 to long-term ozone exposure. That is a modelled estimate, not a count.
- Cutting nitrogen oxides can raise ozone in cities at first: during the 2020 lockdowns ozone rose by 14% to 36% in Rome, Nice, Turin and Wuhan.
In this article
Ozone high in the stratosphere shields us from ultraviolet light. Ozone at street level is a pollutant that inflames the airways, and it is at its worst on exactly the days people most want to be outside: hot, still, sunny afternoons in summer. Unlike soot, it is invisible, and nobody emits it directly. It cooks up in sunlight from other pollutants.
The headline figures are large. Global modelling attributes nearly half a million deaths a year to long-term ozone exposure, and in the United States more than 129 million people live in counties that the American Lung Association graded F for ozone in 2026. Behind those figures sits a body of evidence that is strong on short-term harm and much shakier on long-term harm.
This article sets out what the main studies found, how the death tolls are calculated, why cleaning up traffic can make ozone worse before it gets better, how heat feeds it, and why the usual personal defences, masks and air purifiers, mostly do not work against it.
What ground-level ozone is
Ground-level ozone forms when nitrogen oxides, mostly from vehicle engines and power plants, react with volatile organic compounds, from fuels, solvents and also trees, in the presence of sunlight. Because it needs light and warmth, ozone usually peaks in the afternoon and in summer, and it can drift far downwind of the cities where its ingredients were released. Rural and suburban areas can record higher levels than city centres.
Ozone is a strong oxidant. When it is breathed in, most of it reacts in the lining of the airways rather than travelling deep into the lungs. Controlled exposure studies and decades of air-quality work led the US Environmental Protection Agency to treat it as a cause of breathing problems, especially for people with asthma, children, older adults and those who exercise or work outdoors.
Ozone days and daily deaths
The landmark study on short-term effects was published in JAMA in 2004 by Michelle Bell and colleagues. Using the National Morbidity, Mortality, and Air Pollution Study, they analysed daily deaths in 95 large US urban communities from 1987 to 2000, adjusting for particulate matter, weather and season. A 10 ppb increase in the previous week’s ozone was associated with a 0.52% increase in daily deaths, and a 0.64% increase in deaths from heart and lung disease.
Ozone and daily deaths
Percentage increase in daily mortality per 10 ppb rise in ozone, by study and measure.
Sources: Bell ML et al., JAMA 292(19):2372–2378 (2004); Bell ML, Dominici F, Samet JM, Epidemiology (2005), doi:10.1097/01.ede.0000165817.40152.85. The meta-analysis pooled 144 estimates from 39 studies.
The percentages sound tiny because they are per day, but they apply to whole populations on many days a year. A 2005 meta-analysis by the same group pooled 144 estimates from 39 published city studies and found a larger effect, 0.87% per 10 ppb, against 0.25% for the same-day estimate in the national study. The authors read the gap as a sign of publication bias: striking city results were more likely to reach print.
Later work widened the map. A 2020 study in the BMJ covering 406 cities in 20 countries and 45 million deaths found a smaller link that varied between countries, and estimated 8,203 excess deaths a year in those cities from ozone above background levels. Short-term harm is the best-supported part of the ozone story.
The long-term question

Whether years of breathing ozone shorten lives is a harder question. The key study, by Michael Jerrett and colleagues in the New England Journal of Medicine in 2009, followed 448,850 adults in the American Cancer Society’s Cancer Prevention Study II for 18 years, during which 118,777 died. Ozone was not significantly linked to death from all causes, and its links with heart disease faded once fine particles were taken into account. The link with respiratory death held: each 10 ppb rise in summer ozone carried an estimated relative risk of 1.040, about 4% higher.
A larger re-analysis of the same cohort, by Michelle Turner and colleagues in 2016, covered 669,046 people and 237,201 deaths up to 2004, with better exposure estimates for each home. It found stronger links: the hazard of respiratory death was about 12% higher per 10 ppb in a model that also adjusted for fine particles and nitrogen dioxide, and ozone was also linked to circulatory deaths. Both studies drew on one cohort, recruited mainly through volunteers’ friends and relatives, which is not a random sample of Americans.
Long-term ozone and death: the studies disagree
Relative risk of death per 10 ppb higher long-term ozone. 1.00 means no difference.
| Study | Outcome | Risk per 10 ppb |
|---|---|---|
| Jerrett 2009, one US cohort | Respiratory deaths | 1.040 |
| Turner 2016, same cohort, larger | Respiratory deaths | 1.12 |
| Atkinson 2016, meta-analysis of cohorts, annual ozone | All deaths | 0.96 |
| Sun 2022, meta-analysis, warm-season ozone | All deaths | 1.014 |
| Sun 2022, meta-analysis, warm-season ozone | Respiratory deaths | 1.025 |
Sources: Jerrett M et al., NEJM 360(11):1085–1095 (2009); Turner MC et al., Am J Respir Crit Care Med 193(10):1134–1142 (2016); Atkinson RW et al., BMJ Open 6(2):e009493 (2016); Sun Z et al., The Innovation (2022). Exposure metrics differ between studies.
Other analyses are less clear-cut. A 2016 meta-analysis in BMJ Open by Richard Atkinson and colleagues pooled eight cohorts and found no evidence that annual ozone levels were linked to death from all causes, heart disease or lung disease; associations were more convincing for warm-season ozone and respiratory deaths. A 2022 meta-analysis that put 25 studies on a common exposure scale found small but significant pooled risks, with North American cohorts more consistently positive than European ones.
How the death tolls are made
Nobody has counted ozone deaths. Global estimates combine three things: a computer model of ozone levels across the planet, a risk estimate from cohort studies like the ones above, and a choice about the level below which ozone is assumed to be harmless. The State of Global Air report, drawing on the Global Burden of Disease study, put ozone-related deaths at 489,518 worldwide in 2021, including about 14,000 COPD deaths in the United States.
Modelled ozone deaths, not counted ones
Estimated deaths a year attributed to ozone, by study. Each uses different risk estimates, years and thresholds.
Sources: Health Effects Institute, State of Global Air 2024, using Global Burden of Disease 2021; Silva RA et al., Environmental Research Letters 8:034005 (2013); Vicedo-Cabrera AM et al., BMJ (2020). The 406-city figure covers only those cities and only short-term effects.
The answer moves with the inputs. A 2013 multi-model study estimated 470,000 respiratory deaths a year from man-made ozone, with a 95% range from 140,000 to 900,000, and found that uncertainty in the risk estimate mattered more than disagreement between the atmospheric models. Because most global estimates borrow their risk figure from the same American cohort, the choice between the Jerrett and Turner analyses, and the threshold below which ozone is assumed safe, does much of the work.
The 70 ppb standard
In the United States, ozone is regulated by a National Ambient Air Quality Standard measured as an eight-hour average. The EPA tightened it from 75 ppb to 70 ppb in 2015 and kept it at 70 ppb in 2020. The agency’s independent science advisers recommended in June 2023 a range of 55 to 60 ppb, saying 70 ppb underestimated risk. In August 2023 the EPA set aside that reconsideration and began a new full review, and the standard remains 70 ppb.
How strict is strict enough?
US eight-hour ozone standard and the 2023 advisory recommendation, parts per billion.
Sources: US EPA ozone NAAQS rules (2015, 2020); Clean Air Scientific Advisory Committee letter (June 2023), as summarised by the Harvard Environmental & Energy Law Program regulatory tracker.
Many people breathe air above the standard. The American Lung Association’s State of the Air 2026 report, covering 2022 to 2024, found that more than 129 million people lived in counties with failing grades for ozone, and that unhealthy ozone affected more people than in any of the previous five reports. Los Angeles has topped its ozone list in 26 of the report’s 27 years.
When cleaner air means more ozone
Ozone chemistry has a twist. In busy city centres, fresh nitric oxide from exhausts destroys ozone almost as fast as it forms, a process called titration. Where volatile organic compounds are scarce relative to nitrogen oxides, cutting traffic can therefore raise ozone locally. California saw this for decades as the weekend effect: in the South Coast Air Basin, ozone on weekends could be as much as 55% higher than on weekdays in similar weather, even though emissions were lower.
The 2020 lockdowns ran the experiment at scale. Compared with the same weeks in 2017 to 2019, daily mean ozone at urban stations rose by 36% in Wuhan, 27% in Turin, 24% in Nice and 14% in Rome, while nitrogen dioxide fell by more than half. A study of 246 sites across 34 European countries found ozone 21% to 30% higher than expected at the point of tightest restrictions.
The 2020 lockdown paradox
Change in daily mean ozone at urban stations during lockdown, against the same period in 2017–2019.
Source: Sicard P et al., Science of the Total Environment (2020), amplified ozone pollution in cities during the COVID-19 lockdown.
This is not an argument against cutting nitrogen oxides. Over a wide region, those cuts reduce ozone production, and keeping them up eventually wins. A national analysis found that the share of US monitoring sites with weekend peaks at least 5% higher than weekday peaks fell from about 35% in 1997–1999 to under 5% in 2008–2010, as emissions kept falling. The paradox is a phase, not a law.
Heat and the climate penalty
Heat speeds the reactions that make ozone, and hot spells often come with stagnant air. Researchers call the extra ozone the climate penalty. A study of 21 years of measurements in the rural eastern United States found ozone rose by about 3.2 ppb per degree Celsius before 2002. After power-plant nitrogen oxide emissions were cut by 43%, ozone fell by around 10% and the penalty shrank to about 2.2 ppb per degree.
The climate penalty depends on pollution
Change in surface ozone per degree Celsius of warming, ppb.
Sources: Bloomer BJ et al., Geophysical Research Letters (2009), doi:10.1029/2009GL037308; Zanis P et al., Environmental Research Letters (2022), doi:10.1088/1748-9326/ac4a34.
Warming is not bad for ozone everywhere. Climate models suggest that over oceans and other areas far from pollution sources, more water vapour destroys ozone, a global average benefit of about 0.96 ppb per degree. The penalty bites where people and emissions are concentrated. That is consistent with the Copernicus finding for 2026, which linked high ozone exposure to heatwaves and wildfires.
Masks, purifiers and staying indoors
Ozone is a gas, which rules out most of the personal protection people reach for during smoke or smog. The US National Institute for Occupational Safety and Health says plainly that N95 respirators, KN95s, disposable masks and cloth masks do not protect against gases or vapours. The EPA’s technical guide to home air cleaners says those designed only to remove particles cannot control gases.
Being indoors helps more. Ozone reacts with indoor surfaces, so levels inside are typically 10% to 50% of those outdoors, and typically below 10% in homes with central air conditioning. A review in Environmental Health Perspectives still estimated that 25% to 60% of a person’s daily ozone intake happens indoors, because people spend most of their time there. Activated carbon filters can remove some ozone, but they saturate and need replacing.
What helps and what does not
Personal protection against ozone, according to US agencies and indoor-air research.
N95, KN95, disposable and cloth masks: no protection against gases
Particle-only air purifiers: cannot control gases
Ozone-generating cleaners add ozone and should not be used in occupied rooms
Indoor ozone: 10–50% of outdoor levels
With central air conditioning: under 10%
Activated carbon removes some ozone but saturates
Sources: CDC/NIOSH, Types of respirators and masks; US EPA, Residential Air Cleaners: A Technical Summary, 3rd edition (2018); Weschler CJ, Environmental Health Perspectives (2006), doi:10.1289/ehp.9256.
One device makes things worse. Some air cleaners are sold as ozone generators. The EPA says they should not be used in occupied spaces and that no federal agency has approved them for that use; ozone also reacts with household chemicals to form formaldehyde and fine particles. The practical defences on high-ozone days are timing and place: outdoor exercise in the morning, when levels are usually lower, and closed windows in the afternoon.
What the evidence suggests
The short-term evidence is solid: on high-ozone days, more people die, especially from heart and lung disease, and the link holds across hundreds of cities. The long-term evidence is real but less settled, resting heavily on one American cohort, and the global death toll of about half a million is a modelled figure that moves with its assumptions. Ozone is also unusually hard to dodge. Masks and particle filters do not touch it, cleaning up traffic can raise it locally for a while, and heat makes it worse where most people live.
What to do
Steps sorted by when they matter. Each one says how strong the evidence is: Measured Official advice Untested
If it happens
- On high-ozone days, exercise outdoors in the morning, when levels are usually lower, and close the windows in the afternoon. Official advice see Sources
- Spend the high hours indoors. Indoor ozone is typically 10–50% of outdoor levels, and under 10% with central air conditioning. Measured see Sources
What not to do
- Do not rely on masks or particle-only purifiers. NIOSH and the EPA say they do not protect against gases. Official advice see Sources
- Do not run an ozone-generating air cleaner in an occupied room. It adds ozone. Official advice see Sources
Questions people ask
Is ground-level ozone the same as the ozone layer?
It is the same molecule in a different place. High in the stratosphere it blocks ultraviolet light; near the ground it is a pollutant that irritates the airways.
Does an N95 mask protect against ozone?
No. US occupational health authorities say N95s and other masks do not protect against gases or vapours, and ozone is a gas.
Will an air purifier remove ozone?
Particle-only purifiers will not. Activated carbon can remove some ozone but saturates. Avoid devices that deliberately generate ozone.
When is ozone usually highest?
On hot, sunny, still days, typically in the afternoon and early evening during summer. Morning levels are usually lower.
How many people does ozone kill?
Global Burden of Disease modelling attributes about 489,518 deaths in 2021 to long-term exposure. It is an estimate built on assumptions, not a count of deaths.
The short version
- In 95 US cities, each 10 ppb rise in the previous week’s ozone was linked to a 0.52% rise in daily deaths.
- Long-term effects are less certain: one large US cohort found a 12% higher risk of respiratory death per 10 ppb, but a 2016 meta-analysis found no link between annual ozone and death from all causes.
- Global Burden of Disease models attribute about 489,518 deaths in 2021 to long-term ozone exposure. That is a modelled estimate, not a count.
- Cutting nitrogen oxides can raise ozone in cities at first: during the 2020 lockdowns ozone rose by 14% to 36% in Rome, Nice, Turin and Wuhan.
- Masks and particle-only purifiers do not filter ozone; staying indoors with windows shut in the afternoon cuts exposure most.
This article summarises published research and agency guidance for general information. It is not medical advice. On high-ozone days, follow your local official air-quality alerts, such as AirNow in the United States or your national air-quality service. If you have asthma, heart or lung disease, or symptoms such as chest tightness or wheezing, ask a doctor how to plan for ozone days.
Further reading: Bell et al., JAMA 292(19) (2004), for the 95-city study of short-term deaths. Turner et al., American Journal of Respiratory and Critical Care Medicine 193(10) (2016), for the main long-term analysis. Sicard et al., Science of the Total Environment (2020), for what the lockdowns did to urban ozone.
- Choked, Beth Gardiner (2019). A journalist travels from London to Delhi to report on air pollution and the people working to clean it up. Vivid and well sourced; it gives more space to particles and diesel than to ozone.
- Clearing the Air, Tim Smedley (2019). A history of air pollution and of the policies that have reduced it. Useful on why smog chemistry is hard to fix; written before the lockdown evidence on ozone.
- The Uninhabitable Earth, David Wallace-Wells (2019). A wide survey of climate risks, including a chapter on air. Good on how heat and pollution compound; its tone leans towards worst-case scenarios.
Sources
- Bell ML, McDermott A, Zeger SL, Samet JM, Dominici F. JAMA 292(19):2372–2378 (2004), doi:10.1001/jama.292.19.2372.
- Bell ML, Dominici F, Samet JM. Epidemiology (2005), doi:10.1097/01.ede.0000165817.40152.85.
- Vicedo-Cabrera AM et al. Short term association between ozone and mortality: global two stage time series study in 406 locations in 20 countries. BMJ (2020).
- Jerrett M et al. NEJM 360(11):1085–1095 (2009), doi:10.1056/NEJMoa0803894.
- Turner MC et al. Am J Respir Crit Care Med 193(10):1134–1142 (2016), doi:10.1164/rccm.201508-1633OC.
- Atkinson RW et al. BMJ Open 6(2):e009493 (2016).
- Sun Z et al. Cohort-based long-term ozone exposure-associated mortality risks with adjusted metrics. The Innovation (2022).
- Silva RA et al. Environ Res Lett 8:034005 (2013).
- Health Effects Institute. State of Global Air 2024, press release (June 2024).
- Harvard Environmental & Energy Law Program, regulatory tracker: National Ambient Air Quality Standards for ozone (accessed October 2026).
- American Lung Association. State of the Air 2026, key findings; ABC News, 22 April 2026.
- Chinkin LR et al. J Air Waste Manag Assoc (2003), doi:10.1080/10473289.2003.10466223.
- Wolff GT, Kahlbaum DF, Heuss JM. J Air Waste Manag Assoc (2013), doi:10.1080/10962247.2012.749312.
- Sicard P et al. Sci Total Environ (2020), amplified ozone pollution in cities during the COVID-19 lockdown.
- Grange SK et al. Atmos Chem Phys 21:4169 (2021).
- Bloomer BJ et al. Geophys Res Lett (2009), doi:10.1029/2009GL037308.
- Zanis P et al. Environ Res Lett (2022), doi:10.1088/1748-9326/ac4a34.
- CDC/NIOSH. Types of respirators and masks (accessed October 2026).
- US EPA. Residential Air Cleaners: A Technical Summary, 3rd edition (2018).
- Weschler CJ. Environ Health Perspect 114(10) (2006), doi:10.1289/ehp.9256.
- Copernicus Atmosphere Monitoring Service data, reported by ABC News, 29 September 2026.