PFAS in Drinking Water: What the Evidence Shows
Key takeaways · 15 min read
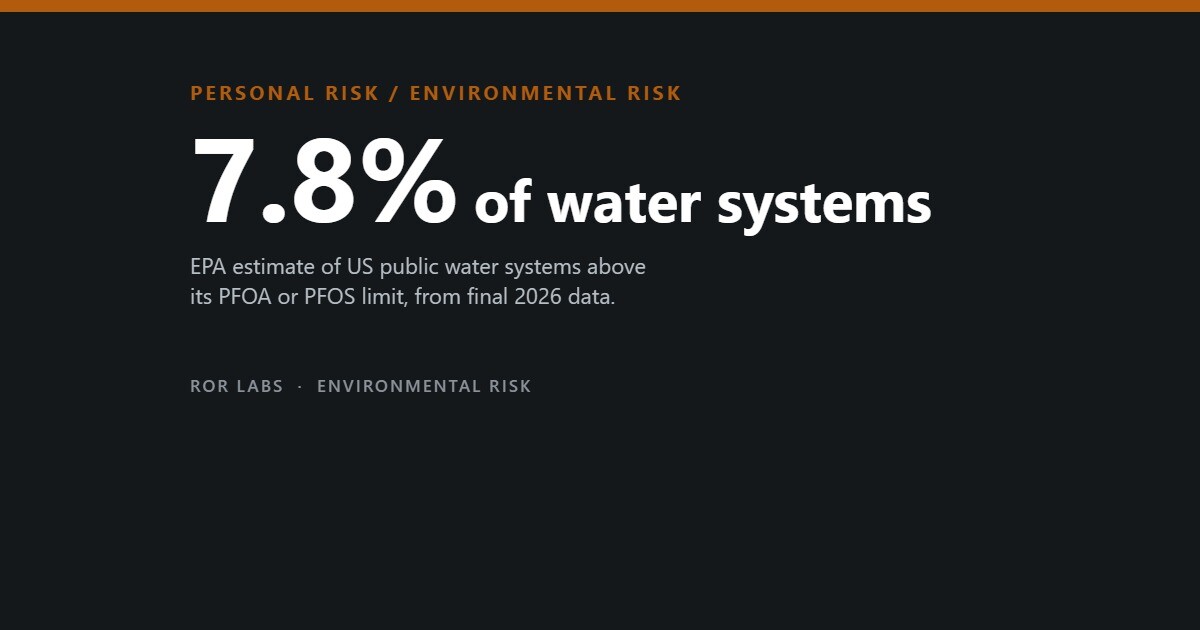
- Final US monitoring data released in August 2026 led the EPA to estimate that 7.8% of public water systems would exceed its new limit for PFOA or PFOS.
- In a heavily exposed Ohio Valley community, higher PFOA exposure was linked to kidney and testicular cancer, but most other cancers showed no link.
- Many PFAS findings are associations, and some are partly explained by the body itself: reduced kidney filtration raises blood PFAS and is linked to lower birth weight.
- Under-sink reverse osmosis and two-stage filters removed nearly all PFAS in homes; some simple carbon pitcher filters removed little or none.
PFAS, short for per- and polyfluoroalkyl substances, are a family of thousands of man-made chemicals that repel water, grease and heat. They have been used in non-stick coatings, stain-resistant fabrics, food packaging and firefighting foam since the 1950s. Their carbon–fluorine bonds are among the strongest in chemistry, which is why they work so well and why they barely break down. Hence the nickname: forever chemicals.
Drinking water is one of the main routes into the body. In 2024 the US Environmental Protection Agency set its first enforceable limits, 4 parts per trillion for the two best-known compounds, PFOA and PFOS. In 2026 it proposed dropping limits for four others and giving utilities two more years to comply. The science behind those numbers is stronger in some places than others.
This article looks at how many people drink PFAS, what the most heavily exposed community has shown about cancer, where association ends and causation begins, what happened to the federal limits, and what the research says about filters you can fit at home. It is written for readers who want the numbers, including the ones that complicate the headlines.

What PFAS are
PFAS reach drinking water from factories that make or use them, from firefighting foam used at airports and military bases, from landfills and from wastewater. A national analysis of US monitoring data from 2013 to 2015 found that the number of industrial sites, military fire-training areas and wastewater treatment plants in a watershed all predicted PFAS in its public water. Each additional military site was linked to 35% higher PFOS levels.
Once swallowed, the long-chain compounds stay. When the Swedish town of Ronneby switched a third of its households to clean water in December 2013, after decades of contamination from an airfield, researchers tracked residents’ blood for years. The average half-life was 2.47 years for PFOA and 2.73 years for the main form of PFOS. Cutting exposure today lowers blood levels slowly, not overnight.
How many people drink it
The answer depends almost entirely on how low the laboratory can measure. Older federal testing used reporting limits of 10 to 90 parts per trillion and found detectable PFAS in only about 4% of systems; on that basis, supplies for about 6 million Americans exceeded the old advisory level of 70 parts per trillion. With detection limits below 1 part per trillion, the picture changes completely.
How many Americans drink PFAS?
Estimates of exposure through US drinking water, by study and threshold.
Sources: Andrews DQ, Naidenko OV, Environ Sci Technol Lett (2020), doi:10.1021/acs.estlett.0c00713; Hu XC et al., Environ Sci Technol Lett (2016), doi:10.1021/acs.estlett.6b00260; Smalling KL et al., Environ Int (2023), doi:10.1016/j.envint.2023.108033; US EPA UCMR 5 final data (August 2026). The 80 million bar shows the top of a modelled range.
A 2020 analysis by researchers at the Environmental Working Group, an advocacy organisation, estimated that 18 to 80 million Americans received tap water with at least 10 parts per trillion of PFOA and PFOS combined, and more than 200 million at least 1 part per trillion. The wide range is the honest part: it reflects how patchy the testing was. It is a modelled estimate, not a headcount.
Direct measurement tells a similar story. The US Geological Survey sampled 716 kitchen taps between 2016 and 2021 and detected at least one PFAS in 30% of them: 40% of public-supply taps and 20% of private wells. The most complete federal dataset, released in August 2026, covered more than 10,000 public water systems. From it the EPA estimated that 7.8% of systems would breach its new limit for PFOA or PFOS.
The Ohio Valley evidence
The most important human evidence comes from communities around a DuPont plant near Parkersburg, West Virginia, where PFOA from the factory entered local water supplies for decades. A class-action settlement paid for a large community health survey and an independent C8 Science Panel of three epidemiologists. In 2012 the panel found probable links between PFOA and high cholesterol, thyroid disease, kidney cancer, testicular cancer, pregnancy-induced high blood pressure and ulcerative colitis.
The key cancer study, published in 2013, followed 32,254 residents and workers and validated 2,507 cancers against medical records and registries. For each unit increase in log cumulative blood PFOA, the hazard of testicular cancer was 1.34 times higher and of kidney cancer 1.10 times higher. Most of the other 19 cancer types showed nothing: breast, prostate, bladder and colorectal cancer hazards sat at or near 1.
PFOA and cancer in the Ohio Valley cohort
Hazard ratio per unit of log cumulative blood PFOA, 32,254 residents and workers. 1.00 means no difference.
| Cancer | Cases | Hazard ratio (95% CI) |
|---|---|---|
| Testicular | 17 | 1.34 (1.00–1.79) |
| Kidney | 105 | 1.10 (0.98–1.24) |
| Thyroid | 86 | 1.10 (0.95–1.26) |
| Bladder | 105 | 1.00 (0.89–1.12) |
| Prostate | 446 | 0.99 (0.93–1.04) |
| Breast | 559 | 0.94 (0.89–1.00) |
Source: Barry V, Winquist A, Steenland K, Environ Health Perspect (2013), doi:10.1289/ehp.1306615, Table 4, no lag. Models adjusted for smoking, alcohol, sex, education and birth period.
The numbers are small. Only 17 testicular cancers drove the strongest result, and its confidence interval touches 1. The authors also flagged a survivor problem: people had to be alive around 2005 to join, so fatal cancers diagnosed earlier could be missing. An updated analysis published in 2026, with about ten more years of follow-up for 32,050 people, again found positive associations with kidney and testicular cancer.
Association or causation

Experts read the same studies differently. A 2021 meta-analysis by Scott Bartell and Verónica Vieira, converting results to a common blood scale, found that each 10 nanograms per millilitre of serum PFOA was associated with 16% higher kidney cancer risk and 3% higher testicular cancer risk. They judged the links most likely causal, while noting few testicular studies and overlapping study populations. In November 2023 the International Agency for Research on Cancer classified PFOA as carcinogenic to humans and PFOS as possibly carcinogenic.
Others disagree. A 2014 review found most cancer risk estimates for PFOA and PFOS between 0.5 and 2.0, with confidence intervals including no effect, and a 2024 commentary by consultants argued the agency had overstated weak, inconsistent evidence. Former C8 panel members themselves called the kidney and testicular evidence supportive but not definitive in 2020. They also noted a consistent link with raised cholesterol but no evidence of more heart disease, which is a puzzle in its own right, because cholesterol is meant to be on the path to heart disease.
Reading the PFAS evidence
What supports a causal link, and what complicates it.
Kidney cancer: +16% per 10 ng/mL serum PFOA, meta-analysis
IARC 2023: PFOA Group 1, carcinogenic
Animal studies and a dose–response pattern in the most exposed community
Testicular result rests on 17 cases
Cholesterol up, but no clear rise in heart disease
Low kidney filtration raises blood PFAS and is itself linked to some outcomes
Sources: Bartell SM, Vieira VM, J Air Waste Manag Assoc 71(6) (2021), doi:10.1080/10962247.2021.1909668; Barry V et al., Environ Health Perspect (2013); Steenland K et al., Environ Int (2020); Verner M-A et al., Environ Health Perspect (2015), doi:10.1289/ehp.1408837.
A subtler problem is that the body can create associations by itself. Kidneys clear PFAS, so people whose kidneys filter less tend to have higher blood levels. During pregnancy, lower filtration is also linked to smaller babies. A 2015 modelling study concluded that this shared cause explained a portion, though not all, of the reported link between PFAS and lower birth weight, so many studies may have overstated it. Similar reverse-causation questions hang over studies linking PFAS to kidney function.
Vaccines and the immune system
Some of the most cited PFAS evidence is not about cancer at all. In the Faroe Islands, Philippe Grandjean and colleagues measured tetanus and diphtheria antibodies in 587 vaccinated children. A doubling of the mother’s PFOS level during pregnancy was linked to 39% lower diphtheria antibodies at age five. A doubling of PFAS measured at five was linked to 49% lower antibodies at seven.
PFAS and childhood vaccine response
Faroe Islands birth cohort, 587 children vaccinated against tetanus and diphtheria.
Source: Grandjean P et al., JAMA (2012), as summarised by Potera C, Environ Health Perspect 120(4) (2012), doi:10.1289/ehp.120-a150a. The grey bars describe the whole cohort, not only the most exposed children.
The study is careful but has limits. Antibody level is a marker, not a disease, and the study did not show that children caught more tetanus or diphtheria; those with low antibodies were simply revaccinated. The cohort is a small island population, and how much of its PFAS came from water rather than food was not established. Even so, the results put immune effects at the centre of the PFAS debate, alongside cancer.
The 4 ppt limit and its timeline
In April 2024 the EPA finalised the first national PFAS drinking water standard. It set enforceable limits of 4.0 parts per trillion each for PFOA and PFOS, with a health goal of zero, alongside 10 parts per trillion for PFHxS, PFNA and HFPO-DA (known as GenX), and a hazard index for mixtures. Utilities were to finish monitoring by 2027 and comply by 2029. The agency said the rule would cut exposure for about 100 million people.
How far the limits have moved
US federal PFOA and PFOS benchmarks for drinking water, parts per trillion.
Sources: US EPA, PFAS National Primary Drinking Water Regulation (April 2024); EPA proposed rules of May 2026, as summarised by Jones Day (May 2026); Hu XC et al. (2016) for the 2016 advisory.
The timeline then shifted. In May 2026 the EPA proposed two changes: rescinding the limits for PFHxS, PFNA, GenX and the mixture index, saying it had not followed the proper procedure in 2024, and allowing systems two more years, to April 2031, to meet the PFOA and PFOS limits. Systems at or above 12 parts per trillion would have to take interim measures in the meantime. Comments closed in July 2026, and the 2024 rule also faces legal challenges.
Private wells and farm fields

Federal limits apply to public water systems. They do not cover private wells, which in most places are tested only if the owner arranges and pays for it. The USGS tap study found that private wells were less likely than public supplies to contain PFAS, 20% against 40%, but when they did, median concentrations were similar. Its screening found higher combined risk scores in well water.
Pennsylvania shows how wells get contaminated far from any factory. Sewage sludge, which concentrates PFAS from homes and industry, has been spread on farmland as fertiliser for decades; state officials estimate 400,000 tons are applied to land each year. By May 2026, 115 of 285 wells sampled near treated fields exceeded federal limits.
What home filters can do
Filters vary enormously, and the best evidence comes from testing them in real kitchens. A 2020 study sampled water before and after filters in 73 North Carolina homes. Under-sink reverse osmosis systems and two-stage under-sink filters removed nearly all of the PFAS measured. Other carbon filters, including pitchers, tap-mounted and fridge filters, were variable, removing roughly 60% to 70% of long-chain compounds and less of short-chain ones.
Not all filters are equal
PFAS removal measured in real homes, by filter type and study.
Sources: Mulhern R et al., AWWA Water Science (2021), doi:10.1002/aws2.1262; Herkert NJ et al., Environ Sci Technol Lett (2020), doi:10.1021/acs.estlett.0c00004; Cserbik D et al., npj Clean Water (2023). Removal depends on the product, cartridge age and the PFAS mix.
Maintenance matters as much as design. A study of 18 North Carolina homes on private wells found that under-sink carbon block filters removed 97% to 99% of 17 PFAS, as long as cartridges were changed on schedule. In Barcelona, by contrast, carbon pitcher filters in everyday use made no measurable difference: median PFAS was 32.0 nanograms per litre before filtering and 33.0 after, and some samples rose. Reverse osmosis in the same study removed them.
Certification is a useful but imperfect guide. In 2019 the NSF/ANSI 53 and 58 standards added a PFOA and PFOS reduction claim, which required devices to bring water below the then 70 parts per trillion advisory, far above today’s 4 parts per trillion limit. A certification is worth checking for the specific PFAS claim, but it is not proof that a filter reaches the new limit, and reverse osmosis units also waste water and remove minerals.
What the evidence suggests
PFAS in drinking water are widespread at low levels and concentrated at high levels near specific sources: factories, airfields, bases and, increasingly, farmland treated with sludge. The strongest human evidence for harm comes from heavily exposed communities and points to kidney and testicular cancer, raised cholesterol and weaker vaccine responses, though experts still argue over causation and some associations are inflated by kidney physiology. The federal limit is strict, but the current proposal would move its deadline to 2031. The best-tested home defence is an under-sink reverse osmosis or two-stage filter, maintained on schedule.
What to do
Steps sorted by when they matter. Each one says how strong the evidence is: Measured Official advice Untested
Before
- If you are on a private well, test it yourself. Federal limits do not cover wells, and nobody else will. Official advice see Sources
- If you filter, choose under-sink reverse osmosis or a two-stage under-sink filter. These removed nearly all PFAS in real homes. Measured see Sources
- Change cartridges on schedule. Under-sink carbon block filters removed 97% to 99% only while maintained. Measured see Sources
What not to do
- Do not count on a carbon pitcher. In everyday use in Barcelona they made no measurable difference. Measured see Sources
- Do not read an NSF/ANSI certification as proof a filter meets today’s 4 ppt limit. The claim was set at 70 ppt. Official advice see Sources
Questions people ask
How do I find out if my tap water has PFAS?
If you are on a public supply, your utility’s annual water quality report and the EPA’s UCMR 5 data list results. Private well owners need to commission a test from a certified laboratory.
Does boiling water remove PFAS?
No. PFAS do not break down at cooking temperatures, so boiling leaves them in the water.
Is bottled water free of PFAS?
Not necessarily. A 2024 study detected PFOA and PFOS in more than 99% of bottled waters sampled from 15 countries, though mostly at low levels.
Which filters work best?
In home testing, under-sink reverse osmosis and two-stage carbon filters removed nearly all PFAS. Pitcher filters were inconsistent, and any filter stops working if its cartridge is not replaced.
Does PFAS in water cause cancer?
In heavily exposed communities PFOA is linked to kidney and testicular cancer, and the WHO cancer agency classes it as carcinogenic. Risk at typical low levels is much less certain.
The short version
- Final US monitoring data released in August 2026 led the EPA to estimate that 7.8% of public water systems would exceed its new limit for PFOA or PFOS.
- In a heavily exposed Ohio Valley community, higher PFOA exposure was linked to kidney and testicular cancer, but most other cancers showed no link.
- Many PFAS findings are associations, and some are partly explained by the body itself: reduced kidney filtration raises blood PFAS and is linked to lower birth weight.
- Under-sink reverse osmosis and two-stage filters removed nearly all PFAS in homes; some simple carbon pitcher filters removed little or none.
- The EPA’s 4 ppt limit for PFOA and PFOS stands, but a 2026 proposal would push compliance to 2031 and drop limits for four other PFAS.
This article summarises published research and agency documents for general information. It is not medical advice and not a water test. For results and advisories about your supply, check with your local water utility or your state or national drinking water authority; private well owners should use a certified laboratory. If you are worried about past exposure or your health, talk to a doctor.
Further reading: Barry et al., Environmental Health Perspectives (2013), for the Ohio Valley cancer study. Bartell and Vieira, Journal of the Air & Waste Management Association 71(6) (2021), for the case that the kidney link is causal. Herkert et al., Environmental Science & Technology Letters (2020), for how home filters perform in real kitchens.
- Exposure, Robert Bilott (2019). The lawyer behind the Parkersburg litigation tells how the PFOA case was built. Gripping and first-hand; it is one side’s account of a legal battle, not a review of the science.
- Forever Chemicals, edited by David M. Kempisty and LeeAnn Racz (2021). A technical collection on PFAS in the environment, treatment and equity. Thorough on water treatment; dense and priced for professionals.
- Count Down, Shanna H. Swan with Stacey Colino (2021). An epidemiologist on everyday chemicals and reproductive health. Readable and wide-ranging; PFAS are only part of the story and some claims go beyond the data.
Sources
Hu XC et al. Environ Sci Technol Lett (2016), doi:10.1021/acs.estlett.6b00260. — Andrews DQ, Naidenko OV. Environ Sci Technol Lett (2020), doi:10.1021/acs.estlett.0c00713. — Smalling KL et al. Environ Int (2023), doi:10.1016/j.envint.2023.108033. — Li Y et al. Determinants of serum half-lives for linear and branched perfluoroalkyl substances, Ronneby, Sweden. Environ Int (2022). — Barry V, Winquist A, Steenland K. Environ Health Perspect (2013), doi:10.1289/ehp.1306615. — Hofmann JN et al. PFOA and cancer incidence: an updated investigation of a cohort in the mid-Ohio Valley. Environ Int (2026). — Bartell SM, Vieira VM. J Air Waste Manag Assoc 71(6) (2021), doi:10.1080/10962247.2021.1909668. — Chang ET et al. Crit Rev Toxicol (2014), doi:10.3109/10408444.2014.905767. — Steenland K et al. Evolution of evidence on PFOA and health following the assessments of the C8 Science Panel. Environ Int (2020). — Drury NL, Prueitt RL, Beck BD. Regul Toxicol Pharmacol (2024), doi:10.1016/j.yrtph.2024.105726. — Verner M-A et al. Environ Health Perspect (2015), doi:10.1289/ehp.1408837. — Grandjean P et al. JAMA (2012); Potera C. Environ Health Perspect 120(4) (2012), doi:10.1289/ehp.120-a150a. — US EPA. Per- and Polyfluoroalkyl Substances National Primary Drinking Water Regulation (April 2024) and proposed rules (May 2026). — Jones Day. EPA proposes to rescind certain PFAS drinking water standards and extend compliance deadlines (May 2026). — US EPA. Fifth Unregulated Contaminant Monitoring Rule final data (August 2026); Water Online, 27 August 2026. — Herkert NJ et al. Environ Sci Technol Lett (2020), doi:10.1021/acs.estlett.0c00004. — Mulhern R et al. AWWA Water Science (2021), doi:10.1002/aws2.1262. — Cserbik D et al. Human exposure to PFAS and other emerging contaminants in drinking water. npj Clean Water (2023). — NSF/ANSI 53 and 58 PFOA/PFOS reduction claims, Water Online, 21 May 2019. — Gao C et al. Factors influencing concentrations of PFAS in drinking water. ACS ES&T Water (2024). — Spotlight PA and Inside Climate News, 28 September 2026.