Vitamin D: Food Sources, Sunlight, and What the Trials Found
In This Series: Nutrients
- Which Nutrients Are You Actually Short Of?
- How Nutrients Are Classified — and What the Reference Numbers Mean
- Vitamin A: Food Sources, Deficiency, and Safe Limits
- Vitamin C: Food Sources, Scurvy, and the Ceiling the Body Sets
- Vitamin D2 vs D3: What the Head-to-Head Trials Found
- Riboflavin: Food Sources, Deficiency, and the Migraine Trials
- Thiamin: Food Sources, Beriberi, and Why There Is No Upper Limit
- Calcium: Food Sources, Bone Density, and What the Trials Found
Key takeaways · 11 min read
- Made in skin from UVB at 290–320 nm. Its established job is calcium absorption and bone mineralisation.
- Per tablespoon: cod liver oil 34.0 µg, canned sockeye 3.15, cooked trout 2.85. Nothing else is close, and cod flesh has 278 times less than cod liver oil.
- Average US intake from food is about a third of the RDA, yet only 5 per cent are deficient. The missing input is skin, and no food table shows it.
- Deficiency is rickets in children, osteomalacia in adults. Fortification from the 1930s made rickets rare; it is returning in places.
Vitamin D is the awkward entry in a series about food. It is the only nutrient here whose main supply comes from something other than eating, and the only one the body makes for itself given a raw material and some light. Strictly it is not a vitamin at all but a hormone precursor, classed as a vitamin because enough of us live indoors that we have to be fed it.
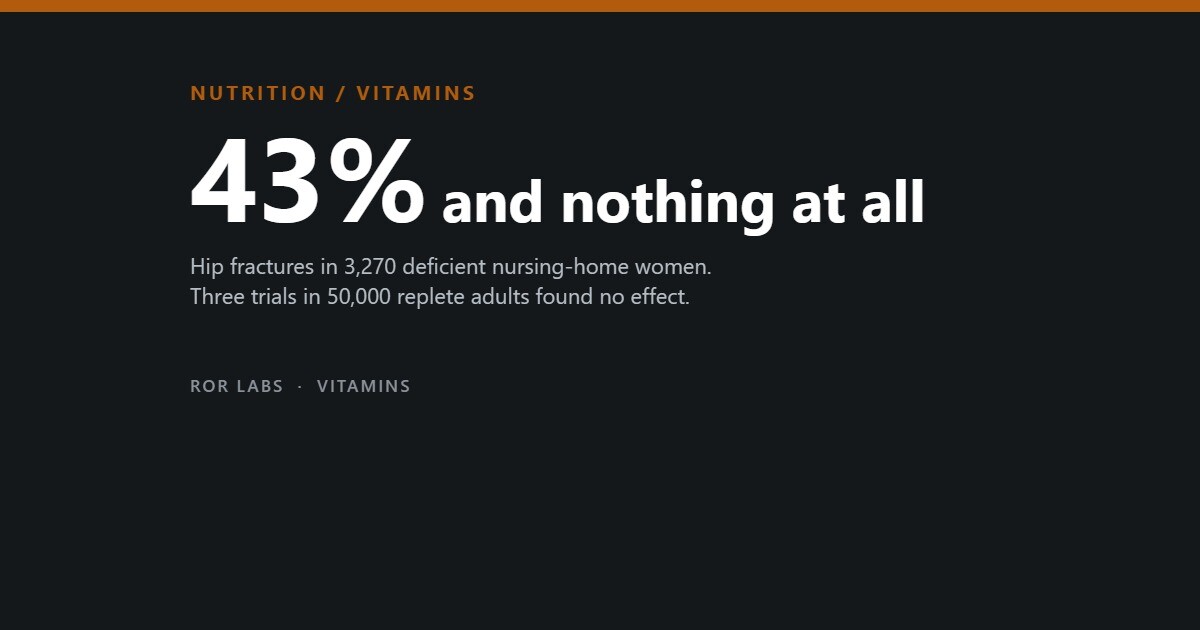
That bends everything below. The food table is accurate and almost beside the point; the deficiency figures do not match the intake figures; and the large trials of supplements came back mostly empty, while one much smaller and older trial came back with a 43 per cent cut in hip fracture. Both are real, and why they differ is the most useful thing on this page.
This is the second vitamin entry in this appendix: what the nutrient does, which foods carry it per measured spoonful, what running short does, and what the reference numbers are.
What it does
Ultraviolet B at roughly 290 to 320 nanometres reaches uncovered skin and converts 7-dehydrocholesterol into previtamin D3. The liver turns that into 25-hydroxyvitamin D — 25(OH)D, the circulating form, and the one a blood test measures — and the kidney converts a fraction again into 1,25-dihydroxyvitamin D, the active hormone.
Its established job is calcium: how much calcium and phosphate the gut absorbs, and how the skeleton mineralises. Without enough, dietary calcium is largely wasted — the mineral passes through. That is the whole of the settled biology, worth holding onto, because most of what else has been attributed to vitamin D is an association still looking for a trial.
The three foods that carry the most per spoonful
Ranked by what fits on a level tablespoon, using the US Department of Agriculture’s composition values, vitamin D produces the steepest drop in this series.
Vitamin D per level tablespoon
USDA SR Legacy values for vitamin D (D2 + D3) per 100 g, converted to one level tablespoon: 15 g for solids, 13.6 g for oil. Share is of the 15 µg (600 IU) adult RDA.
| Food (USDA FDC ID) | Per 100 g | Per tablespoon | Share of RDA |
|---|---|---|---|
| Cod liver oil (173577) | 250 µg | 34.0 µg | 227% |
| Salmon, sockeye, canned, drained (173693) | 21.0 µg | 3.15 µg | 21% |
| Trout, rainbow, farmed, cooked (173718) | 19.0 µg | 2.85 µg | 19% |
| Salmon, sockeye, cooked (173692) | 16.7 µg | 2.51 µg | 17% |
| Salmon, sockeye, raw (173691) | 14.1 µg | 2.12 µg | 14% |
| Herring, Atlantic, cooked (175117) | 5.4 µg | 0.81 µg | 5% |
| Cod, Atlantic, raw (171955) | 0.9 µg | 0.14 µg | 1% |
Source: USDA FoodData Central, SR Legacy. Tablespoon figures are conversions at the stated weights. 1 µg = 40 IU.
Two things fall out. Cod liver oil carries eleven times what the next food does, and after it the list drops off a cliff — no ordinary food gives you a quarter of a day on a spoon. And the last row against the first: cod flesh holds 0.9 µg per 100 g, the oil pressed from the same fish’s liver 250, some two hundred and eighty times as much. The fish is not a vitamin D food. Its liver is.
The arithmetic checks against an independent table: the NIH Office of Dietary Supplements lists cod liver oil at 34.0 µg per tablespoon, cooked trout at 16.2 per three ounces and cooked sockeye at 14.2, and converting the USDA values to the same weights gives 34.0, 16.2 and 14.2.
The source that is not in the table
Here is where vitamin D stops behaving like a nutrient. In 2015–2016 the average American adult got 5.1 µg a day from food if male and 4.2 if female — about a third of the RDA, fortified milk and cereal included. If food were the whole story deficiency would be near-universal. It is not: in the 2011–2014 national survey 5 per cent of Americans were below the deficiency threshold of 30 nmol/L and 18 per cent sat in the inadequate band from 30 to 49. Three quarters were fine on a third of the recommended intake. The missing input is skin, and it appears in no food table ever printed.
Which is why nobody can tell you how many minutes of sun you need. The ODS lists the variables and declines to give a number: season, time of day, length of day, cloud cover, smog, melanin and sunscreen. Two more matter as much. UVB does not pass through glass, so a sunny room produces nothing at all; and sunscreen at SPF 8 or above blocks the wavelengths involved, though in practice, as the same fact sheet notes dryly, people do not apply enough of it or reapply it.
The spread underneath follows sunlight and skin: 17.5 per cent of non-Hispanic Black Americans were below the deficiency threshold, against 7.6 per cent of non-Hispanic Asian, 5.9 of Hispanic and 2.1 of non-Hispanic white Americans. The age pattern is the opposite of the expected one — the peak was adults aged 20 to 39, at 7.6 per cent, against 2.9 for the over-60s.
What running short does
The deficiency disease is mineralisation failure: rickets in children, where bone fails to harden and deforms, and osteomalacia in adults, where remodelled bone is laid down incompletely. Both are caused by shortage and both respond to correcting it. This is also one of the clearest public health wins on record — fortifying milk and other staples from the 1930s, with cod liver oil, made rickets rare in the United States. It has been returning in places, largely among immigrant populations: the win was engineered, not permanent.
Who runs short is predictable. Breastfed infants, since breast milk carries little and only 20.5 per cent receive the recommended supplement. Anyone who cannot absorb fat — liver disease, cystic fibrosis, coeliac disease, Crohn’s, ulcerative colitis. People rarely outdoors or who cover their skin; people with darker skin at high latitudes; and people with a BMI of 30 or above, or after gastric bypass, who consistently show lower serum levels.
The trials, and why they disagree
From about 2005 vitamin D became the most-tested supplement in medicine, on the strength of observational data linking low levels to almost everything. Three very large randomised trials then reported, and came back close to flat.
Fracture risk in the large supplementation trials
Hazard ratios. Below 1.00 favours supplementation; bars show distance from 1.00 either way, full bar = 25 per cent.
Sources: Dawson-Hughes, B., Metabolism Open, 2024, 100300, reviewing LeBoff et al. 2022 (VITAL), Waterhouse et al. 2023 (D-Health), Khaw et al. 2017 (ViDA) and Chapuy et al., NEJM 327, 1992. The Chapuy figure is hip fracture; the others are total or non-vertebral fracture.
VITAL gave 2,000 IU a day to 25,871 adults for 5.3 years: total fracture hazard ratio 0.98 (0.89–1.08), hip fracture 1.01 (0.70–1.47), odds of two or more falls 0.97. D-Health, 20,326 people on 60,000 IU monthly, gave 0.94 for fracture and 1.11 for hip. ViDA, 5,108 people on 100,000 IU monthly, gave 1.19 for non-vertebral fracture — pointing the wrong way, with an interval covering both real harm and real benefit.
Now the other trial. In 1992 Chapuy and colleagues gave 3,270 French nursing-home women, mean age 84.6, 800 IU of vitamin D3 with 1.2 grams of calcium for eighteen months. Hip fractures fell by 43 per cent and other non-vertebral fractures by 32. Nothing about that result has been overturned.
The difference is not the dose or the quality of the trials. It is who was in them. VITAL’s participants began at a mean 25(OH)D of 30.2 ng/mL, above every sufficiency threshold anyone proposes; Chapuy’s began at 16, below the deficiency line, on a calcium intake of 511 mg a day that is itself inadequate. One trial treated a deficiency; the other added a nutrient to people who already had enough, and found what you would expect.
That lesson is not confined to vitamin D. A supplement is a treatment for a shortage, and testing it in people without the shortage answers a different question. VITAL did look: even in the subgroup starting below 12 ng/mL falls did not move — though that subgroup was small, the usual fate of the people a trial most needed to enrol.
The other end of the range
Vitamin D does not simply stop helping above the sufficiency line. Its relationship with falls appears U-shaped, the low point somewhere around 20 to 40 ng/mL; above 60 ng/mL the odds of two or more falls have been reported at 1.99 (1.2–3.3). In D-Health the subgroup with a BMI below 25 — whose levels rise most on a given dose — had a fall odds ratio of 1.25 (1.09–1.43). STURDY compared 1,000 IU a day against 200 and recorded more serious falls on the higher dose; a single annual dose of 500,000 IU raised falls by 15 per cent and fractures by 26.
True toxicity sits much higher and is unambiguous: hypercalcaemia, typically above 375 nmol/L (150 ng/mL), producing nausea, muscle weakness, confusion, thirst and kidney stones, and in extreme cases renal failure, calcification of soft tissue including heart valves, and death. It is essentially always caused by supplements. Sunlight does not cause it, and neither does food.
The numbers, and where they came from
The RDA is 15 µg (600 IU) a day from age 1 to 70 and 20 µg (800 IU) above 70, with an adequate intake of 10 µg (400 IU) for infants; the upper level is 100 µg (4,000 IU) from age 9 up. The recommendation is deliberately written for someone who gets no sun at all, which is part of why measured intakes sit so far below it without producing the deficiency you would predict.
The band, in micrograms a day
US Dietary Reference Intakes. Full bar = the adult upper level of 100 µg (4,000 IU).
Sources: NIH Office of Dietary Supplements; USDA FoodData Central (173577).
Serum 25(OH)D and what the committees say about it
The thresholds the Institute of Medicine set, in the two units in common use.
Source: NIH Office of Dietary Supplements, after the Institute of Medicine Food and Nutrition Board, 2011.
That 20 ng/mL line is not universally accepted, and the disagreement is instructive. The Endocrine Society has declined to identify concentrations for sufficiency, insufficiency and deficiency at all, and does not recommend routine 25(OH)D testing in healthy people. That is not a smaller number or a bigger one; it is a refusal to draw the line, on the grounds that the evidence does not support drawing it.
Questions people ask
How much vitamin D is in a tablespoon?
Only cod liver oil answers that usefully: about 34 µg, or 1,360 IU, more than twice an adult’s daily requirement. Canned sockeye salmon is about 3.15 µg a tablespoon, cooked trout 2.85, cooked sockeye 2.51. Everything else is a rounding error on a spoon.
So should I take cod liver oil?
Not on these numbers alone. The same tablespoon carries about 4,080 µg of preformed vitamin A against an adult upper level of 3,000 µg a day — so one spoonful clears 227 per cent of the vitamin D requirement and 136 per cent of the vitamin A ceiling in the same swallow. That ceiling is set on birth defects, which is why it is not a product to take casually, and specifically not in pregnancy without medical advice.
Can I get enough vitamin D from food alone?
Difficult without oily fish or fortified products. Three ounces of cooked trout is 16.2 µg and clears the day alone; half a cup of UV-treated white mushrooms 9.2; a cup of fortified 2 per cent milk 2.9; two sardines in oil 1.2; one large egg 1.1. Average intake from food is about a third of the RDA, which says how rarely the oily-fish route is taken. D2 — the form in UV mushrooms and some fortified products — raises 25(OH)D less, and holds it less long, than D3.
How much sun do I need?
There is no defensible number, and its absence from official guidance is honest rather than evasive. Latitude, season, time of day, cloud, smog, pigmentation, age, clothing and sunscreen each move it substantially, and UVB does not pass through glass. Anyone quoting a fixed number of minutes is quoting it for someone else.
Is 5,000 IU a day safe?
It is above the upper level of 4,000 IU, the only threshold set formally. Frank toxicity sits far higher, but the fall data above the sufficiency range is reason not to treat the gap between 4,000 and toxic as empty. A dose prescribed after a measured deficiency is a different situation from one chosen off a shelf.
The short version
- Made in skin from UVB at 290–320 nm. Its established job is calcium absorption and bone mineralisation.
- Per tablespoon: cod liver oil 34.0 µg, canned sockeye 3.15, cooked trout 2.85. Nothing else is close, and cod flesh has 278 times less than cod liver oil.
- Average US intake from food is about a third of the RDA, yet only 5 per cent are deficient. The missing input is skin, and no food table shows it.
- Deficiency is rickets in children, osteomalacia in adults. Fortification from the 1930s made rickets rare; it is returning in places.
- Three large trials in mostly replete adults found essentially nothing. Chapuy 1992, in deficient nursing-home women also given calcium, cut hip fracture by 43 per cent. The difference is who was enrolled.
- RDA 15 µg (600 IU), 20 µg (800 IU) over 70; upper level 100 µg (4,000 IU). Falls appear U-shaped, with harm signals above roughly 60 ng/mL.
This is a reference page, not clinical guidance. Vitamin D status depends on things no article can see — where you live, your skin, your age, what you absorb — and decisions about testing or supplementing belong with a doctor.
Further reading: Dawson-Hughes’ 2024 review is the shortest honest account of why the big trials and the old ones disagree, and Chapuy’s 1992 paper is worth reading beside it for how plainly it describes the population it treated.
- The Age of Diagnosis, Suzanne O’Sullivan (2025). On overdiagnosis and medicalization — relevant to who actually benefits from testing and supplementing.
- Sickening, John Abramson (2022). On how industry-funded trials undermine clinical evidence.
- How to Read Numbers, Tom Chivers & David Chivers (2021). Common statistical traps explained through news examples.
Sources
- NIH Office of Dietary Supplements, “Vitamin D”, fact sheet for health professionals. (RDA, UL and serum bands; intake 5.1 and 4.2 µg/day, 2015–2016; NHANES 2011–2014 5% deficient and 18% inadequate, with the group and age breakdowns; breastfed infants 20.5%; UVB 290–320 nm, SPF 8, glass; toxicity above 375 nmol/L; the per-serving food figures.)
- USDA FoodData Central, SR Legacy, vitamin D (D2 + D3) per 100 g. (Cod liver oil 173577, 250 µg; sockeye canned 173693, 21.0; trout farmed cooked 173718, 19.0; sockeye cooked 173692, 16.7; sockeye raw 173691, 14.1; herring cooked 175117, 5.4; Atlantic cod raw 171955, 0.9.)
- Dawson-Hughes, B., “Effect of vitamin D on risk of falls and fractures: the contribution of recent mega-trials”, Metabolism Open, 2024, 100300. (Trial-by-trial account of VITAL, ViDA and D-Health; the U-shape; >60 ng/mL odds ratio 1.99, 1.2–3.3; D-Health BMI<25 subgroup 1.25, 1.09–1.43.)
- LeBoff, M.S. et al., NEJM 387, 2022 (VITAL: 25,871, 2,000 IU/day, 5.3 years, baseline 30.2 ng/mL; fracture HR 0.98, 0.89–1.08; hip 1.01, 0.70–1.47); Waterhouse, M. et al., D-Health, 2023 (20,326, 60,000 IU monthly, 5.1 years; HR 0.94, hip 1.11, falls OR 1.02); Khaw, K.T. et al., ViDA, Lancet Diabetes Endocrinol 5(6), 2017 (5,108, 100,000 IU monthly, baseline 25.2 ng/mL; non-vertebral HR 1.19, 0.94–1.50).
- Chapuy, M.C. et al., NEJM 327(23), 1992. (3,270 women, mean age 84.6, baseline 16 ng/mL, calcium intake 511 mg/day; 800 IU D3 plus 1.2 g calcium for 18 months; hip fracture −43%, other non-vertebral −32%.)
- Appel, L.J. et al., STURDY, Ann Intern Med 174(2), 2021, and Sanders, K.M. et al., JAMA 303(18), 2010. (1,000 IU against 200 IU, more serious falls on the higher dose; 500,000 IU yearly, falls +15% and fractures +26%.)
- Bolland, M.J., Grey, A. and Avenell, A., Lancet Diabetes Endocrinol 6(11), 2018. (Trial sequential analysis: further trials unlikely to change the null for fracture and falls.)
- Institute of Medicine, Food and Nutrition Board, Dietary Reference Intakes for Calcium and Vitamin D, 2011. (The 50 nmol/L sufficiency line, set to cover 97.5 per cent of the population.)