Heatwaves and Power Blackouts: What the Evidence Shows
Key takeaways · 12 min read
- Modelling of a two-day blackout during a heatwave more than doubled estimated heat deaths in Atlanta, Detroit and Phoenix; in Phoenix, about half the population would need emergency care.
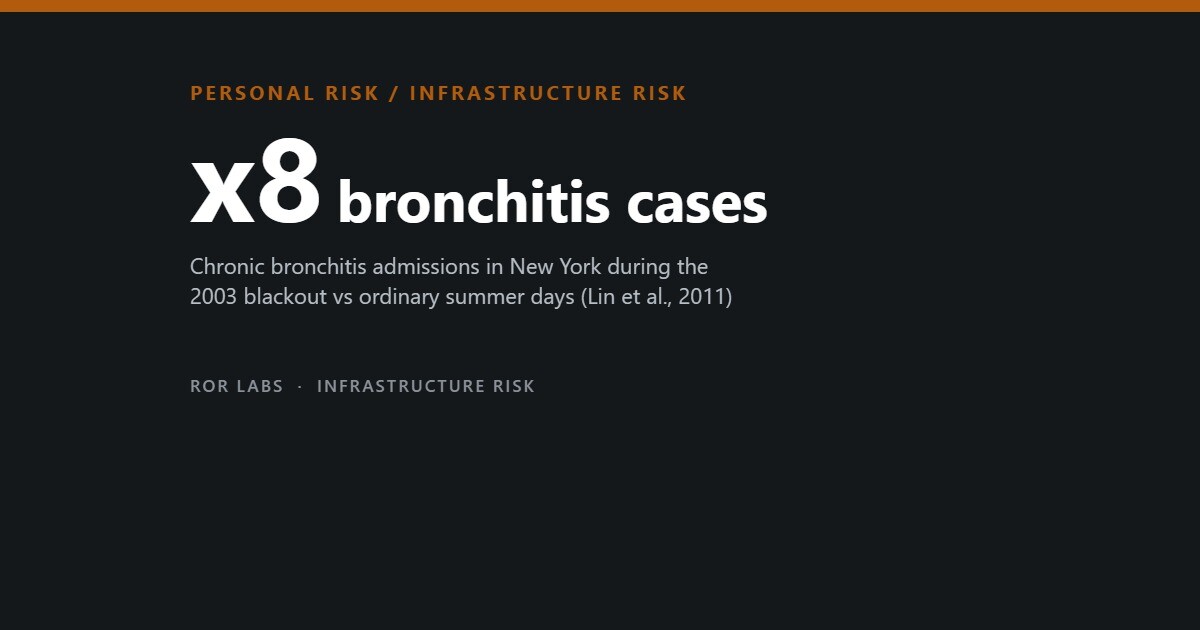
- During New York’s 2003 blackout, respiratory hospital admissions more than tripled and chronic bronchitis admissions rose eightfold compared with ordinary summer days.
- After a 2019 typhoon cut power to 93,200 households near Tokyo, ambulance trips for heat illness roughly doubled over the following days.
- In Maricopa County, Arizona, most people who died of heat indoors in 2025 had an air conditioner, but in 72% of those cases it was not working.
In hot cities, air conditioning has quietly become life-support equipment. Most people now ride out heatwaves indoors, behind a machine that needs the grid. When the power fails at the same moment, that protection disappears exactly when it matters, and homes built to be cooled mechanically can turn dangerous within hours. Researchers call this a compound event: two hazards that are far worse together than apart.
How much worse is hard to pin down. The most quoted figures, including an estimate that a blackout during a Phoenix heatwave could kill about 13,000 people, come from computer models, not from deaths counted. The observed evidence comes from a handful of real outages, often with small numbers and no clean way to separate heat from everything else a blackout does.
This article sets out both kinds of evidence: the modelling; what happened in New York in 2003, around Tokyo in 2019 and elsewhere; who died in hot homes in Arizona in 2025; and who is most exposed. The general effects of long outages, and utility disconnections for unpaid bills, are covered in separate articles on this site.
Why heat and blackouts compound
Large blackouts are becoming more common. Brian Stone of Georgia Tech and colleagues reported in 2021 that major US grid failures, those lasting at least an hour and affecting 50,000 or more customers, rose by more than 60% over the most recent five-year reporting period. Heatwaves also push demand for cooling to its peak, the moment when grids are most stretched.
Indoors, the change is fast. Building simulations of older homes in Houston and Phoenix by Amir Baniassadi and David Sailor found that indoor conditions reached a critical discomfort threshold less than six hours after the power went off. In their 2021 study, Stone’s team simulated recent heatwaves combined with grid failure for 2.8 million residents of Atlanta, Detroit and Phoenix, and found that 68% to 100% would face an elevated risk of heat exhaustion or heatstroke.
The Phoenix model
The study behind most headlines is a 2023 paper in Environmental Science & Technology by Stone, Carina Gronlund, David Hondula and colleagues. They estimated how much heat each person would experience hour by hour, indoors and out, during past heatwaves in the three cities, with and without a blackout of two days followed by three days of gradual restoration.
A blackout more than doubled the estimated rate of heat-related deaths in all three cities. The share of residents needing medical attention ranged from 3% in Atlanta to more than 50% in Phoenix. For Phoenix, that meant about 13,000 deaths and roughly 800,000 people needing emergency care, in a city with around 3,000 emergency room beds.
A modelled blackout in a Phoenix heatwave
Estimated toll of a two-day blackout plus three days of gradual restoration during a historical heatwave. Simulation, not observation.
About 13,000
Estimated heat-related deaths in Phoenix; across all three cities studied, a blackout more than doubled the estimated death rate.
Over 50%
Share of Phoenix residents who would need medical attention, roughly 800,000 people, against 3% in Atlanta.
Sources: Stone B et al., Environ Sci Technol (2023), doi:10.1021/acs.est.2c09588; city totals as reported by KJZZ (26 May 2023) and The New York Times via PreventionWeb (23 May 2023).
These are model outputs, not forecasts. They rest on assumptions about buildings, behaviour and how heat turns into illness, and nothing like this scenario has been observed in a city as hot as Phoenix, so the totals cannot be checked against reality. The same model also showed the toll is not fixed: shading half of Phoenix’s streets with trees cut estimated deaths by 27%, and highly reflective roofs by 66%.
New York, 2003
The 2003 north-east blackout is the best-studied real case. It began at 4:11 pm on 14 August and lasted about 31 hours, on days that reached 91.0°F and 89.1°F in New York City: hot, but nothing like Phoenix. Shao Lin and colleagues compared hospital admissions on the two blackout days with ordinary summer days and with days of similar heat between 1991 and 2004.
Respiratory admissions more than tripled. Admissions for chronic bronchitis rose about eightfold, and emphysema, chronic airway obstruction and asthma also rose, while equally hot days without a blackout showed no comparable increase. Cardiovascular and kidney admissions did not rise. Among chronic bronchitis cases, 52% were aged 75 or over during the blackout, against 39% on comparably hot days.
New York’s blackout and the lungs
Hospital admissions on the two blackout days compared with ordinary summer days, incidence rate ratio.
Source: Lin S et al., Public Health Rep (2011), doi:10.1177/003335491112600312. One two-day event; the blackout also stopped transport and water pumps.
Deaths rose too. Brooke Anderson and Michelle Bell estimated that accidental deaths rose by 122% and disease-related deaths by 25%, about 90 excess deaths, with risk slightly raised through the rest of August. A later city health department analysis found a similar rise. Heat was only one stress: subways stopped, water pumps in tall buildings failed, people walked long distances and home medical devices went dark.
One finding cuts against intuition. During the blackout, respiratory admissions were more likely among people in better-off areas, the reverse of the usual pattern on hot days. Lin’s team suggests these households relied more on air conditioning and electric devices such as nebulisers, so losing them hit harder. It comes from a single event and is best read as a hypothesis.
Evidence from other outages
After a storm cut power to about 3.8 million customers in the eastern US in June 2012, temperatures passed 100°F. The CDC counted 32 heat-related deaths in four states over the next two weeks. Twenty-two people died at home, 20 of them without air conditioning, and loss of power was a known factor in at least seven deaths. The median age was 65.
Japan offers a cleaner natural experiment. When Typhoon Faxai cut power to 93,200 households around Tokyo in September 2019, Lisa Yamasaki and colleagues compared affected and unaffected districts with almost identical temperatures. Ambulance transports for heat illness roughly doubled for six days. All-cause deaths rose 11% in the first three days, but an upward trend before the typhoon makes that figure fragile.
Typhoon Faxai, 2019
Change in outage-hit districts around Tokyo compared with unaffected districts, rate ratio.
Source: Yamasaki L et al., Environ Epidemiol (2024), doi:10.1097/EE9.0000000000000292. 14,912 ambulance cases and 74,064 deaths, July to September 2019, in seven prefectures.
Chiba prefecture, the worst hit, officially recognised nine disaster-related deaths, seven of them linked to the outage; the report mentions one death tied to a home oxygen device without power and one involving heat illness. The study also found that, in this event, deaths were not linked to heat at higher levels of power loss, even though ambulance trips were.
Other studies point the same way with different tools. In Victoria, Australia, Zhihu Xu and colleagues detected outages from satellite night-light data and found the heat-related risk of ambulance call-outs nearly doubled during them. A 2025 US county-level working paper by Dan Ai, Christine Crago and Jamie Mullins estimated that each hour of outage in a month raised the harm of a hot day by 3%.
A 2026 evidence review led by Xu found only ten quantitative studies of heat and power loss together, mostly from the US, Japan and Australia, with very different designs. That is the honest state of the field: consistent signals, few events and small counts.
Who dies in hot homes
Maricopa County, which includes Phoenix, investigates every suspected heat death. Its 2025 report, published in April 2026, confirmed 430 heat-related deaths, 111 of them indoors. An air conditioner was present in 94% of the indoor deaths, but in 72% of those it was not working, a category that covers broken units and units that could not be switched on, including for lack of electricity.
Indoor heat deaths in Maricopa County, 2025
Characteristics of 111 people who died of heat indoors, %.
Source: Maricopa County Department of Public Health, 2025 Heat-Related Deaths Report (April 2026). “Not working” is a share of deaths where a unit was present.
Nine in ten indoor deaths were among people aged 50 or older, nearly a quarter happened in an RV, trailer or mobile home, and almost half were discovered during a welfare check. The report does not say how many involved a power cut or a disconnection, so these are deaths from failed cooling, not from blackouts as such.
That is the point. Cooling failures already kill one household at a time, without any citywide blackout. A large grid failure would turn thousands of private failures into a shared one, at the same moment that ambulances and emergency rooms are under the most pressure.
Who is most exposed
Older people appear in every data set: the median age of the 2012 storm deaths was 65, admissions in 2003 were concentrated over 75, and most indoor deaths in Maricopa were over 50. As Lin and colleagues note, older bodies start sweating later, and age brings more chronic illness, more social isolation and sometimes poorer judgement about when to seek help.
People who rely on electrically powered medical equipment, such as oxygen concentrators or ventilators, face a second threat on top of the heat. In New York City, 7.6% of households use electric medical equipment, rising to 16% in some low-income neighbourhoods such as East Harlem, according to the city’s climate panel. A 2012 national estimate counted about 366,600 privately insured people at home who depended on such equipment.
Preparation is patchy. In a New York survey of older adults and households with someone needing help or using electric devices, only 58% said they were ready for an outage, and only 40% of equipment users were enrolled in their utility’s outage notification programme. In the 24 hours after the 2003 blackout, 22% of the hospital admissions studied were people relying on home medical devices.
Who depends on the plug
Selected measures of electricity dependence and outage readiness in the United States.
| Measure | Figure |
|---|---|
| New York City households using electric medical equipment | 7.6% (up to 16% in some neighbourhoods) |
| Privately insured people at home dependent on electric equipment, 2012 | About 366,600 (218 per 100,000) |
| Older or device-dependent New York households ready for an outage | 58% |
| Equipment users enrolled in utility outage notification | 40% |
| Admissions in 24 hours after the 2003 blackout who used home devices | 22% |
Sources: Yoon L et al. (NPCC4), Ann N Y Acad Sci (2024), doi:10.1111/nyas.15117; Molinari NA et al., J Public Health Manag Pract (2017), doi:10.1097/PHH.0000000000000345; 2003 figure as cited by Bean R et al., PLoS One (2020), doi:10.1371/journal.pone.0235068. The 2012 count excludes Medicare; HHS emPOWER says millions of Medicare beneficiaries rely on such equipment.
Housing matters as much as health. Mobile homes accounted for nearly a quarter of Maricopa’s indoor deaths, and simulations find older buildings overheat fastest. Renters often cannot add shading, insulation or backup power on their own. In New York, 311 calls about outages cluster in low-income neighbourhoods with high energy burdens, the same areas that rank highest for heat-related deaths.
Recent warnings
In early July 2026, as a heatwave pushed the largest US grid operator, PJM, towards record demand, the US Department of Energy issued two emergency orders allowing it to run extra power units and backup generation. More than 100,000 customers were without power nationwide at the peak of that week, according to AccuWeather.
Some utilities now cut power on purpose. In October 2026, San Diego Gas & Electric began shutting off nearly 35,000 customers to reduce wildfire risk during an extreme heat warning, and opened centres with air conditioning, water and charging. Fire risk is being traded against heat risk for people at home, exactly the compound this article describes, and there is almost no data on how that trade plays out.
What the evidence suggests
A blackout during a heatwave is plausibly the deadliest everyday climate hazard for cities that depend on air conditioning, but the largest numbers are modelled. Real events, in New York, the eastern US and Japan, consistently show more respiratory admissions, more heat-illness ambulance trips and some excess deaths, especially among older people and those on home medical equipment. The counts are small, each event is different, and no study has yet observed the extreme scenario.
What to do
Steps sorted by when they matter. Each one says how strong the evidence is: Measured Official advice Untested
Before
- If anyone at home uses electric medical equipment, enrol in your utility’s outage notification programme. Only 40% of equipment users in a New York survey had. Measured see Sources
- Plan for an outage during a heatwave, especially for older people. Only 58% of older or device-dependent households said they were ready. Measured see Sources
- Check that the air conditioner actually works before the hot season. In 72% of indoor heat deaths where a unit was present, it was not working. Measured see Sources
If it happens
- Check on older neighbours and relatives when the power goes out in the heat. Older people appear in every data set. Measured see Sources
Questions people ask
How fast does a home get dangerous without air conditioning?
Simulations of older homes in Houston and Phoenix reached a critical indoor heat threshold in under six hours. Better-insulated, shaded homes hold out longer.
Did people die in the 2003 blackout?
One analysis estimated about 90 excess deaths in New York City, with both accidental and disease-related deaths up, on days around 90°F.
Would a Phoenix blackout really kill 13,000 people?
That is a model estimate for one severe scenario, not a prediction. It shows the possible scale, not how likely it is.
Who is most at risk?
Older people, people living alone, those using electric medical equipment, and people in mobile homes or buildings that overheat quickly.
What can people on medical equipment do?
Ask the utility about medical or outage notification programmes, and agree a backup plan for power and a cool place to go with a doctor or equipment supplier.
The short version
- Modelling of a two-day blackout during a heatwave more than doubled estimated heat deaths in Atlanta, Detroit and Phoenix; in Phoenix, about half the population would need emergency care.
- During New York’s 2003 blackout, respiratory hospital admissions more than tripled and chronic bronchitis admissions rose eightfold compared with ordinary summer days.
- After a 2019 typhoon cut power to 93,200 households near Tokyo, ambulance trips for heat illness roughly doubled over the following days.
- In Maricopa County, Arizona, most people who died of heat indoors in 2025 had an air conditioner, but in 72% of those cases it was not working.
- Older adults and people on electric medical equipment are most exposed, and the observed evidence rests on few events and small numbers.
This article summarises research and official data for general information. It is not medical or emergency advice. If you or someone you care for depends on powered medical equipment or is vulnerable to heat, talk to a doctor about a plan for outages. In a heat emergency, call your local emergency number.
Further reading: Stone et al., Environmental Science & Technology (2023), for the three-city modelling. Lin et al., Public Health Reports (2011), for the 2003 New York blackout. Yamasaki et al., Environmental Epidemiology (2024), for the Tokyo natural experiment.
- The Heat Will Kill You First, Jeff Goodell (2023). A journalist travels widely to show how extreme heat kills and whom it reaches first. Vivid and readable; it is reportage, not a systematic review.
- Shorting the Grid, Meredith Angwin (2020). An energy-industry veteran explains how US grid rules and fuel choices affect reliability. Clear on why blackouts happen; written from a definite point of view on energy policy.
- The Ministry for the Future, Kim Stanley Robinson (2020). A novel that opens with a deadly heatwave in India. Fiction, but a hard-to-forget picture of what heat can do when protection fails.
Sources
- Stone B, Gronlund CJ, Mallen ES, Hondula DM, O’Neill MS, Rajput M et al. Environ Sci Technol (2023), doi:10.1021/acs.est.2c09588.
- Stone B, Mallen ES, Rajput M, Gronlund CJ, Broadbent AM, Krayenhoff ES et al. Environ Sci Technol (2021), doi:10.1021/acs.est.1c00024.
- Baniassadi A, Sailor DJ. Building and Environment (2018).
- Lin S, Fletcher BA, Luo M, Chinery R, Hwang SA. Public Health Rep (2011), doi:10.1177/003335491112600312.
- Anderson GB, Bell ML. Epidemiology 23(2) (2012), doi:10.1097/EDE.0b013e318245c61c.
- Dominianni C, Lane K, Johnson S, Ito K, Matte T. Environ Health Perspect (2018), doi:10.1289/EHP2154.
- Yamasaki L, Kamada T, Ng CFS et al. Environ Epidemiol (2024), doi:10.1097/EE9.0000000000000292.
- Xu Z, Xu R, Chen G et al. Environ Res (2025), doi:10.1016/j.envres.2025.122396.
- Xu Z, Xu R, Chen G, Bi P, Bambrick H, Tong M. Concurrent extreme heat and power outages: evidence review (2026).
- Ai D, Crago CL, Mullins JT. Heat, power outages and mortality in the United States, working paper (AgEcon Search, 2025).
- Yoon L, Ventrella J, Marcotullio PJ et al. NPCC4. Ann N Y Acad Sci (2024), doi:10.1111/nyas.15117.
- Marcotullio PJ et al. Sustain Cities Soc (2023), doi:10.1016/j.scs.2023.104932.
- Molinari NA, Chen B, Krishna N, Morris T. J Public Health Manag Pract (2017), doi:10.1097/PHH.0000000000000345.
- Bean R, Snow S, Glencross M, Viller S, Horrocks N. PLoS One (2020), doi:10.1371/journal.pone.0235068.
- CDC. Heat-related deaths after an extreme heat event, four states, 2012. MMWR 62(22):433 (2013).
- Maricopa County Department of Public Health. 2025 Heat-Related Deaths Report (April 2026).
- HHS emPOWER Program.
- KJZZ (26 May 2023); The New York Times via PreventionWeb (23 May 2023).
- AccuWeather (1 July 2026).
- Times of San Diego (2 October 2026).