Options and Futures: Where Retail Money Actually Goes
In This Series: Personal Finance & Investing
- Why Most Stock Investors Lose Money: What the Evidence Actually Shows
- Two Retirees, the Same Returns, Only One Runs Out. The Difference Is the Order.
- Deposit Insurance Stops at $250,000. Since 2008, Uninsured Depositors Have Actually Lost Money in Six Per Cent of Failures.
- Courts Resolve More Than Seventy Per Cent of Debt Suits Without a Defence. Fewer Than One Defendant in Ten Has a Lawyer.
- Your Home Insurance Almost Certainly Does Not Cover Flooding
- The Median Forfeiture Is $1,678. A Lawyer to Contest It Costs About Twice That.
Key takeaways · 16 min read
- European regulators found 74–89% of retail CFD accounts losing money, with average losses of €1,600 to €29,000, and responded with leverage caps, a 50% margin close-out rule and compulsory negative balance protection.
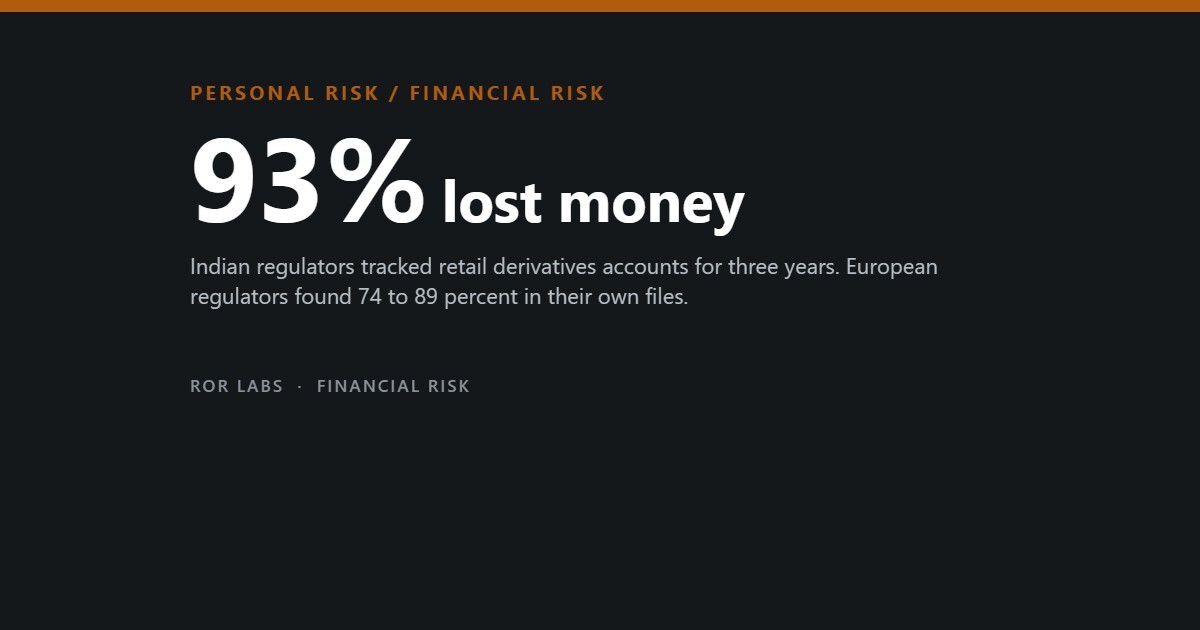
- India’s regulator, holding the complete market record, found 93% of individual equity derivatives traders losing money over FY22–FY24 and over 91% in FY25, with net losses of ₹105,603 crore in that year alone, up 41%.
- At 30:1 leverage, a 3.3% adverse move erases the margin — and the close-out rule acts at roughly half that. Leverage does not make you more right; it shortens how long you are allowed to be early.
- About three quarters of retail S&P 500 option trades are same-day contracts, where time decay is steepest and the position is close to a pure short-horizon direction bet.
A stock can go to zero. That is the worst case, and it takes time to get there. A leveraged derivative position can reach its worst case in an afternoon, and the worst case is not always zero — without a specific protection in place it can be a debt. That difference is the whole subject.
The usual description of futures and options is that they are “riskier”, which is imprecise enough to be useless. A protective put reduces risk. A covered call reduces risk. What the loss statistics below describe is something narrower and much more common: retail traders buying short-dated directional exposure with leverage, in size, repeatedly.
Unusually for this subject, we are not working from surveys or from broker marketing. Financial regulators in three jurisdictions have published loss figures drawn from the complete records of the firms they supervise, and several academic teams have obtained trade-level data. This article sets out what those records show, including a study that finds the losses smaller than the headlines claim. None of it is advice about what anyone should trade.

What the regulators found in their own files
In March 2018 the European Securities and Markets Authority announced restrictions on contracts for difference sold to retail clients, and the justification was a plain statement of what firms were reporting: 74% to 89% of retail accounts typically lose money, with average losses per client ranging from €1,600 to €29,000. ESMA had that range because CFD providers across the European Union were required to report it.
The measures ESMA imposed are the more informative part, because each one is a regulator naming a specific mechanism of loss. Leverage was capped by asset class. A margin close-out rule was standardised at 50% of required margin, so that positions are shut before the account is exhausted. And negative balance protection was made compulsory — which tells you that before 2018, retail clients in Europe were ending up owing their brokers money.
ESMA retail leverage caps, in force since 2018
Maximum leverage on contracts for difference sold to retail clients in the European Union, and the adverse price move that wipes out the margin behind a position.
| Underlying | Leverage cap | Move that erases 100% of margin |
|---|---|---|
| Major currency pairs | 30:1 | 3.3% |
| Non-major FX, gold, major indices | 20:1 | 5.0% |
| Commodities other than gold | 10:1 | 10.0% |
| Individual equities | 5:1 | 20.0% |
| Cryptocurrencies | 2:1 | 50.0% |
Source: European Securities and Markets Authority, product intervention measures on CFDs and binary options, announced 27 March 2018.
It is worth being clear about what that table is and is not. The caps are a European retail rule; futures traded on a US exchange are margined differently and are not covered by them. But the arithmetic in the third column is universal. Leverage does not change the probability that you are right. It changes how much of the market’s ordinary noise your position can absorb before someone else closes it for you.
India ran the experiment at national scale
The largest and cleanest dataset on this belongs to the Securities and Exchange Board of India, which has the complete equity derivatives record for its market and has published two studies from it.
The first, released in September 2024, found that 93% of individual traders in equity futures and options lost money between financial years 2022 and 2024, with aggregate losses exceeding ₹1.8 lakh crore — about 1.8 trillion rupees over three years.
The follow-up covering financial year 2025 found net losses of individual traders at ₹105,603 crore, up 41% from ₹74,812 crore the previous year, with over 91% of traders losing money. The number of unique individual traders in the segment fell from 6.14 million in the first quarter of that year to 4.27 million in the fourth — a roughly 20% contraction following SEBI’s intervention in the market.
Net losses of individual traders in Indian equity derivatives
SEBI studies covering the top brokers by client base. Figures in crore rupees.
Sources: SEBI press release, 23 September 2024; SEBI study on individual trader performance in the equity derivatives segment, July 2025.
Two things make this dataset unusually persuasive. It is not a sample — it is the market. And the loss share stayed above nine in ten across two separate studies, different years, and a regulatory intervention designed specifically to reduce the harm. The composition of who was trading changed. The proportion losing did not move much.
The three mechanisms
Knowing that most retail derivative traders lose is less useful than knowing why. The published work points at three separate mechanisms, and they compound rather than overlap.
1. Leverage shortens the time you are allowed to be right
This is the one people think they understand and generally do not. Leverage is usually explained as amplifying gains and losses symmetrically, which is true of the arithmetic and false of the experience. The asymmetry comes from the margin close-out. A position financed at 20:1 does not simply lose twenty times as fast; it gets closed by the broker after a move of two or three percent, at which point being right the following week is worth nothing to you.
Put differently: an unleveraged holder who is wrong for six months and right in the seventh gets paid. A leveraged holder in the same trade is gone in week one. The leverage did not change the quality of the analysis. It removed the ability to be early, and being early is indistinguishable from being wrong until it is not.
2. Time decay is a bill you pay every day

An option is a wasting asset. Holding one costs money in the absence of any market movement at all, which is a position no stockholder is ever in. And retail options activity has shifted decisively towards the shortest-dated contracts, where that decay is steepest.
Beckmeyer, Branger and Gayda, studying retail participation in S&P 500 options, found that around three quarters of retail S&P 500 option trades involve contracts expiring the same day — the instruments known as 0DTE. A same-day option has almost no time value left to lose, which is sometimes presented as an advantage. What it actually means is that the contract has become a nearly pure bet on the direction of the index over a few hours, at odds set by professional market makers.
3. The spread, paid on the way in and again on the way out
Option bid-ask spreads run considerably wider than stock spreads, typically 5% to 10% of the option price. A round trip pays it twice. On a position held for under an hour — the median retail option holding period in one dataset is about half an hour — the spread is not a rounding error against the expected move. It is frequently larger than it.
Three costs that apply before the market moves at all
None of these depends on being wrong about direction.
Sources: ESMA product intervention, 2018; Beckmeyer, Branger and Gayda, “Retail Traders Love 0DTE Options… But Should They?”, working paper; Bogousslavsky and Muravyev, “An Anatomy of Retail Option Trading”.
There is a fourth mechanism that is about attention rather than mechanics, and it is well documented. De Silva, Smith and So examined retail option purchases around corporate earnings announcements between 2010 and 2021 and found that buying clusters ahead of announcements with high expected volatility — the ones getting the most media coverage, roughly 22% more articles. Retail buyers arrived systematically bullish and overpaid relative to the volatility that actually materialised. Straddles bought into those events underperformed by about 11% on announcement day and a further 9% over the following ten days. Aggregate losses over the sample came to roughly $3 billion, with average losses of 5–9% per trade and 10–14% around the high-attention events.
Notably, the authors reject the simple “retail traders like lottery tickets” explanation. The buying concentrated in at-the-money contracts rather than far out-of-the-money ones, which is not lottery behaviour. It is people responding to news coverage of an upcoming event with the instrument that gives them the most exposure to it.
The study that argues the losses are overstated
An article that only quoted the alarming numbers would be doing the same thing as the trading courses, in the opposite direction. So here is the best counter-evidence, and it is good.
Vincent Bogousslavsky and Dmitriy Muravyev obtained trader-level records rather than the aggregate proxies most studies rely on: 5,182 traders, 2.4 million parent trades and about $15 billion of stock and option trading between 2020 and 2022. Their headline finding is that the average option trade earned −0.9% — small against option bid-ask spreads of 5–10%, and roughly comparable to trading fees.
Their explanation is mechanical and convincing. Earlier estimates of 3–9% losses per trade come from aggregate data that can only see market orders crossing the spread. Retail traders, it turns out, use limit orders a great deal and therefore do not pay the full spread. The authors write plainly that concerns about large retail option losses may be overstated. They also found one profitable exception: naked option sales earned about 20% on average.
Two estimates of the average retail option trade
Same market, different data sources.
Sources: Bogousslavsky, V. and Muravyev, D., “An Anatomy of Retail Option Trading”; de Silva, T., Smith, K. and So, E.C., “Losing is Optional: Retail Option Trading and Expected Announcement Volatility”.
Take that seriously and it changes the picture in one specific way: an individual retail option trade is not a rip-off. It is a slightly negative-expectation transaction, on the order of the fees. The catastrophic outcomes in the SEBI and ESMA data therefore do not come from any single trade being terrible. They come from three things the per-trade average cannot see — how many times the trade is repeated, how much leverage sits behind it, and what the distribution looks like in its tail.
That last point applies with particular force to the profitable exception. A naked option sale wins a small premium most of the time and loses an unbounded amount rarely. An average return of 20% across a sample is entirely compatible with a strategy that ends some accounts. An average is a poor summary of a distribution with that shape, which is exactly why regulators mandated negative balance protection rather than publishing an average.
What the tail looks like when it arrives

On 10 October 2025, roughly $19 billion of crypto leverage was liquidated in about a day — the largest single-day liquidation in the market’s history. The trigger was external and had nothing to do with crypto: a threat of 100% tariffs on China that hit risk assets everywhere.
The mechanics are what matter, because they generalise to any leveraged market. Perpetual futures open interest was elevated and funding rates had climbed from around 10% to nearly 30% annualised, meaning a great many traders were paying to stay long. Unified margin systems, efficient in calm conditions, tied whole portfolios to their weakest holding. As positions were force-closed, automatic deleveraging turned an ordinary sell-off into a spiral. Top-of-book depth in bitcoin fell by more than 90% on major venues that day, and spreads widened from single-digit basis points to double-digit percentages.
10 October 2025: how a liquidation cascade works
The sequence, in the order it happened.
Source: FTI Consulting, “Crypto Crash October 2025: Leverage Met Liquidity”, 2025.
This is the shape of every leveraged wipe-out, from the 1998 collapse of Long-Term Capital Management to a retail account closed on a Friday afternoon. The position is not sized against the market’s worst day. It is sized against the market’s ordinary days, and then an ordinary day fails to arrive.
Doing it for a living
The most direct evidence on trading derivatives as an occupation comes from Brazil, and it is a futures market. Chague, De-Losso and Giovannetti followed every individual who began day trading Brazilian equity index futures between 2013 and 2015 — the third-largest such market in the world by volume.
Among those who persisted for more than 300 trading days, 97% lost money. 1.1% earned more than the Brazilian minimum wage. 0.5% earned more than the starting salary of a bank teller, and the authors add that even those did so with great risk. Their stated conclusion is that it is virtually impossible for individuals to day trade for a living, contrary to what course providers claim.
The 300-day filter is the important design choice. It removes the people who tried it for a month and stopped, which is the objection normally raised against these studies. What is left is the group that committed — that learned, adapted and kept going. Persistence made the numbers worse, not better.
Questions people ask
Are options always riskier than stocks?
No, and this is the most common confusion in the subject. A protective put placed against shares you already own reduces the loss you can take. A covered call reduces volatility in exchange for capping the upside. Both are options positions and both lower risk. Every loss figure above concerns something else: buying short-dated directional exposure, or selling risk without the underlying to cover it. The instrument is not the risk. The position is.
If I only buy options, my loss is capped at the premium. Is that not safe?
The cap is real and it is worth having. It is also the wrong unit of measurement. Losing 100% of a small premium is survivable once and unremarkable ten times; it is the annual total that ends accounts, not any single expiry. This is precisely why the trader-level evidence showing a modest −0.9% average per trade and the national evidence showing nine in ten traders losing are both true at the same time.
What about selling options for premium income?
The one profitable category in the trader-level data was naked option sales, at about 20% on average. Read the shape of that payoff before reading the average: many small gains, rare very large losses, and no upper bound on the loss for a naked call. Regulators require negative balance protection on European retail leveraged products for reasons that have to do with this payoff, not with buyers of options.
Do funded-account or proprietary-trading programmes change the odds?
They change who bears the loss, not the distribution of trading outcomes. The evaluation fee is paid regardless. No study cited here measures those programmes specifically, so this is a limitation of the evidence rather than a finding about them — but nothing in the trading data suggests the underlying difficulty is different.
Is hedging in the same category?
No. A farmer selling a futures contract against a crop already in the ground, or an exporter fixing a currency rate against an invoice already issued, is reducing an exposure that exists whether or not they trade. That is what these markets were built for and the loss statistics above do not describe it. The distinguishing question is whether the derivative offsets a position you already hold or creates one you did not.
Is this the same argument as the one about stock picking?
It is the same arithmetic, running faster. The evidence on individual stock investors shows costs and skew eroding returns over years. Leverage and expiry compress the same process into days. The Brazilian futures data and the Taiwanese stock data were produced by overlapping research groups for that reason.
The short version
- European regulators found 74–89% of retail CFD accounts losing money, with average losses of €1,600 to €29,000, and responded with leverage caps, a 50% margin close-out rule and compulsory negative balance protection.
- India’s regulator, holding the complete market record, found 93% of individual equity derivatives traders losing money over FY22–FY24 and over 91% in FY25, with net losses of ₹105,603 crore in that year alone, up 41%.
- At 30:1 leverage, a 3.3% adverse move erases the margin — and the close-out rule acts at roughly half that. Leverage does not make you more right; it shortens how long you are allowed to be early.
- About three quarters of retail S&P 500 option trades are same-day contracts, where time decay is steepest and the position is close to a pure short-horizon direction bet.
- Retail option buying clusters before heavily covered earnings announcements. Straddles bought into those events underperformed by 11% on the day and 9% over the next ten, roughly $3 billion in aggregate, 2010–2021.
- The strongest counter-evidence: on actual trader-level records the average option trade returned −0.9% — about the cost of fees. Single trades are not a rip-off. Repetition, leverage and the tail are what produce the national loss figures.
- On 10 October 2025, $19 billion of crypto leverage was liquidated in a day. Order-book depth fell over 90% and spreads went from basis points to double-digit percentages. Forced exits happen at the price that exists, not the price on your screen.
- Of Brazilians who day-traded index futures for more than 300 days, 97% lost money and 1.1% cleared the minimum wage. Persistence made the outcome worse, not better.
- Hedging an exposure you already hold is a different activity from the one all of these numbers describe.
This article summarises published regulatory data and academic research on retail derivatives trading. It is general information and not investment advice. Nothing here is a recommendation to trade, or not to trade, any instrument, and it cannot account for anyone’s circumstances, capital, tax position or obligations. Leveraged products can produce losses exceeding the amount deposited where negative balance protection does not apply. Anyone considering these markets should read the risk disclosures their broker is legally required to provide and speak to a licensed adviser in their own jurisdiction.
Further reading: Chaos Kings — Scott Patterson (Scribner, 2023). On Taleb’s own proteges and the tail-risk trading strategies built on his ideas — an independent journalistic account rather than Taleb’s own argument, and narrower: it follows a small clique of traders who profit from crashes rather than randomness-perception broadly. Find it on Amazon (paid link)
On the links above: some are affiliate links, marked (paid link). If you buy through one we may earn a commission at no additional cost to you. As an Amazon Associate I earn from qualifying purchases. We link to product searches rather than specific items so that recommendations do not break as models change, and we say plainly when we are choosing not to link something. Full policy: Affiliate Disclosure.
Sources
- European Securities and Markets Authority, product intervention measures on contracts for difference and binary options offered to retail investors, announced 27 March 2018. (74–89% of retail accounts typically losing money; average losses per client of €1,600 to €29,000; leverage caps of 30:1 for major currency pairs, 20:1 for non-major FX, gold and major indices, 10:1 for other commodities and non-major equity indices, 5:1 for individual equities, 2:1 for cryptocurrencies; margin close-out at 50% of minimum required margin per account; compulsory negative balance protection per account; prohibition on the marketing, distribution and sale of binary options to retail investors.)
- Securities and Exchange Board of India, press release PR 37/2024, 23 September 2024. (93% of individual traders incurring losses in equity futures and options between FY22 and FY24; aggregate losses exceeding ₹1.8 lakh crore over three years.)
- Securities and Exchange Board of India, study on individual trader performance in the equity derivatives segment, July 2025, covering the top 13 stock brokers with a combined base of about 96 lakh unique traders. (Net losses of individual traders of ₹105,603 crore in FY25 against ₹74,812 crore in FY24, a 41% increase; over 91% of traders making losses; unique individual traders in the segment falling from 61.4 lakh in Q1 FY25 to 42.7 lakh in Q4.)
- Beckmeyer, H., Branger, N. and Gayda, L., “Retail Traders Love 0DTE Options… But Should They?”, working paper (SSRN 4404704). (Approximately three quarters of retail S&P 500 option trades involving same-day-expiry contracts; substantial retail losses despite favourable effective spreads through price improvement.)
- de Silva, T., Smith, K. and So, E.C., “Losing is Optional: Retail Option Trading and Expected Announcement Volatility”. (Sample January 2010 to February 2021; aggregate retail option losses of approximately $3 billion; average losses of 5–9% per trade overall and 10–14% around high expected-announcement-volatility events; straddles underperforming by about 11% on announcement day and a further 9% over the following ten days; high-attention announcements receiving about 22% more media articles; retail concentration in at-the-money rather than out-of-the-money contracts, which the authors read as evidence against a lottery-preference explanation.)
- Bogousslavsky, V. and Muravyev, D., “An Anatomy of Retail Option Trading”. (5,182 traders, 2.4 million parent trades and about $15 billion of stock and option trading, 2020–2022; average option trade return of −0.9%, against typical option bid-ask spreads of 5–10%; naked option sales earning about 20% on average; median option holding period of about half an hour; the authors stating that concerns about large retail losses in options may be overstated and attributing higher prior estimates of 3–9% per trade to proxy data that observes only spread-crossing market orders.)
- Chague, F., De-Losso, R. and Giovannetti, B., “Day Trading for a Living?”, working paper, 2019 (SSRN 3423101). (All individuals beginning day trading in Brazilian equity index futures between 2013 and 2015; 97% of those persisting beyond 300 days losing money; 1.1% earning more than the Brazilian minimum wage; 0.5% earning more than a bank teller’s starting salary.)
- FTI Consulting, “Crypto Crash October 2025: Leverage Met Liquidity”. (About $19 billion of crypto leverage liquidated in roughly one day on 10 October 2025; trigger a 100% China tariff threat; perpetual futures funding rates rising from around 10% to nearly 30% annualised; unified margin systems tying portfolios to their weakest assets; automatic deleveraging producing a liquidation spiral; bitcoin top-of-book depth falling by more than 90% on key venues with spreads widening from single-digit basis points to double-digit percentages.)