Two Retirees, the Same Returns, Only One Runs Out. The Difference Is the Order.
In This Series: Personal Finance & Investing
- Why Most Stock Investors Lose Money: What the Evidence Actually Shows
- Options and Futures: Where Retail Money Actually Goes
- Deposit Insurance Stops at $250,000. Since 2008, Uninsured Depositors Have Actually Lost Money in Six Per Cent of Failures.
- Courts Resolve More Than Seventy Per Cent of Debt Suits Without a Defence. Fewer Than One Defendant in Ten Has a Lawyer.
- Your Home Insurance Almost Certainly Does Not Cover Flooding
- The Median Forfeiture Is $1,678. A Lawyer to Contest It Costs About Twice That.
Further reading: Retirement Planning Guidebook — Wade Pfau, 2nd edition (Retirement Researcher Media, 2023). The most thorough consumer-facing treatment of withdrawal decisions we know of. Dense, US-centric, and not a substitute for a regulated adviser. Find it on Amazon (paid link)
Disclosure: this article contains affiliate links, marked (paid link). If you buy through one we may earn a commission, at no extra cost to you. As an Amazon Associate I earn from qualifying purchases. It costs you nothing and it does not change what we recommend.
Key takeaways · 12 min read
- While saving, only the average return matters. While withdrawing, the order matters enormously.
- Withdrawing from a fallen portfolio sells more units, and those units are not there to recover.
- The critical window is roughly the first five to ten years after you stop earning.
- The 4% rule came from Bengen (1994): the worst historical 30-year U.S. window. Not a guarantee, not universal, not forever.
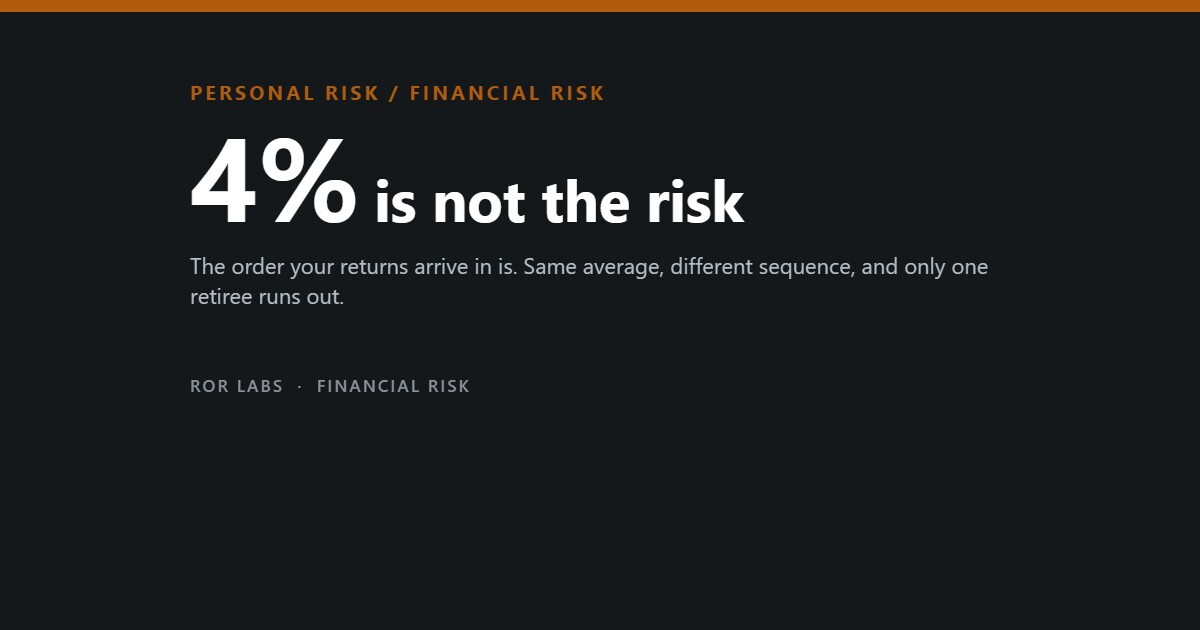
Here is a fact about retirement arithmetic that almost nobody is taught, and that quietly decides how a large number of retirements turn out. While you are saving, the order in which returns arrive does not matter — only the average does. The moment you start withdrawing, the order matters enormously, and the average stops being a useful description of your outcome.
Two people can retire on the same day with the same amount of money, hold the same portfolio, experience the exact same set of annual returns, and end up in completely different places — because one of them got the bad years first. This is called sequence-of-returns risk, and it is the reason a single “safe withdrawal rate” exists as a concept at all.
This article explains the mechanism, where the famous 4% figure came from and what it does not claim, what current research puts the number at, and the second risk that is easier to ignore because it feels morbid. None of it is advice about your own money — I am not a financial adviser and this is not a recommendation — but the arithmetic below is the arithmetic anyone advising you is working with.

Why the order matters
The mechanism is not sophisticated, which is what makes it easy to miss. When you withdraw a fixed amount from a portfolio that has just fallen, you are selling more units to raise the same cash. Those units are then not there to recover. A poor year early in retirement therefore does permanent damage in a way that the identical poor year fifteen years later does not.
The same returns, in a different order
An illustration of the mechanism, not a projection. Both retirees experience an identical set of annual returns and an identical average; only the sequence differs.
Mechanism as described in the retirement income literature; see Bengen (1994) and Morningstar retirement income research.
Where 4% came from, and what it never claimed

In October 1994 a financial planner named William Bengen published a paper in the Journal of Financial Planning asking a narrow question: across every historical thirty-year window in U.S. market data, what is the highest initial withdrawal rate that would never have run out of money? His answer, roughly 4% of the starting balance, adjusted each year for inflation, became the most quoted number in personal finance. The Trinity study a few years later reached broadly similar conclusions by a different route.
What that research does not say is worth listing, because the number gets used as though it were a law of nature.
What the 4% rule is not
Four things the original research explicitly did not establish.
Sources: Bengen, W.P., “Determining Withdrawal Rates Using Historical Data,” Journal of Financial Planning, October 1994; Cooley, Hubbard & Walz (Trinity study), 1998.
Morningstar now recalculates the figure annually using forward-looking return assumptions rather than history, on the same basic conditions: a 30-year horizon, steady inflation-adjusted spending, and a 90% probability of the money lasting. Their number moves with market conditions, which is itself the most useful thing about it.
The number is not fixed
Morningstar starting safe withdrawal rate, 30-year horizon, 90% success probability, steady inflation-adjusted spending.
Source: Morningstar, The State of Retirement Income research and annual safe withdrawal rate updates.
The risk people plan away from
Sequence risk is about the order of returns. The second risk is about the length of the window, and it is systematically underestimated for a reason that is more psychological than financial: nobody enjoys planning for the version of themselves that is still here at 95.
Planning to the average is a coin flip
U.S. Social Security Administration actuarial data, from age 65.
Source: Social Security Administration actuarial life tables, as reported in retirement planning analyses.
The two risks interact in an unpleasant way. A long retirement means more chances to encounter a bad sequence, and a bad sequence early means less money to stretch across the long retirement. Most of what the research recommends is aimed at that interaction rather than at either risk alone.
What the research says reduces it
The levers, and what each one is doing
These are descriptions of what the literature examines, not recommendations for your situation.
| Lever | What it addresses |
|---|---|
| Flexible spending | The rigid inflation-adjusted withdrawal is the assumption that makes fixed-rate research conservative. Research consistently finds that cutting spending modestly after a bad year supports a higher starting rate. It is also what people naturally do. |
| A cash or short-bond buffer | Holding one to three years of spending outside equities means the first bad years can be funded without selling depressed assets. This attacks sequence risk directly, at the cost of expected return. |
| Guaranteed income floor | State pension, workplace pension or an annuity covering essential spending converts a portfolio problem into a smaller one. It also transfers longevity risk to an institution, which is what those products exist to do. |
| Delaying the state pension where possible | In systems that pay more for claiming later, deferral buys inflation-linked income for life. It is one of the few longevity hedges available without buying a product. |
| Asset allocation in the middle | Morningstar finds the highest safe withdrawal rates around 30–50% equities. Too little growth fails against inflation; too much fails against sequence risk. |
| Working a little longer | It shortens the withdrawal window, lengthens the saving window, and shrinks the exposure to the critical first years all at once. It is the single most powerful lever and the least popular. |
Sources: Morningstar retirement income research; Bengen (1994); standard retirement income literature.
What actually helps, in order
Ranked by how much uncertainty each one removes
All of it is free. This is not a shopping category.
Sources: Morningstar retirement income research; Bengen (1994); Social Security Administration actuarial data.
There is essentially nothing to buy here (paid link)
Which is worth saying out loud in a subject with this much money in it.
Browse on Amazon →
What we are deliberately not linking, and this is most of the category. Free retirement seminars, workshops and “educational” dinners. They are lead generation for a product, the product is usually a high-commission one, and the format exists because it works on people who are anxious and polite. Newsletters and courses promising a specific income figure. Anyone who can reliably deliver a number does not need your subscription. Annuity comparison sites paid per lead. Annuities are a legitimate and sometimes very sensible instrument — they are the one product that genuinely transfers longevity risk — but the referral layer between you and them is not neutral, and the right route is a regulated adviser paid by you, not by the provider. We also do not link portfolio trackers or investment apps, because nothing in the research above says the problem is a lack of dashboards.

Questions people ask
Is the 4% rule dead?
It was never alive in the way the phrase implies. It is a research finding about historical worst cases under a specific set of assumptions, and it remains a reasonable starting reference point. What has changed is that the number now gets recalculated against current conditions rather than treated as a constant — Morningstar has it at 3.9% for 2026, up from 3.7% for 2025 — and that the research increasingly emphasises flexible spending over any fixed rate.
Should I go to cash before I retire, to avoid the bad sequence?
This is exactly the question to take to a regulated adviser rather than an article, and the general finding is worth knowing: portfolios at the conservative extreme did not produce the highest safe withdrawal rates in Morningstar’s work — the middle did. Going fully defensive trades sequence risk for inflation risk over a thirty-year window, and inflation risk is the one that compounds quietly.
Does any of this apply outside the United States?
The mechanism does — sequence risk is arithmetic and does not care about jurisdiction. The numbers largely do not. Safe withdrawal research is dominated by U.S. market history, which was unusually favourable over the studied period; work using broader international data generally produces lower sustainable rates. Pension systems, tax treatment and annuity markets differ enormously, and those differences often matter more than the withdrawal rate itself.
What if I am planning to run a business in retirement rather than draw down?
Then you are converting a portfolio problem into an income problem, which changes the shape of the risk rather than removing it. Earned income during the critical early years is one of the most effective defences against a bad sequence, because it reduces or removes withdrawals in exactly the window where withdrawals do the most damage. The offsetting risk is that the income is not guaranteed and may itself be correlated with the economy that produced the bad returns.
How much does one bad year really matter?
It depends almost entirely on when it happens. In the accumulation phase, a bad year is unpleasant and largely irrelevant to the final outcome — you are buying at lower prices. In the first years of drawdown it is the most consequential event in the plan. That asymmetry is the whole subject, and it is why the transition from saving to spending deserves more thought than the decades on either side of it.
The short version
- While saving, only the average return matters. While withdrawing, the order matters enormously.
- Withdrawing from a fallen portfolio sells more units, and those units are not there to recover.
- The critical window is roughly the first five to ten years after you stop earning.
- The 4% rule came from Bengen (1994): the worst historical 30-year U.S. window. Not a guarantee, not universal, not forever.
- Morningstar now puts the starting safe rate at 3.9% for 2026, up from 3.7% for 2025.
- The highest safe rates came from portfolios around 30–50% equities — not the extremes.
- At 65, a man averages 17.5 more years and a woman 20.1 — and about 1 in 4 live past 90.
- Planning to the average is a coin flip. For a couple, plan for the survivor.
- Flexible spending is the most studied mitigation, and it is what people do naturally anyway.
- Almost nothing in this subject is solved by a purchase. Most of the industry selling into it disagrees.
This is not financial advice. I am not a financial adviser and nothing here is a recommendation to adopt any withdrawal rate, asset allocation or product. It is a description of published research so that you can ask better questions of someone who is regulated to advise you. Tax rules, pension systems and available products differ by country and change frequently, past returns do not predict future ones, and any decision here should be made with a qualified professional who knows your circumstances.
On the links above: some are affiliate links, marked (paid link). If you buy through one we may earn a commission at no additional cost to you. As an Amazon Associate I earn from qualifying purchases. We link to product searches rather than specific items so that recommendations do not break as models change, and we say plainly when we are choosing not to link something. Full policy: Affiliate Disclosure.
Sources
- Bengen, W.P. “Determining Withdrawal Rates Using Historical Data.” Journal of Financial Planning, October 1994.
- Cooley, P.L., Hubbard, C.M. & Walz, D.T. “Retirement Savings: Choosing a Withdrawal Rate That Is Sustainable” (the Trinity study). AAII Journal, 1998.
- Morningstar. The State of Retirement Income and annual safe withdrawal rate research. (3.9% starting safe withdrawal rate for 2026, up from 3.7% for 2025; 30-year horizon; 90% success probability; steady inflation-adjusted spending; highest rates at roughly 30–50% equity allocations; explicit preference for flexible over rigid withdrawal strategies.)
- Social Security Administration actuarial life tables. (17.5 further years for a 65-year-old man, 20.1 for a woman; roughly a 25% chance of living past 90 and a one-in-ten chance of reaching 95.)