The Median Forfeiture Is $1,678. A Lawyer to Contest It Costs About Twice That.
In This Series: Personal Finance & Investing
- Why Most Stock Investors Lose Money: What the Evidence Actually Shows
- Options and Futures: Where Retail Money Actually Goes
- Two Retirees, the Same Returns, Only One Runs Out. The Difference Is the Order.
- Deposit Insurance Stops at $250,000. Since 2008, Uninsured Depositors Have Actually Lost Money in Six Per Cent of Failures.
- Courts Resolve More Than Seventy Per Cent of Debt Suits Without a Defence. Fewer Than One Defendant in Ten Has a Lawyer.
- Your Home Insurance Almost Certainly Does Not Cover Flooding
Key takeaways · 10 min read
- The median cash forfeiture in the states that report it is $1,678, against an estimated $3,300 to contest one. That gap, not the standard of proof, is the mechanism.
- Seventy-one per cent of federal forfeitures are administrative — no judge ever sees them. In three states with records, 62 to 76 per cent of seizures were forfeited by default.
- In half the states, the statutory deadlines before a hearing add up to 188 days.
- At least $82 billion has been forfeited since 2000. The people who produced that figure say it is likely an undercount, and sixteen states cannot be counted at all.
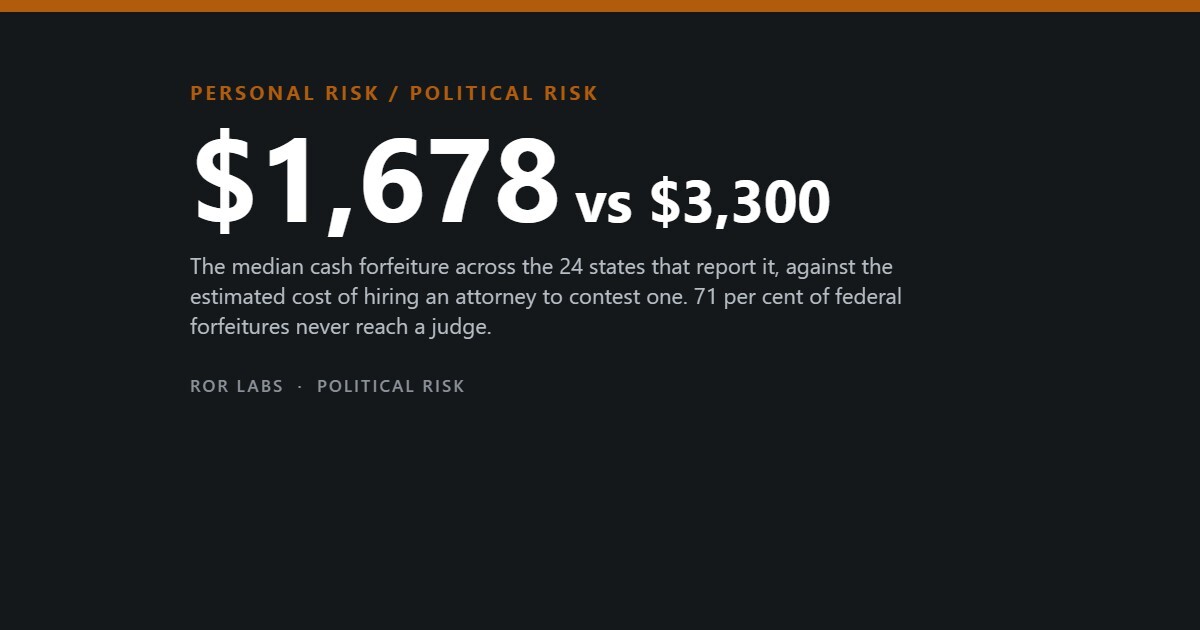
Across the twenty-four states that publish the figure, the median cash forfeiture is $1,678. The estimated cost of hiring an attorney to contest one is about $3,300. Nearly everything else about civil forfeiture follows from those two numbers sitting next to each other.
Civil forfeiture is a proceeding against property rather than against a person. In most jurisdictions the government does not have to charge the owner, and does not have to convict anyone, because the case is formally against the cash or the car. The owner who wants the property back is the party who has to act — within a deadline, usually in writing, usually without a lawyer, because nobody appoints one for a civil case about $1,678.
What follows is what the published data actually establish. On the money, quite a lot. On whether any of it reduces crime, remarkably little — and the two best attempts to answer that question point in opposite directions.
The number that decides everything
What a typical forfeiture is worth, and what fighting it costs
Institute for Justice, Policing for Profit, 4th edition, March 2026.
A rational owner facing that arithmetic does nothing, and the data show that most of them do exactly that. Seventy-one per cent of federal forfeitures are administrative — completed by the seizing agency itself, with no judge involved at any point, because no claim was ever filed. In the three states whose records allow the question to be asked, between 62 and 76 per cent of seizures ended in forfeiture by default.
How forfeitures are actually resolved
Institute for Justice, Policing for Profit, 4th ed., 2026. The three-state range covers the only jurisdictions whose published case records identify default outcomes.
This is the part of the subject most often described backwards. The usual complaint is that the standard of proof is too low, and in many states it is. But the standard of proof only matters in the cases that reach a hearing, and roughly seven in ten never do. The operative mechanism is not an unfair trial. It is the absence of a trial, produced by a price.
Time does the rest. Summing the statutory deadlines that stand between a seizure and a hearing, the Institute for Justice reports that in half the states those known waiting periods add up to 188 days. Six months without the money, before the argument about the money begins.

Eighty-two billion dollars, counted badly
The scale is large and the measurement of it is poor, and both facts matter. Compiling every federal and state record it could obtain, the Institute for Justice puts the total forfeited since 2000 at at least $82 billion. Federal forfeiture has run at $2 to $3 billion a year since 2014. The 34 states with usable annual data forfeit somewhere between $300 and $350 million a year between them. For 2023, 45 states reported about $300 million, against roughly $4.5 billion federally.
The scale, as far as it can be measured
Institute for Justice, Policing for Profit, 4th ed., 2026.
The authors add their own caveat, and it is worth quoting because it is unusual for an advocacy organisation to undercut its own headline: these figures “are likely undercounts, as data remain limited”. Sixteen states cannot be counted at all. Nobody knows the true total, including the people who produced the best estimate of it.
Does it reduce crime?
This is the question the entire policy rests on, and it has been asked properly perhaps half a dozen times. The most direct attempt assembled forfeiture records from five states — Arizona, Hawaii, Iowa, Michigan and Minnesota — covering hundreds of agencies from 2005 to 2013, $441.9 million in state and local proceeds plus $218.3 million routed through the federal equitable sharing programme, and tested them against crime-clearance and drug-use outcomes.
It found nothing. More forfeiture revenue was not associated with higher clearance rates for any offence category, and not associated with improvement on any of four separate measures of drug use. The one association that reached significance ran the wrong way: a $1,000 increase in forfeiture proceeds per officer was associated with a decrease in violent-crime clearance rates of 7 per 1,000 incidents.
Five states, hundreds of agencies, nine years
Kelly, B.D., Does Forfeiture Work?, Institute for Justice, 2021.
A null result is not proof of no effect, and this one comes from the organisation that litigates against forfeiture. But the study design is conventional, the data are administrative rather than survey-based, and no comparably sized study has found the positive result. The honest summary is that the crime-reduction case for forfeiture has never been demonstrated, not that it has been refuted.
What rises when budgets fall
The same study found something the crime models did not predict. A one percentage point increase in the local unemployment rate was associated with a 12 per cent increase in forfeiture proceeds. That coefficient is only significant at the ten per cent level, which is weak, and it should be read as a suggestion rather than a finding. But it is a suggestion that other work has independently produced.

An analysis in the Journal of Law and Economics looked at what happens when a municipality runs a deficit and its police department is allowed to keep what it seizes. Arrests for drug offences, driving under the influence and prostitution rose — the offence categories that generate seizable property. Seizures from Black and Hispanic people rose. Drug and DUI arrests of white people showed no comparable sensitivity to the local fiscal position.
A separate line of work found that the larger the share of a local government’s revenue that comes from fees, fines and forfeitures, the lower its violent-crime and property-crime clearance rates — significantly so for both. These are correlations across jurisdictions, and jurisdictions that lean on fine revenue differ in many other ways. But three independent research groups, using different data, keep finding the same shape: the fiscal position of the agency predicts its enforcement pattern.
Three findings about budgets and enforcement
Kelly 2021; Makowsky, Stratmann & Tabarrok, Journal of Law and Economics, 2019; Goldstein, You & Sances.
Reform leaks into the federal channel
Most states have passed some kind of forfeiture reform — raising the standard of proof, requiring a conviction, capping what the seizing agency may keep. Two large studies asked whether those laws bind, and got the same answer.
One examined roughly 600 agencies over 2000 to 2012; the other, 572 agencies. Both found that agencies operating in states with more restrictive forfeiture laws collect more money through federal equitable sharing, the arrangement under which a local agency partners with a federal one, the case proceeds under federal law, and the proceeds come back. The state reform raises the cost of the state route, and the traffic moves to the route the state legislature does not control.
This is the single most practically important finding in the literature, because it means that a state-level reform evaluated on state-level data will look more effective than it is. The money does not stop. It changes address.

What the evidence does not show
Four things cut against the summary above, and a reader who only hears the critical case is being handled.
First, one of the two equitable-sharing studies declined to draw the conclusion that is usually drawn from it. Having found no clear state-level “policing for profit” effect, its authors wrote that they “cannot assert that policing for profit is necessarily problematic”. Second, a study in Economic Inquiry that did find agencies responding to forfeiture incentives described those responses as “in economic terms very weak” — a result that damages the reform case and the enforcement case at the same time.
Third, and most awkwardly for everything above, another Economic Inquiry paper exploited the gap between state law and federal equitable sharing as a natural experiment. Where the federal channel let police keep more than their own state permitted, crime fell by about 17 per cent and drug arrests rose 37 per cent. The same paper found roadway fatalities rose. That is a real deterrence estimate from a credible design, and it is the strongest published evidence that forfeiture does something.
Fourth, there is a question about whether the money is even an incentive. One study found that local governments respond to seizure revenue by reducing their other allocations to the police — offsetting the windfall rather than adding to it. If that holds generally, the department does not end up richer, and the behavioural story that the whole critique rests on weakens considerably.
Two credible studies that do not agree
Kelly 2021; Kantor, Kitchens & Pawlowski, Economic Inquiry, 2021. Different designs, different identifying assumptions, opposite conclusions. Neither has been overturned.
It is also worth naming the source of most of the numbers in this article. The Institute for Justice is a libertarian public-interest law firm that litigates forfeiture cases. Its data collection is the most thorough that exists, its methods are documented, and it publishes its own undercount warnings. It is also not a neutral party, and the $3,300 attorney-cost figure at the top of this article is its own estimate rather than a measured market price. Use the money figures; treat the framing as an argument.
The short version
- The median cash forfeiture in the states that report it is $1,678, against an estimated $3,300 to contest one. That gap, not the standard of proof, is the mechanism.
- Seventy-one per cent of federal forfeitures are administrative — no judge ever sees them. In three states with records, 62 to 76 per cent of seizures were forfeited by default.
- In half the states, the statutory deadlines before a hearing add up to 188 days.
- At least $82 billion has been forfeited since 2000. The people who produced that figure say it is likely an undercount, and sixteen states cannot be counted at all.
- Across five states and nine years, forfeiture proceeds showed no association with crime clearance or drug use. The one significant coefficient was negative.
- Local fiscal stress predicts enforcement: unemployment, municipal deficits and fine-revenue dependence all track forfeiture activity and arrest patterns.
- State reforms push money into federal equitable sharing rather than stopping it, so state-level evaluations overstate their own success.
- One strong natural experiment found crime fell about 17 per cent where police could keep more. It has not been refuted, and it contradicts the null results. The question is open.
This describes what published administrative data and peer-reviewed research have found about civil asset forfeiture in the United States. It is not legal advice and not a guide to any individual case; forfeiture deadlines are short, vary by state and by whether the case is state or federal, and anyone whose property has been seized should speak to a lawyer licensed in that jurisdiction rather than rely on anything here. Several of the figures come from an organisation that litigates against the practice, which is noted where it matters. Where the evidence cannot settle a question — whether forfeiture affects crime, above all — that is said rather than resolved.
Further reading: the Policing for Profit state-by-state appendix is the only place the raw numbers are assembled, and each state’s page can be read on its own in two minutes. Does Forfeiture Work? is a short report whose methods section is unusually readable for a regression study. The Economic Inquiry deterrence paper is technical, but its introduction states the identification strategy plainly enough to judge.
- The Debt Trap, Josh Mitchell (2021). A different debt system, but the same mechanism: how an ordinary financial obligation traps people in a legal machine.
- Noise, Daniel Kahneman, Olivier Sibony & Cass Sunstein (2021). On unwanted variability in judgment — relevant to how unevenly forfeiture gets applied.
- The Scout Mindset, Julia Galef (2021). On reasoning to see clearly rather than to defend a position.
Sources
- Institute for Justice, Policing for Profit: The Abuse of Civil Asset Forfeiture, 4th edition, March 2026. (At least $82bn forfeited since 2000 across all obtainable federal and state records. Federal forfeiture $2–3bn per year since 2014; 34 states with usable data forfeit $300–350m per year combined; in 2023, 45 states reported about $300m against about $4.5bn federally. Median currency forfeiture $1,678 across 24 states; estimated attorney cost to contest, $3,300. 71% of federal forfeitures administrative. In three states with usable records, 62–76% of seizures forfeited by default. “In half the states, the known deadlines leading up to a hearing add up to 188 days.” States that the figures “are likely undercounts, as data remain limited”. IJ is a public-interest law firm that litigates forfeiture cases.)
- Kelly, B.D., Does Forfeiture Work? Evidence from the States, Institute for Justice, 2021. (Five states — AZ, HI, IA, MI, MN — hundreds of agencies, 2005–2013. $441.9m state and local proceeds plus $218.3m equitable sharing. No association between forfeiture proceeds and crime clearance rates for any offence category, and none with four separate drug-use measures. “A $1,000 increase in forfeiture proceeds per officer is associated with a decrease in violent crime clearance rates of 7 per 1,000 incidents.” “A one percentage point increase in the unemployment rate…is associated with a 12% increase in forfeiture proceeds”, significant at p<.10 only.)
- Makowsky, M.D., Stratmann, T. and Tabarrok, A., “To Serve and Collect: The Fiscal and Racial Determinants of Law Enforcement”, Journal of Law and Economics, 2019. (Where police retain forfeiture proceeds, municipal deficits are followed by increased arrests for drug, DUI and prostitution offences and increased seizures from Black and Hispanic people; white drug and DUI arrests show no comparable sensitivity to the local fiscal position.)
- Holcomb, J.E. et al., “Civil Asset Forfeiture Laws and Equitable Sharing Activity by the Police”, Criminology & Public Policy, 2018. (About 600 agencies, 2000–2012. Agencies in states with more restrictive forfeiture statutes collect more federal equitable sharing revenue.)
- Worrall, J.L. and Kovandzic, T.V., “Is Policing for Profit? Answers from Asset Forfeiture”, Criminology & Public Policy, 2008. (572 agencies. Same equitable-sharing displacement result. The authors state they “cannot assert that policing for profit is necessarily problematic”.)
- Kantor, S., Kitchens, C. and Pawlowski, S., “Civil Asset Forfeiture, Crime, and Police Incentives: Evidence from the Comprehensive Crime Control Act of 1984”, Economic Inquiry, 2021. (Where federal equitable sharing allowed police to retain more than state law permitted, crime fell by approximately 17% and drug arrests rose 37%; roadway fatalities increased. The strongest published deterrence estimate in this literature, and in direct tension with the null results above.)
- Kelly, B.D. and Kole, M., “The Effects of Asset Forfeiture on Policing: A Panel Approach”, Economic Inquiry, 2013. (Finds agencies do respond to forfeiture incentives, but describes the responses as “in economic terms very weak”.)
- Goldstein, R., You, H.Y. and Sances, M.W., work on local revenue composition and clearance rates. (A higher share of local revenue from fees, fines and forfeitures is associated with significantly lower violent-crime and property-crime clearance rates. Cross-sectional; jurisdictions that depend on fine revenue differ in other ways.)
- Jacobson, M. and Baicker, K., on fiscal offsetting. (Local governments reduce other police allocations in response to seizure revenue, offsetting rather than compounding the windfall. If general, this weakens the behavioural mechanism the critique depends on.)