Rip Currents and Beach Drowning: What the Evidence Shows
Key takeaways · 13 min read
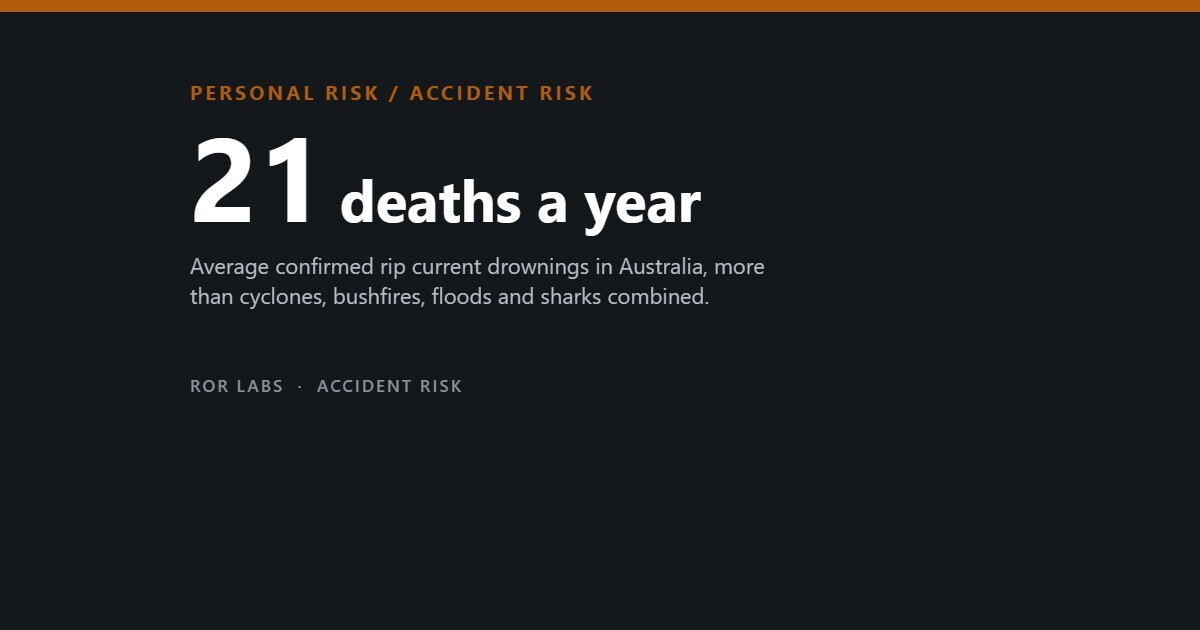
- Australia averages about 21 confirmed rip current drownings a year, more than cyclones, bushfires, floods and sharks combined on long-run averages.
- US estimates range from 35 to more than 100 rip deaths a year; the National Weather Service recorded 59 in 2024 and says many go unreported.
- Most people cannot spot a rip. Only 22% of beachgoers in a New Zealand study could point to a real one in front of them.
- Neither floating nor swimming parallel worked every time in field experiments. Do not fight the current; stay afloat, signal and change tactics if needed.
In 2013 a team led by the coastal scientist Robert Brander set the number of people killed by rip currents in Australia against the country’s better-known natural hazards. Rips accounted for an average of 21 confirmed deaths a year. Cyclones, bushfires, floods and shark attacks together averaged 18.7. A hazard that rarely kills more than one person at a time, and seldom makes the national news, was quietly outstripping all four.
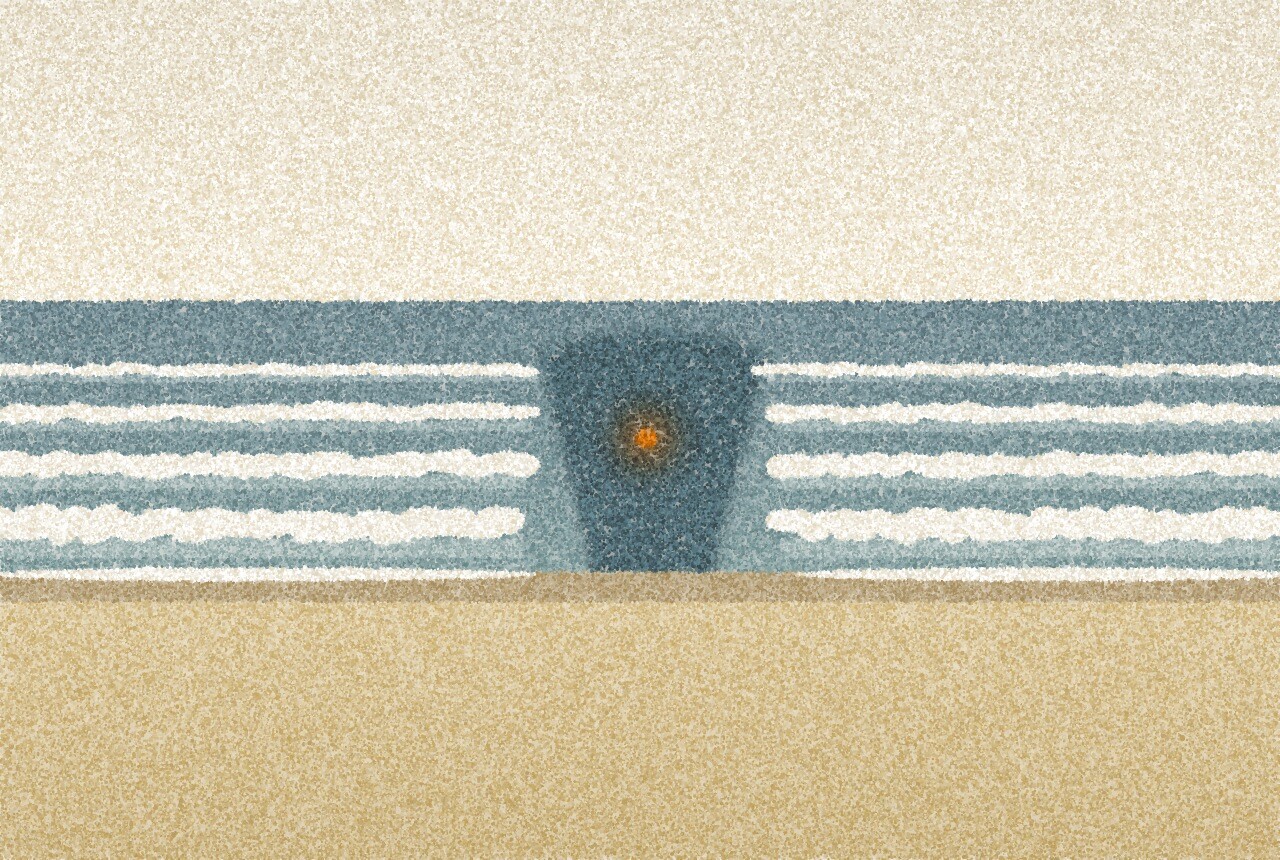
Rip currents are narrow flows of water running away from the shore on beaches with breaking waves. They are typically 5 to 50 metres wide, move at around 0.3 to 0.5 metres a second over hours, and can pulse to 2 metres a second or more for short spells. They do not pull people under. They carry them away from the beach; the danger is what follows: exhaustion, panic, or swimming straight back against the flow.
This article looks at how many people rips kill, why most beachgoers cannot see them, what escape experiments found, what lifeguards change, and why would-be rescuers die. Most numbers come from Australia and the United States, where the research is densest.
Counting the deaths
Nobody knows exactly how many people die in rip currents each year, and in the United States the estimates differ by a factor of about three. An analysis of news reports and federal storm records for 1994 to 2007, by Vittorio Gensini and Walker Ashley, found an average of 35 reported deaths a year, with men more than six times as likely to die as women. The United States Lifesaving Association (USLA), the professional body for beach lifeguards, has long said the true figure exceeds 100.
The USLA number is an inference. A 2019 study by Chris Brewster, Richard Gould and Rob Brander cleaned 20 years of lifeguard rescue reports and found rip currents were the primary cause of 81.9% of rescues on surf beaches. Applying that share to estimates of all surf-beach drownings gives more than 100 rip deaths a year. That assumes rips cause the same share of deaths as of rescues, which cannot be checked, because many drownings happen unseen.
The National Weather Service keeps its own tally. It recorded 63 surf-zone deaths in 2024, 59 of them attributed to rip currents, and 99 surf-zone deaths of all kinds in 2025. By 22 September 2026 its preliminary count for the year stood at 56. The agency itself warns that “so many go unreported and undocumented” that its figures may not match other sources.
Four ways to count rip deaths in the United States
Annual figures from news-based research, the National Weather Service and the lifeguards’ association.
Sources: Gensini VA, Ashley WS, Natural Hazards (2009), doi:10.1007/s11069-009-9458-0; National Weather Service surf zone fatality pages for 2024 and 2025; Brewster BC et al., Natural Hazards and Earth System Sciences (2019). The NWS counts are acknowledged to be incomplete.
Every source agrees on the pattern: the typical victim, the weather service says, is a male aged 10 to 29, and most deaths happen in June and July.
More than bushfires and sharks
Australia counts more carefully, matching coronial records with lifesaving reports and news. A Surf Life Saving Australia analysis of 2004 to 2011 found rip currents were a factor in 145 of 629 coastal drowning deaths, an average of 21 a year, and in 48.3% of major rescues. That was the figure Brander and colleagues set against long-run averages from the national disaster database and the Australian Shark Attack File: 7.5 deaths a year from cyclones, 5.9 from bushfires, 4.3 from floods and 1 from sharks.
Average deaths a year in Australia, by hazard
Confirmed rip current drownings against long-run averages for four high-profile hazards.
Source: Brander RW et al., Natural Hazards and Earth System Sciences 13:1687 (2013), doi:10.5194/nhess-13-1687-2013. The averages cover different periods, from 7 years for rips to 160 for floods.
The comparison has a catch the authors pointed out themselves. The rip figure covered seven years; the flood figure covered 160. Over the seven years they shared, bushfires were the bigger killer, at 27.1 deaths a year, because that period included Black Saturday in February 2009, when 173 people died in Victoria. Take that one day out and bushfires fall to 2.4 a year, and rips come to double the other hazards combined. Extreme heat was left out. And the 21 counts only confirmed cases, recorded as rip-related only when a witness said so.
A 2025 study led by Sean Kelly extended the record to 2023 and found 407 rip current drowning deaths over 19 years, again 21 a year. Set against coastal visits, that is 0.11 deaths per million visits: a small risk on any one day. Of those who died, 85% were male, 59% died in regional or remote areas and 80% had other people with them. For every death, the authors estimated, 2,449 people were rescued by someone else and 8,171 got themselves out.
Why rips are hard to see
Safety campaigns usually begin with ‘learn to spot a rip’. The research on whether people can is discouraging. In a 2012 survey of 392 beachgoers on three Texas beaches, Christian Brannstrom and colleagues showed five photographs and asked which was most hazardous. Only 13% chose the right one and located the rip; 87% picked the heaviest surf. At Pensacola Beach in Florida, fewer than 20% of 97 people could find the rips in photographs.
The mistake is understandable. A rip often looks like the calmest water on the beach: a darker gap where waves are not breaking, because the channel is deeper and the outgoing flow flattens the surf. To an untrained eye, that is the inviting spot.
How often people identified a rip current
Share of respondents who correctly located a rip, by study and method.
| Study | Where and who | Method | Correct |
|---|---|---|---|
| Caldwell 2013 | Pensacola Beach, Florida; 97 people | Photographs | Under 20% |
| Brannstrom 2014 | Three Texas beaches; 392 people | Photographs | 13% |
| Pitman 2021 | Muriwai Beach, New Zealand; 132 people | A real rip on the day | 22% |
| Pitman 2021 | 41 people who marked rips in both photos | The same real rip | 34% |
Sources: Caldwell N et al., Natural Hazards (2013), doi:10.1007/s11069-013-0673-3; Brannstrom C et al., Natural Hazards (2014), doi:10.1007/s11069-014-1061-3; Pitman SJ et al., Natural Hazards and Earth System Sciences 21:115 (2021). All were convenience samples.
Photographs may flatter people. In January 2019 Sebastian Pitman and colleagues asked 132 beachgoers at Muriwai Beach in New Zealand to point to a channel rip that a senior lifeguard had confirmed was active in front of them. Only 22% could. Of those who had correctly marked rips in both test photographs, just 34% found the real one. Visitors from overseas did worst, at 8%, against 25% for New Zealand residents, and surfers and bodyboarders made up 62% of those who got it right.
The authors warned that spotting a rip on paper may make people overconfident in the water, and readier to swim away from lifeguards.
Swim parallel or float
For decades the standard advice was simple: if you are caught in a rip, swim parallel to the beach until you are out of it. That advice rested on a picture of rips as straight jets running out past the breakers. Field studies with GPS drifters complicated the picture. At Monterey in California, Jamie MacMahan and colleagues found that rips often formed large, semi-enclosed eddies; on average only about 19% of the drifters released into them left the surf zone each hour. Most were carried round and back towards the sandbars. That supported a different message: float, save energy, and let the circulation bring you back.
The two messages were then tested with people. At Shelly Beach in New South Wales, Jak McCarroll, Rob Brander and colleagues fitted GPS units to volunteer swimmers in three rip currents over three days. Floating took longer and varied more, averaging 3.8 minutes to safety, against 2.2 minutes for swimming parallel. Neither worked every time. Swimming parallel failed when the swimmer headed into the current feeding the rip; floating failed when the rip carried the swimmer out beyond the surf zone.
Two field experiments on escaping a rip
Average time for volunteer swimmers to reach safety, and what affected it.
Float: average 3.8 min (SD 2.4)
Swim parallel: average 2.2 min (SD 1.0)
Three rips over three days; neither strategy 100% successful
Bars joined to the shore: 0.8 min
Bars detached from the shore: 2.4 min
100 attempts; floating failed most often where bars were detached
Sources: McCarroll RJ et al., Natural Hazards (2014), doi:10.1007/s11069-013-0979-1; Van Leeuwen BR et al., Natural Hazards (2016), doi:10.1007/s11069-015-2072-4. Small experiments with fit volunteers under controlled conditions.
A second study, at North Cronulla, made 100 escape attempts. Where sandbars were detached from the beach, escapes took three times as long and floating failed more often, because there was no shallow bar for the circulation to deliver swimmers to.
Computer modelling of four rips in south-west France, by Bruno Castelle and colleagues, found that the best strategy in one rip could be the worst in another nearby on the same coast. In a 2016 review the researchers concluded that promoting a single universal escape message “is not appropriate, or safe.” The International Life Saving Federation now endorses a sequence instead: do not panic, seek help, float or swim parallel, and reassess, switching if the first approach fails. The field work and a 2021 energy model by Archie Withers and Sergio Maldonado agree on one point: swimming straight back against the current is almost always the worst choice.
These were small experiments with fit volunteers under controlled conditions. As the review notes, they cannot reproduce what fear does to a swimmer caught by surprise.
What people actually do
Fear is the missing variable. In 2011 Danielle Drozdzewski and colleagues surveyed 671 people who had been caught in a rip and survived, most of them recruited through a Sydney surf-culture email list. The message they most often remembered was to swim parallel to the beach. The response they most often described was swimming against the rip, towards shore, and panic was mentioned even more. “I panicked and forgot everything I knew about what to do in a rip,” one respondent wrote.
Yet 83% got out without help; 6% were rescued by a lifeguard and 11% by someone else. The sample was self-selected and confident in the water, so it describes survivors, not those who drowned.
Knowing the advice is common. In a 2024 online survey of 1,226 American adults, 64% named swimming parallel as the best escape and 8% floating. But only 44% knew rips are the leading cause of US surf drownings, 44% said they followed beach signs, and 23% said they swam near lifeguards.
The flags and the lifeguards
If one piece of advice is well supported, it is to swim where lifeguards are watching. The USLA puts the chance of fatally drowning at a beach protected by its affiliated lifeguards at 1 in 18 million, based on ten years of reports comparing estimated attendance with deaths in guarded areas. The National Weather Service repeats the figure.
That number needs care. Attendance is estimated by the agencies themselves, only guarded areas and hours count, and people who choose guarded beaches may differ from those who do not. It shows guarded beaches are very safe, not exactly how much safer.
A Queensland study gives a cleaner comparison for rescues, if not for deaths. Ogilvie Thom and colleagues analysed 8,515 rescues by Surf Life Saving Queensland on 54 beaches between July 2016 and October 2021, alongside lifesavers’ counts of where people were swimming. The 31.4% of swimmers outside the flagged area accounted for 81.5% of rescues, a relative risk of 9.76. More than half of all rescues happened within 100 metres of the flags. Patrols are placed between rips, so the water just beside them is often where rips run; some of those rescued may have entered between the flags and drifted out.
Where swimmers were, and where rescues happened
Swimmers and rescues inside and outside the flagged area on 54 Queensland beaches, July 2016 to October 2021.
Source: Thom O et al., Natural Hazards (2024), doi:10.1007/s11069-024-06746-3. Observational; swimmer counts were made by lifesavers, and rescues are not deaths.
Deaths follow the same geography. Of 264 rip-related coastal deaths in Australia between 2011 and 2021, 59% happened more than a kilometre from a surf lifesaving service, according to a Surf Life Saving Australia analysis presented in 2022. Visitors are a particular concern: in the Muriwai study, overseas visitors were the least able to recognise a rip.
The rescuers who drown
The most painful pattern in the data is the rescuer who drowns. Jasmin Lawes and colleagues identified 67 people who died in Australian coastal waters between July 2004 and June 2019 while trying to rescue someone else, about 4.5 a year. Most were men (81%), 69% were trying to save a family member or loved one, and 63% were going to the aid of a child. Rip currents were present in 73% of the incidents and in 93% of those on beaches. Only two of the 67 took anything that floats, and both were off-duty volunteer lifesavers.
People who died trying to rescue someone else
Characteristics of 67 fatal bystander rescues in Australian coastal waters, 2004–2019.
Source: Lawes JC et al., PLOS ONE (2020), doi:10.1371/journal.pone.0238317. Coronial and lifesaving data; 18% of cases were still open at the time of analysis.
The pattern recurs. In April 2026 at Cocoa Beach, Florida, a 42-year-old man and a 34-year-old woman died after going into the water to save a child, who survived; the nearest lifeguard was three-quarters of a mile away, and the county was trying to recruit at least 45 more. In August a 47-year-old teacher from Georgia drowned at Myrtle Beach after getting a girl caught in a rip to safety, after lifeguards had gone off duty.
Lawes and colleagues single out flotation: something buoyant interrupts the drowning process and protects the rescuer. That advice rests on case series, not trials, which cannot ethically be run.
What the evidence suggests
Three things are well supported. Rips cause most surf rescues and a large share of surf drownings, even if the count is uncertain. Most people, including many who think they can, cannot reliably see them. And the risk concentrates where and when nobody is watching: outside the flags, on unpatrolled beaches, after hours, and among visitors who do not know the coast. The evidence on escape is weaker. No single strategy works in every rip; floating and swimming parallel each succeeded and failed in small experiments. The consistent message is not to fight the current, to stay afloat, to signal for help and to change tactics if the first one is not working.
Questions people ask
Do rip currents pull you under?
No. They carry swimmers away from the shore, not down. Drowning follows from exhaustion and panic, often after trying to swim straight back against the flow.
Should I swim parallel to the beach or float?
Either can work; neither always does. Stay calm, float to save energy, signal for help, and switch approach if one is not working.
How many people die in rip currents each year?
Australia averages about 21 confirmed deaths a year. US estimates range from about 35 to more than 100; the National Weather Service recorded 59 in 2024.
How can I spot a rip current?
Often as a darker, calmer gap between breaking waves. But most people cannot reliably spot one, so swim near lifeguards.
What should I do if someone else is caught in a rip?
Alert lifeguards or call emergency services, and if you go in, take something that floats. In an Australian study, 97% of people who died trying to rescue others took nothing buoyant.
The short version
- Australia averages about 21 confirmed rip current drownings a year, more than cyclones, bushfires, floods and sharks combined on long-run averages.
- US estimates range from 35 to more than 100 rip deaths a year; the National Weather Service recorded 59 in 2024 and says many go unreported.
- Most people cannot spot a rip. Only 22% of beachgoers in a New Zealand study could point to a real one in front of them.
- Neither floating nor swimming parallel worked every time in field experiments. Do not fight the current; stay afloat, signal and change tactics if needed.
- Swimmers outside the flags in Queensland were nearly ten times as likely to need rescue. Of 67 Australians who died trying to rescue others, 97% took nothing that floats.
This article summarises published research and public safety guidance for general information. It is not a substitute for local advice: conditions change from beach to beach and hour to hour. Follow lifeguards’ instructions and flags, and in an emergency call your local emergency number.
Further reading: Castelle et al., Earth-Science Reviews (2016), reviewing rip types and escape research. Kelly et al., Injury Prevention (2025), for the fullest count of Australian rip deaths. The National Weather Service’s surf zone fatality pages for the US tally.
- The Blue Machine, Helen Czerski (2023). A physicist explains how the ocean moves, from waves and currents to the global circulation. Good for understanding why water behaves as it does in the surf; it is about the whole ocean, so rips get little space.
- Why We Swim, Bonnie Tsui (2020). A journalist and swimmer on survival, wellbeing and community in the water, including people who lived through ordeals at sea. Rich on why we keep going in; it is storytelling, not safety data.
- The Art of Uncertainty, David Spiegelhalter (2024). A statistician on chance, risk and the limits of what numbers can tell us. Useful for reading drowning estimates that differ threefold; it never mentions rips.
Sources
Brander RW, Dominey-Howes D, Champion C, Del Vecchio O, Brighton B. Natural Hazards and Earth System Sciences 13:1687 (2013), doi:10.5194/nhess-13-1687-2013. — Brighton B, Sherker S, Bradstreet AJ, Thompson M. Injury Prevention 18(Suppl 1):A77 (2012), conference abstract. — Kelly S, Ledger J, Koon WA, Brander RW, Peden AE, Daw S. Injury Prevention (2025), doi:10.1136/ip-2024-045565. — Cooper B, Daw S, Lawes J. Injury Prevention (2022), doi:10.1136/injuryprev-2022-safety2022.144, conference abstract. — Gensini VA, Ashley WS. Natural Hazards (2009), doi:10.1007/s11069-009-9458-0. — Brewster BC, Gould RE, Brander RW. ‘Estimations of rip current rescues and drowning in the United States.’ Natural Hazards and Earth System Sciences (2019). — National Weather Service, Surf zone fatalities in the United States, 2024, 2025 and 2026 pages (accessed October 2026). — United States Lifesaving Association, Statistics page (accessed October 2026). — Brannstrom C, Trimble S, Santos A, Brown HL, Houser C. Natural Hazards (2014), doi:10.1007/s11069-014-1061-3. — Caldwell N, Houser C, Meyer-Arendt K. Natural Hazards (2013), doi:10.1007/s11069-013-0673-3. — Pitman SJ, Thompson K, Hart DE, Moran K, Gallop SL, Brander RW. Natural Hazards and Earth System Sciences 21:115 (2021), doi:10.5194/nhess-21-115-2021. — MacMahan J et al. Marine Geology (2010), doi:10.1016/j.margeo.2009.09.011. — McCarroll RJ, Brander RW, MacMahan JH, Turner IL, Reniers A, Brown JA. Natural Hazards (2014), doi:10.1007/s11069-013-0979-1. — Van Leeuwen BR, McCarroll RJ, Brander RW, Turner IL, Power HE, Bradstreet AJ. Natural Hazards (2016), doi:10.1007/s11069-015-2072-4. — Castelle B, Scott T, Brander RW, McCarroll RJ. Earth-Science Reviews (2016), doi:10.1016/j.earscirev.2016.09.008. — Drozdzewski D, Shaw W, Dominey-Howes D, Brander R, Walton T, Gero A. Natural Hazards and Earth System Sciences 12:1201 (2012), doi:10.5194/nhess-12-1201-2012. — O’Halloran C, Silver MW. Natural Hazards (2024), doi:10.1007/s11069-024-06761-4. — Thom O, Roberts K, Devine S, Leggat PA, Franklin RC. Natural Hazards (2024), doi:10.1007/s11069-024-06746-3. — Lawes JC, Rijksen EJT, Brander RW, Franklin RC, Daw S. PLOS ONE (2020), doi:10.1371/journal.pone.0238317. — Withers A, Maldonado S. Natural Hazards (2021), doi:10.1007/s11069-021-04740-7. — Fox News, Cocoa Beach drownings, 17 April 2026. — Fox News, Myrtle Beach drowning, 11 August 2026.