Ferry and Passenger Ship Accidents: What the Evidence Shows
Key takeaways · 13 min read
- A global database recorded 59,600 known deaths in 750 fatal passenger-vessel accidents from 1966 to 2015. 93% of the accidents were on domestic voyages; the Philippines, Bangladesh and Indonesia account for about 46% of the deaths.
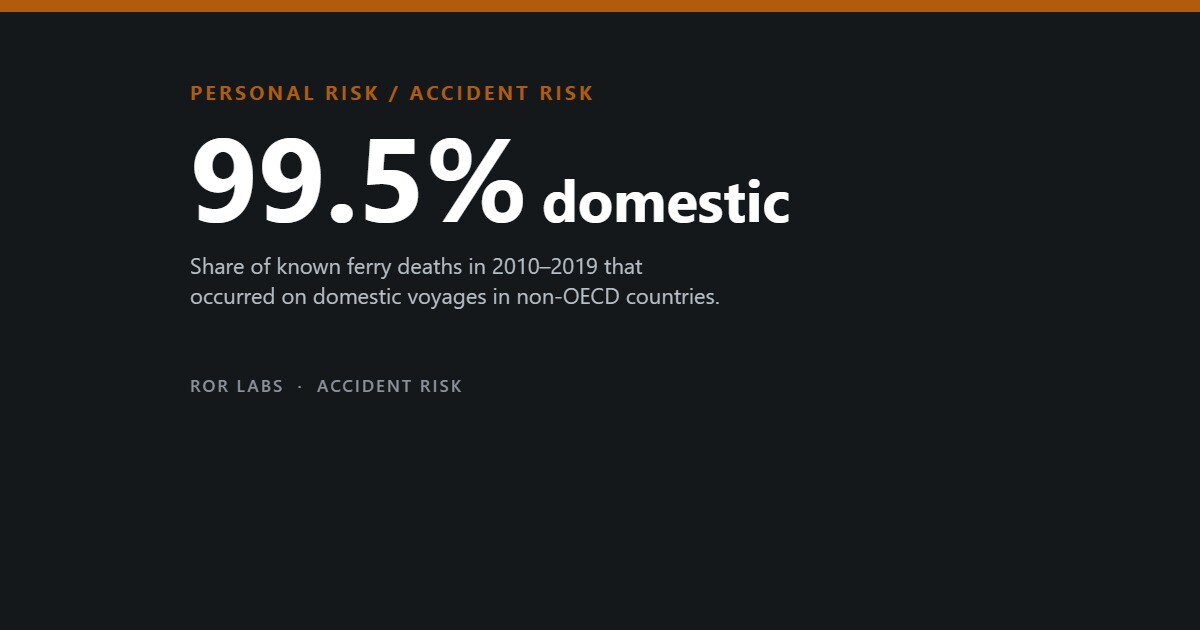
- An industry-funded study found 99.5% of known ferry deaths in 2010–2019 were on domestic voyages in non-OECD countries. In OECD countries, domestic ferries record fewer than one death per 100 million passengers.
- Bad weather played a part in half of 232 major accidents in 2000–2014, overcrowding in 29%. Water on the open car deck sank the Herald of Free Enterprise and the Estonia; rules were tightened after each.
- The Sewol carried 2,142 tonnes of cargo against 657 declared, and 761 tonnes of ballast against 1,565 required. 304 people died, 250 of them students; inquiries have not agreed on the final trigger.
On 13 September 2026 the Indonesian ferry Virgo Transport 8 capsized in the Java Sea on its way from Surabaya to Banjarmasin. Its manifest listed 243 people and 89 vehicles. A survivor told the Associated Press that passengers had been sleeping in hallways because the cabins were full. By 30 September, the 18th day of the search, 78 deaths had been confirmed.
It fits a pattern researchers have documented for decades. Ferries in the wealthy OECD countries carry enormous numbers of people with very few deaths. The deaths concentrate on domestic routes in a handful of lower-income countries, often on overloaded vessels, in bad weather, with no reliable record of who was aboard.
This article looks at where ferry deaths happen, what caused the best-known disasters, what the rules cover, and how much the figures miss.
Where the deaths happen
The longest-running global record is a database begun by the ferry researcher Neil Baird. A 2018 Lloyd’s Register Foundation report drew on it: between 1966 and 2015 it recorded 750 fatal accidents involving passenger vessels and 59,600 known deaths. Ninety-three per cent of the accidents were on domestic voyages, and 76% of the deaths occurred in the worst ten countries.
Known ferry deaths, 1966–2015
Deaths in fatal passenger-vessel accidents recorded in the Baird/ANCORS database: the three worst-affected countries, and the whole of Europe for comparison.
Source: Lloyd’s Register Foundation, Insight report on safety in the passenger ferry industry, Report Series 2018.4 (2018). The report notes that fatality statistics in developing countries are unreliable.
A separate analysis by Abigail Golden and Roberta Weisbrod, published in 2016, compiled 232 major ferry accidents between 2000 and 2014, counting only those in which at least two people died. Together they killed 21,574 people, about 1,541 a year. Developing countries accounted for 94% of the accidents and 97% of the deaths. Bangladesh alone had 20% of the accidents and 23% of the deaths.
A 2023 scoping study by the World Maritime University (WMU) looked at seven high-risk countries: Bangladesh, the Democratic Republic of the Congo, Indonesia, Nigeria, the Philippines, Senegal and Tanzania. Between 2000 and 2021 it counted 6,348 domestic ferry deaths in Bangladesh alone. Its summary is stark: between 2010 and 2019, 99.5% of all known ferry deaths worldwide occurred on domestic voyages in non-OECD countries. Within OECD countries, the domestic ferry sector recorded fewer than one death per 100 million passengers a year.
In Bangladesh, a 2026 analysis of official accident records for 2008 to 2022 found that passenger vessels accounted for 93.9% of all deaths in maritime accidents, and that collisions were the leading cause.
Five disasters that shaped the rules
The deadliest peacetime ferry disaster on record is the Doña Paz, a Philippine ferry that collided with the tanker Vector on 20 December 1987 and burned. Its manifest listed 1,493 passengers and 59 crew. The usual figure for the dead, 4,386, is an estimate, because the ship carried far more people than it declared; only 24 survived. The tanker was found to be operating without a licence, a lookout or a qualified master.
Earlier that year, on 6 March 1987, the Herald of Free Enterprise had left Zeebrugge in Belgium with its bow doors open. Water flooded the open vehicle deck and the ship capsized, killing 155 passengers and 38 crew. On 28 September 1994 the Estonia lost its bow visor in heavy Baltic seas. The visor pulled the loading ramp open, water poured onto the car deck, and about 35 minutes later the ship vanished from radar. Of the 989 people aboard, 852 died.
The case was reopened after new damage was found on the wreck. In December 2025 Estonian and Swedish investigators concluded that the visor had failed under wave loads, that the ship had been unseaworthy because of uninspected structural weaknesses, and that there was no sign of a collision or explosion.
On 26 September 2002 the Senegalese ferry Le Joola capsized in a storm. It was rated for about 600 passengers and is thought to have been carrying around 2,000. The official death toll was 1,863; 64 people survived. One account lists overloading, unchecked stability, part-empty ballast tanks, unsecured vehicles and open portholes, with gusts of 35 to 45 knots tipping it over. On 16 April 2014 the South Korean ferry Sewol capsized with the loss of 304 lives; it has its own section below.
Five ferry disasters and what went wrong
Deaths are official or investigation counts except where marked as an estimate.
| Ship | Year | What happened | Deaths |
|---|---|---|---|
| Doña Paz, Philippines | 1987 | Collision with a tanker, then fire; far more aboard than on the manifest | About 4,386 (estimate) |
| Herald of Free Enterprise, off Zeebrugge | 1987 | Sailed with bow doors open; vehicle deck flooded | 193 |
| Estonia, Baltic Sea | 1994 | Bow visor failed in heavy seas; ramp pulled open | 852 of 989 |
| Le Joola, Senegal | 2002 | Capsized in a storm at about three times rated capacity | 1,863 |
| Sewol, South Korea | 2014 | Capsized during a turn; cargo far over the limit, ballast low | 304 of 476 |
Sources: Lloyd’s Register Foundation (2018); SAFETY4SEA; Roberts and Carter (2018); Karppinen and Rahka (1998); Company of Master Mariners of Australia (2022); Dostal et al. (2015).
Why ferries capsize
Golden and Weisbrod coded the causes of their 232 accidents. Hazardous weather played at least a partial role in half of them. Overcrowding or overloading appeared in 29%, collisions and navigation errors in 22%, and fire or engine trouble in 11%. In 14% the cause was unknown, which the authors treat as a finding in itself.
What went wrong in 232 major ferry accidents, 2000–2014
Share of accidents involving each factor. Accidents can have several, so shares exceed 100% in total.
Source: Golden AS, Weisbrod RE, Journal of Public Transportation 19(1):17–27 (2016). Accidents with two or more deaths only.
How often human error is to blame depends on the definition. Leaving out accidents with incomplete causal data, Golden and Weisbrod attributed 62% of accidents and 75% of deaths to human error on a conservative reading; on a broader one, 86% and 92%. That says less about carelessness than it seems: a master who sails into a storm with too many people aboard is responding to fares, schedules and weak enforcement. A 1991 review of Philippine ferries, then losing about 600 lives a year, concluded that the main underlying cause was poverty, and the most effective solution economic and political development rather than naval architecture.
Roll-on/roll-off design adds a specific hazard. A ro-ro ferry has a long, open vehicle deck. If water reaches it, through an open bow door, a failed visor or a hole, it runs to the lower side and the ship can lose stability very quickly. Overloading works the same way: weight carried high raises the centre of gravity, and loose cargo or crowds slide as the ship turns. One engineer, writing about design errors, contrasted the two and a half hours the Titanic stayed afloat with the two and a half minutes it took the Estonia to heel over.
The rules and where they stop
The International Convention for the Safety of Life at Sea (SOLAS) was first adopted in 1914, after the Titanic. Its current form, SOLAS 1974, applies to all passenger ships engaged on international voyages. The domestic routes where most passengers die are governed by national law instead, and standards and enforcement differ from country to country.
Europe’s ro-ro disasters drove most changes to ferry stability rules. After the Herald of Free Enterprise, a stricter damage-stability standard, SOLAS 90, took effect for ships built after 1990. Britain proposed upgrading existing ships in stages; the International Maritime Organization (IMO) rejected that, and north-west European countries agreed it among themselves.
The Estonia repeated the pattern. SOLAS 90 allowed for water on the vehicle deck in seas of about 1.5 metres significant wave height. When the IMO again declined to go further, a regional deal followed: the Stockholm Agreement of 1996. It requires ro-ro passenger ships on scheduled international routes in north-west Europe to survive damage with up to half a metre of water on the vehicle deck in seas of up to 4 metres, or to prove survival in model tests. The whole EU, Australia and Canada later adopted it.
The rules written after the disasters
Each major change followed a specific loss of life.
| Rule | Year | Prompted by | What it covers |
|---|---|---|---|
| SOLAS, first version | 1914 | Titanic | First international ship-safety treaty |
| SOLAS 1974, current form | 1974 | — | All passenger ships on international voyages |
| SOLAS 90 damage stability | 1990 | Herald of Free Enterprise | New ships built after 1990; water on deck in seas of about 1.5 m |
| Stockholm Agreement | 1996 | Estonia | Ro-ro ferries in north-west Europe; up to 0.5 m of water on deck in seas up to 4 m |
Sources: Guevara D, Dalaklis D, TransNav 15(2) (2021); Joseph A, Dalaklis D (2021), doi:10.1080/25725084.2021.1880766; Vassalos D, Paterson D, JMSE 8(9):693 (2020); Szymoński M, TransNav 15(2) (2021).
Attention has since turned to domestic fleets. By 2005 Interferry, the industry’s trade association, and the Worldwide Ferry Safety Association had set out a ten-year plan, with IMO support, to cut ferry deaths by 90%. The WMU study’s assessment is that around 1,000 deaths a year remains the norm among emerging economies.
What the Sewol investigations found
The Sewol left Incheon for Jeju on the evening of 15 April 2014 with 476 people aboard, including 325 students and 15 teachers from Danwon High School on a school trip. The next morning, near Jindo, it listed sharply and capsized. Of the 304 people who died, 250 were students.
Official audits and contemporary reporting, summarised in a 2015 policy study, described a ship that should not have sailed. Built in Japan in 1994 and bought in 2012, it had been rebuilt in a way that raised its centre of gravity. On its last voyage it carried 2,142 tonnes of cargo against 657 declared, and only 761 tonnes of ballast water against the 1,565 it was meant to carry. The capsize followed a sharp turn in the Maenggol channel, which has some of the fastest currents in Korean waters.
The rescue failed as badly as the ship. Coast guard units arrived about 40 minutes after the first emergency call but did not enter the ship or tell passengers to leave, while announcements told them not to move. The captain and crew were among the first rescued. The ship sank completely at 11:18 a.m. Only 172 people survived.
The Sewol’s last voyage: declared and actual loading
Cargo declared and actually carried, and ballast water required and actually carried, in tonnes.
Source: Board of Audit and Inspection (2014) and contemporary reporting, summarised in Dostal JM et al., Korean Journal of Policy Studies 30(1) (2015).
Exactly what tipped the ship over is still argued about. After the wreck was raised in 2017, a state panel reported in August 2018 that it could not settle on one cause: it set out an explanation based on poor stability, overloading and the turn, and an alternative in which an external impact could not be ruled out. A later commission closed in September 2022. The Korea Herald reported that it had concluded an external force was not the cause, while other accounts describe its final report as inconclusive.
The dispute does not change what every inquiry documented: a top-heavy ship, cargo far above its limit, too little ballast, and passengers told to stay put. Bereaved families campaigned for years for independent investigations, and the disaster became a turning point in South Korea’s debate about safety.
Ferries against other transport
The best common yardstick is old. In 2003 the European Transport Safety Council estimated deaths per 100 million passenger-kilometres in the EU around 2001–2002. Ferries came out at 0.25, against 0.7 for car occupants, 0.07 for buses and coaches, and 0.035 for both rail and air.
Deaths per 100 million passenger-kilometres in the EU
Estimates for 2001–2002. The ferry figure is averaged over 1984–2001 to reduce the weight of the Estonia.
Source: European Transport Safety Council, Transport safety performance in the EU: a statistical overview (2003). European data only.
Two caveats matter. The ferry figure had to be averaged over 18 years so that one accident would not dominate it. And the yardstick changes the ranking: per 100 million hours of travel, the same report gives 8 deaths for ferries, against 25 for cars, 16 for air and 2 for buses and rail.
Outside Europe no such comparison exists, because passenger numbers on domestic boats are poorly recorded. Golden and Weisbrod note that ferries are often a discretionary way to travel in North America and Europe, but far from it in the developing world, where for most victims the voyage was unavoidable.
What the numbers leave out
Every figure here is a count of known deaths, and the researchers who compiled them say the counts are incomplete. The Lloyd’s Register Foundation calls fatality statistics in developing countries unreliable. Golden and Weisbrod relied largely on news reports. Neil Baird wrote in his 2018 doctoral thesis that almost 2,000 deaths a year are known, and that because of reporting deficiencies the true toll could well be at least 50% higher.
The problem starts with the manifest. The Doña Paz listed 1,552 people and is thought to have carried nearly three times as many. Counting the dead depends on knowing who boarded, and on crowded launches that is often unknown. The datasets also apply different rules, and their annual averages range from about 1,000 to about 2,000 depending on the years and vessels included.
There is a second caution. The WMU study was funded by the Lloyd’s Register Foundation through Interferry. That does not make its figures wrong, and they agree with independent academic work, but the industry also has a reputational stake in showing that the danger lies outside its members’ fleets.
Finally, a few catastrophes dominate the totals. The Doña Paz alone accounts for about 7% of all deaths in the 50-year database. A trend drawn from a few years of data can swing on one accident, in either direction.
What the evidence suggests
The evidence points one way more consistently than most risk data. Ferries in OECD countries are among the safer ways to travel. The deaths concentrate on domestic routes in a small number of countries, on vessels that are overloaded, poorly maintained or caught in bad weather, and where rescue is slow. The engineering lessons of the Herald of Free Enterprise and the Estonia have been written into rules. The harder problem, as researchers have argued since 1991, is economic and political rather than technical.
For a traveller, the factors in the accident data are mostly visible: a vessel plainly over capacity, people sleeping in corridors, unsecured vehicles, a departure into a storm warning, life jackets missing or locked away, as on the Doña Paz. Where another sailing is possible, they are reasons to wait for it.
Questions people ask
Are ferries safe?
In OECD countries, yes: fewer than one death per 100 million passengers. Most deaths happen on domestic routes in a few lower-income countries.
Which countries have the most ferry deaths?
In the 1966–2015 global database, the Philippines, Bangladesh and Indonesia, which together account for about 46% of known deaths.
Why did the Estonia sink?
Its bow visor failed in heavy seas and pulled the ramp open, flooding the car deck. A 2025 re-examination found no sign of collision or explosion.
What caused the Sewol disaster?
Audits found it top-heavy after a rebuild, with more than three times its declared cargo and too little ballast; it capsized during a turn. Later inquiries disagreed over anything else.
Is a ferry more dangerous than flying?
Per kilometre in early-2000s EU data, yes: 0.25 deaths per 100 million passenger-kilometres against 0.035 for air. Both were far safer than travelling by car.
The short version
- A global database recorded 59,600 known deaths in 750 fatal passenger-vessel accidents from 1966 to 2015. 93% of the accidents were on domestic voyages; the Philippines, Bangladesh and Indonesia account for about 46% of the deaths.
- An industry-funded study found 99.5% of known ferry deaths in 2010–2019 were on domestic voyages in non-OECD countries. In OECD countries, domestic ferries record fewer than one death per 100 million passengers.
- Bad weather played a part in half of 232 major accidents in 2000–2014, overcrowding in 29%. Water on the open car deck sank the Herald of Free Enterprise and the Estonia; rules were tightened after each.
- The Sewol carried 2,142 tonnes of cargo against 657 declared, and 761 tonnes of ballast against 1,565 required. 304 people died, 250 of them students; inquiries have not agreed on the final trigger.
- Every count is an undercount: manifests miss passengers, and the researcher behind the main database estimates the true toll could be at least 50% higher.
This article summarises published research, accident investigations and news reports for general information. It is not safety advice for any particular journey; check official guidance for the route you plan to take.
Further reading: Lloyd’s Register Foundation, Insight report on safety in the passenger ferry industry (2018), for the long-run global data. Hebbar et al., Safety of domestic ferries: a scoping study of seven high-risk countries (World Maritime University, 2023), for the countries where risk is concentrated. Golden and Weisbrod, Journal of Public Transportation 19(1) (2016), for the causes of 232 major accidents.
- The Outlaw Ocean, Ian Urbina (2019). A reporter’s journeys through the parts of the sea that law barely reaches. Vivid on weak enforcement and who pays for it; it is about fishing and crime at sea more than ferries.
- Disaster by Choice, Ilan Kelman (2020). A short argument that disasters come from human decisions and vulnerability, not from nature alone. A useful frame for why ferry deaths cluster in poorer countries; it is a broad argument rather than a study of shipping.
- Foundations of Safety Science, Sidney Dekker (2019). A century of thinking about accidents, from ‘human error’ to whole systems. Helpful for reading the high human-error shares in ferry data with care; it is a textbook and reads like one.
Sources
Lloyd’s Register Foundation. Insight report on safety in the passenger ferry industry. Report Series 2018.4 (2018). — Golden AS, Weisbrod RE. Journal of Public Transportation 19(1):17–27 (2016). — Hebbar AA, Schröder-Hinrichs JU, Yıldız S, Kahlouche N. Safety of domestic ferries: a scoping study of seven high-risk countries. World Maritime University (2023). — Baird N. Fatal ferry accidents, their causes, and how to prevent them. PhD thesis, University of Wollongong (2018). — Ali MT, Uddin MI, Awal ZI. Journal of Maritime Research (2026), passenger vessel accidents in Bangladesh 2008–2022. — Spouge JR. Passenger ferry safety in the Philippines (1991), TRID 438870. — Lawson CT, Weisbrod RE. Journal of Public Transportation (2005), ferry disasters in developing nations. — SAFETY4SEA. Sinking of Doña Paz: the world’s deadliest shipping accident. — Roberts SE, Carter T. International Maritime Health (2018), doi:10.5603/IMH.2018.0015. — Karppinen T, Rahka K. (1998), doi:10.1080/135993798349541. — Swedish Accident Investigation Authority and Estonian Safety Investigation Bureau, M/V Estonia re-examination, via IIMS (18 December 2025). — Company of Master Mariners of Australia. ‘Africa’s Titanic’ 20 years later (2022). — Dostal JM, Kim HJ, Ringstad A. Korean Journal of Policy Studies 30(1):35–71 (2015), doi:10.52372/kjps30102. — The Diplomat. How the Sewol sinking changed South Korea (April 2024). — Marine Log. Investigation fails to pinpoint cause of Sewol ferry sinking (10 August 2018). — The Korea Herald. Editorial: Wasteful investigations (21 September 2022). — Andrews D. Journal of Marine Science and Engineering 9(1):34 (2021), doi:10.3390/jmse9010034. — Guevara D, Dalaklis D. TransNav 15(2) (2021), doi:10.12716/1001.15.02.15. — Joseph A, Dalaklis D. (2021), doi:10.1080/25725084.2021.1880766. — Vassalos D, Paterson D. Journal of Marine Science and Engineering 8(9):693 (2020). — Szymoński M. TransNav 15(2) (2021), doi:10.12716/1001.15.02.22. — European Transport Safety Council. Transport safety performance in the EU: a statistical overview (2003). — Associated Press, via WUSF (14 September 2026). — The Maritime Executive (1 October 2026).