Radon at Home and Lung Cancer: What the Evidence Shows
Key takeaways · 13 min read
- Pooling 13 European studies, lung cancer risk rose 8.4% per 100 Bq/m3 of measured radon, or 16% after correcting for measurement error. North American studies gave 11%.
- For a lifelong non-smoker, modelled risk of lung cancer by 75 moves from 0.41% to 0.67% between zero and 400 Bq/m3. For a smoker, it moves from 10.1% to 16.0%.
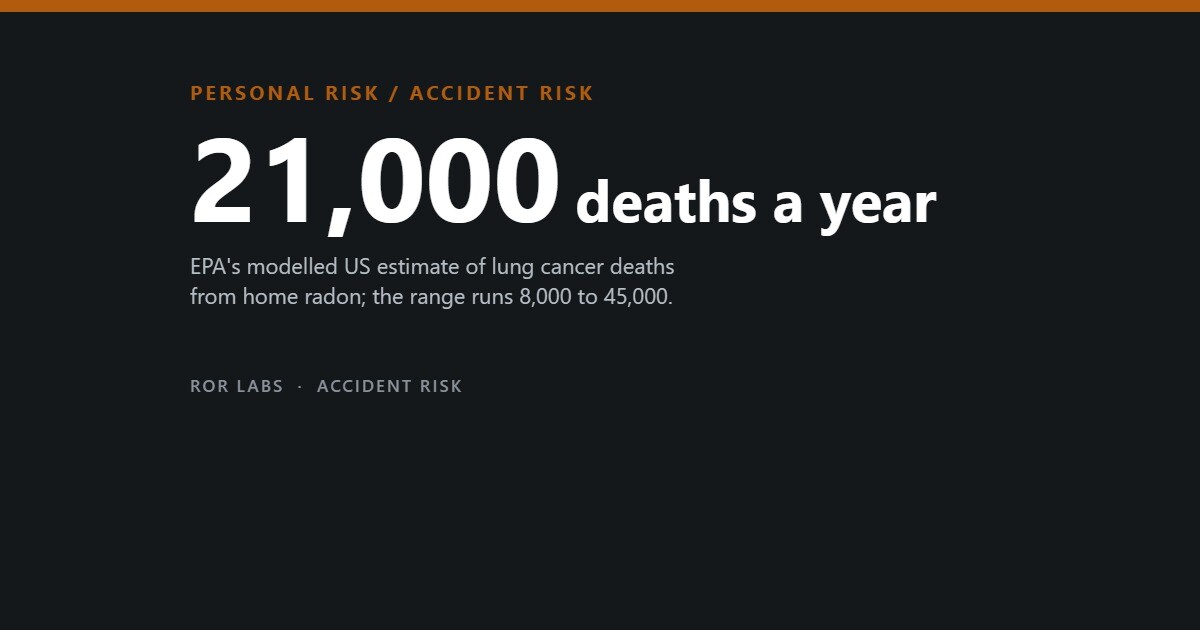
- The EPA’s 21,000 US deaths a year is a model, with a range of 8,000 to 45,000. About 2,900 are in people who never smoked.
- About one US home in 15 is estimated to be at or above the 4 pCi/L (148 Bq/m3) action level. The WHO suggests 100 Bq/m3.
Radon is a colourless, odourless radioactive gas formed by the slow decay of uranium in rock and soil. Outdoors it disperses. Indoors, drawn in through cracks and gaps in the floor, it can build up. Its short-lived decay products lodge in the lungs and give off alpha particles, which can damage the DNA of nearby cells.
Health agencies call radon the second leading cause of lung cancer after smoking. The World Health Organization (WHO) estimates it causes between 3% and 14% of lung cancers in a country. In the United States, the Environmental Protection Agency (EPA) puts the toll at about 21,000 deaths a year.
This article sets out what studies of people in ordinary homes found, how much of the risk is modelled rather than counted, why smoking dominates the picture, what action levels mean, how reliable home tests are, and whether fixes work and are worth the money.
What the pooled studies found
The strongest evidence comes from pooling raw data. In 2005 Sarah Darby and colleagues combined 13 case-control studies from nine European countries: 7,148 people with lung cancer and 14,208 without, all with detailed smoking histories and long-term radon measurements in the homes they had lived in over the previous 5 to 34 years. Controls’ homes averaged 97 Bq/m3 (becquerels per cubic metre); 11% measured above 200 and 4% above 400.
After adjustment for smoking, lung cancer risk rose by 8.4% for every 100 Bq/m3 of measured radon. The relationship looked like a straight line, with no sign of a safe threshold, and it stayed statistically significant in homes below 200 Bq/m3. Because one measurement is a noisy guide to decades of exposure, the authors also estimated the slope against “usual” long-term radon. Corrected for that noise, the increase was 16% per 100 Bq/m3, with a 95% confidence interval of 5% to 31%.
How much risk rises per 100 Bq/m3 of home radon
Increase in lung cancer risk per 100 Bq/m3, from pooled studies and one large cohort.
Sources: Darby S et al., BMJ 330(7485):223 (2005); Krewski D et al., Epidemiology 16(2):137–145 (2005); Turner MC et al., Cancer Epidemiology, Biomarkers & Prevention 20(3):438 (2011). Confidence intervals are wide: for the corrected European figure, 5% to 31%.
North America gave a similar answer. Daniel Krewski and colleagues pooled seven case-control studies with 3,662 cases and 4,966 controls, all measured with long-term alpha-track detectors. At 100 Bq/m3 the odds of lung cancer were 1.11 times higher, with a confidence interval of 1.00 to 1.28. A cohort of 811,961 Americans, linked to average radon in their county, found a 15% increase per 100 Bq/m3.
Careful smoking adjustment mattered. Without it, the European estimate would have been only 2.3% per 100 Bq/m3: a small effect can easily hide behind a large one.
From miners to living rooms
Long before anyone pooled household studies, radon was known to cause lung cancer in underground miners, who breathed far higher concentrations. Those cohorts remain the backbone of official risk estimates. The National Academy of Sciences’ BEIR VI report relied on them in 1999, and the EPA built its 2003 assessment on that report.
Applying miner data to homes involves leaps. The miners were men doing heavy physical work, their smoking patterns were not typical, and their exposures were far higher than in most homes. A 1997 meta-analysis noted that miner-based estimates suggested between 6,000 and 36,000 US lung cancer deaths a year from indoor radon, a sixfold range that shows how uncertain the extrapolation was.
The household studies narrowed that gap rather than closing it. The North American result was compatible with the 1.12 predicted by scaling down the miner data. The European team noted that miners exposed at lower levels showed risks of 19% to 30% per 100 Bq/m3, higher than but compatible with their own 16%. Two independent lines of evidence agreeing is reassuring. It does not make the precise number any less of an estimate.
Why smoking changes the picture
For an individual, the key question is not the 16% but what it applies to. In the European data, the proportional increase per 100 Bq/m3 did not differ significantly between smokers and non-smokers. But smoking multiplies the baseline: men smoking 15 to 24 cigarettes a day had about 26 times the lung cancer risk of lifelong non-smokers. The same percentage of a much larger number is a much larger absolute risk.
Risk of lung cancer by age 75, by home radon level
Modelled cumulative absolute risk, in the absence of other causes of death, from the European pooled analysis.
0 Bq/m3: 0.41%
100 Bq/m3: 0.47%
400 Bq/m3: 0.67%
800 Bq/m3: 0.93%
0 Bq/m3: 10.1%
100 Bq/m3: 11.6%
400 Bq/m3: 16.0%
800 Bq/m3: 21.6%
Source: Darby S et al., BMJ 330(7485):223 (2005). Calculated from usual (long-term average) radon, assuming a 16% increase per 100 Bq/m3 regardless of smoking.
Moving a lifelong non-smoker from zero radon to 400 Bq/m3, a level exceeded in about 4% of control homes in the European studies, raises the modelled risk of lung cancer by 75 from about 4 in 1,000 to about 7 in 1,000. For a smoker, the same change raises it from about 1 in 10 to about 1 in 6. The EPA’s tables show the same pattern at its action level of 4 picocuries per litre (pCi/L): over a lifetime, about 7 in 1,000 never-smokers could get lung cancer from that exposure, against about 62 in 1,000 smokers.
So most radon lung cancers occur in smokers and former smokers. A 2013 analysis in the American Journal of Public Health put their share at more than 85% and argued that tobacco control is the most promising route to the goals of radon policy. A UK analysis found that only about 1 in 7 radon-related lung cancer deaths was caused by radon without active smoking, and that nearly half of the rest occurred in former smokers.
Where the 21,000 comes from
The EPA’s estimate of about 21,000 radon-related lung cancer deaths a year in the United States is the figure quoted most often, and it is worth knowing what kind of number it is. Nobody counted those deaths. Death certificates do not record radon as a cause, and the disease looks the same whatever started it. The figure comes from applying a risk model, derived mainly from the miner studies through the BEIR VI report, to estimates of how much radon Americans breathe and how many of them smoke.
The agency publishes an uncertainty range alongside it: 8,000 to 45,000 deaths a year. The range is wide because every input is uncertain, from the shape of the risk model to the spread of radon across tens of millions of homes. The EPA also estimates that about 2,900 of the deaths occur in people who have never smoked. Similar exercises elsewhere give similar shares: about 3.3% of lung cancer deaths in the UK, roughly 1,100 a year, and about 9% in Europe as a whole.
The 21,000: a central estimate with a wide range
EPA’s modelled estimate of US lung cancer deaths a year related to radon in homes.
Source: US EPA, Health Risk of Radon, based on the EPA’s 2003 assessment and the BEIR VI report (1999). Modelling, not a count of death certificates.
None of this makes the estimate wrong. The household studies broadly confirm the miner-based slope. But “21,000 deaths” is best read as a modelled central estimate with honest error bars, most of it borne by people who also smoked.
Action levels, and who is above them
Thresholds differ. The EPA recommends fixing a home at or above 4 pCi/L, which is 148 Bq/m3. The WHO recommends a national reference level of 100 Bq/m3, and no more than 300 where 100 cannot be reached. The UK uses 200 Bq/m3. None is a safe line: risk rose from zero in the pooled studies, and a UK analysis estimated that more than 85% of radon-related deaths there come from concentrations below 100 Bq/m3, because so many more people live at those levels.
The best US figure for homes above the line is old. The National Residential Radon Survey placed year-long detectors in about 7,100 homes and reported a mean of 46 Bq/m3, with 6% above 150 Bq/m3. The EPA still describes this as nearly one home in 15, a figure extrapolated from that survey rather than freshly measured.
Average home radon and reference levels
Survey averages are arithmetic means of indoor radon in homes.
| Place | Average in homes | Reference or action level | Note |
|---|---|---|---|
| United States | 46 Bq/m3 | 148 Bq/m3 (4 pCi/L) | About 6% of homes above 150 |
| United Kingdom | 21 Bq/m3 | 200 Bq/m3 | About 1,100 deaths a year |
| South Korea | 62 Bq/m3 | 148 Bq/m3 (new apartments) | Detached houses higher than apartments |
| Japan | 14 Bq/m3 | – | About 0.1% of homes above 100 |
| WHO guidance | – | 100 Bq/m3 (at most 300) | For national policy |
Sources: Marcinowski F, Radiation Protection Dosimetry (1992), doi:10.1093/oxfordjournals.rpd.a081573; Gray A et al., BMJ 338:a3110 (2009); Kim YH et al., Radiation Protection Dosimetry (2011), doi:10.1093/rpd/ncr094; Korea Ministry of Government Legislation (2019); Suzuki G et al., Journal of Radiation Research (2010), doi:10.1269/jrr.10083; WHO fact sheet (2023).
East Asia shows how much geology and building type matter. Japan’s survey of 3,461 homes in 2007–2010 found an average of 14.3 Bq/m3. South Korean surveys of about 5,600 dwellings found 62.1, and a 2018 study put detached houses at 116.4 and apartments at 55.9, attributing 1,039 lung cancer deaths in one year to residential radon. Since July 2019, Korea has applied a recommended level of 148 Bq/m3 to newly approved apartment blocks, down from 200.
Korea also had a very public radon scare. In 2018 a homemaker with a consumer radon detector found high readings from a Daejin Bed mattress. The mattresses contained monazite, a thorium-rich mineral. Thoron levels were about ten times radon levels, and many mattresses gave doses above Korea’s 1 mSv annual limit for processed products. A 2019 review concluded that no acute effects were expected but that a long-term lung cancer risk could not be ruled out.
What a test result really tells you
A radon number is an estimate of a long-term average, and radon moves around. In a large US dataset, winter readings averaged about 60% higher than summer ones and basements about 2.5 times higher than upper floors. The EPA notes that short-term tests take a few minutes to set up and give results within days, and suggests the basement or ground floor as a good place to start. Long-term tests, running for months, come closer to the annual average that risk estimates use.
How well does a short test predict the year? In an Iowa study, winter basement tests of 7 to 10 days, placed by trained staff, correctly identified homes whose annual basement average exceeded 148 Bq/m3 88% of the time. An earlier analysis of 1,449 houses with both two-day and one-year measurements found that, under the EPA’s short-test sequence, the chance of a wrong decision about fixing a home ranged from 1% to more than 50%.
Noise matters for the research too. In the European analysis, homes measured above 800 Bq/m3 had a mean reading of 1,204 but an estimated usual level of only 678, because extreme single readings tend to overstate the long-term average. Correcting for that roughly doubled the estimated risk per unit of radon, which is why the 16% is higher than the 8.4% actually observed.
Fixing a high reading
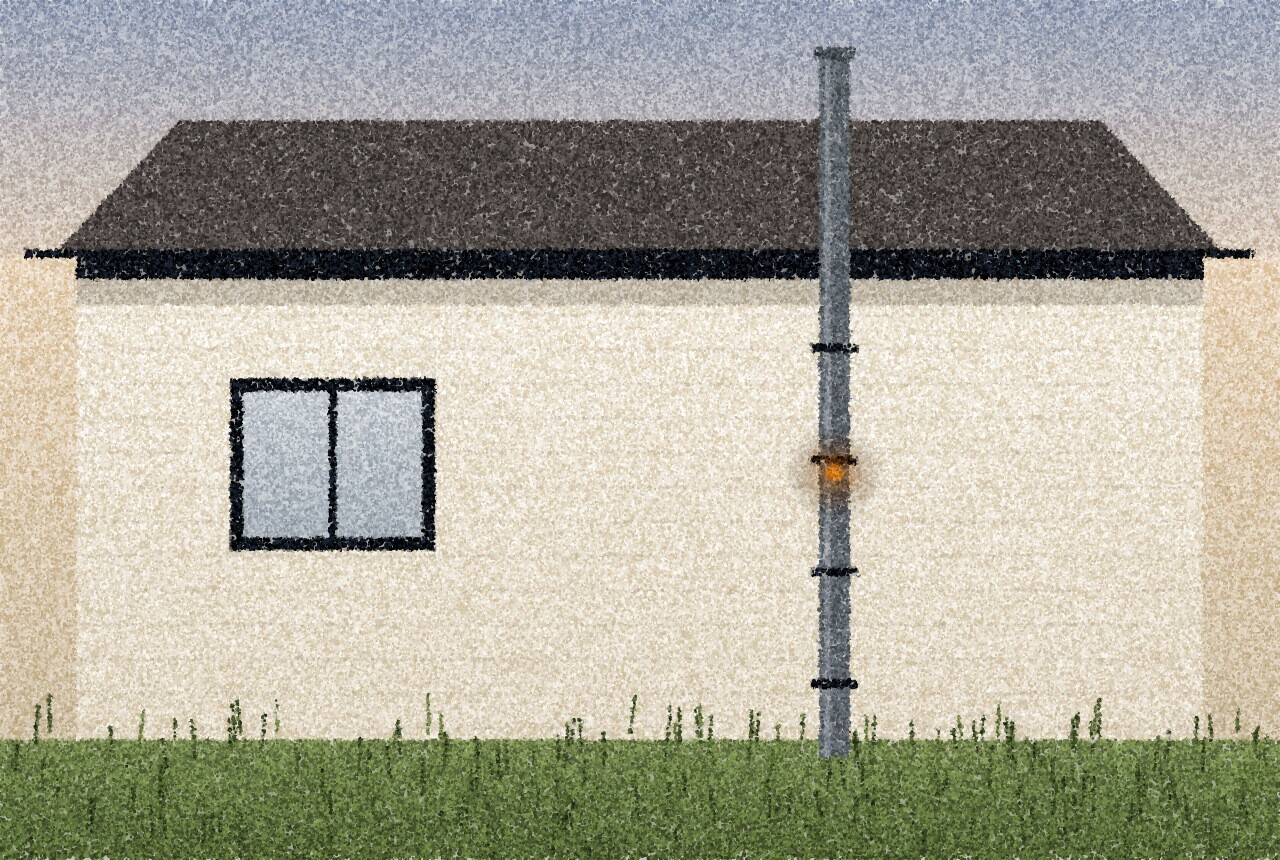
The standard fix in houses with a concrete floor is sub-slab depressurisation: a pipe draws air from beneath the slab and a small fan vents it outside, so the house stops pulling soil gas in. The EPA says some systems can reduce radon by up to 99%. The WHO notes that passive measures, without a fan, can cut indoor radon by more than 50%.
Field studies support large reductions. In 170 UK homes remediated with a sump and fan, every house ended below the UK action level of 200 Bq/m3, and more than three quarters kept less than a fifth of their original radon. Homes that started lower saw smaller proportional falls.
How well radon fixes work, and how they fail
Results from two follow-up studies of active soil depressurisation.
Sources: Groves-Kirkby CJ et al., Environment International 34(3):428–436 (2008); Scott AG, Robertson AL, US EPA report on 40 Pennsylvania houses (1990).
Systems need checking. An EPA follow-up of houses fitted two to four years earlier found that, of the 28 where the system ran all year, 22 were below 4 pCi/L. Performance had not degraded except where fans had failed, six of 34 so far, or owners had switched systems off. Retesting is the only way to know a system still works.
Is it worth the money?
Because the absolute risk depends so much on who lives in a house, cost-effectiveness studies reach mixed conclusions. A 1999 US analysis estimated that universal screening and mitigation at 4 pCi/L would cost about $3 million per lung cancer death prevented, or $480,000 per life-year saved.
A 2009 UK analysis in the BMJ, by Alastair Gray, Sarah Darby and colleagues, compared policies directly. Building basic radon protection into all new homes, at around £100 a house, cost an estimated £11,400 per quality-adjusted life year (QALY) across the UK, well within what the NHS usually pays. Finding and fixing existing homes cost £36,829 per QALY under the policy then in force, partly because only about 30% of invited households measured and about 20% of those advised to remediate did so.
Who benefits most from fixing radon
Estimated cost per quality-adjusted life year (QALY) gained, United Kingdom.
| Policy | Who lives in the home | Cost per QALY |
|---|---|---|
| Basic protection in all new homes | General population | £11,400 |
| Test and fix existing homes (policy then in force) | General population | £36,829 |
| Test and fix existing homes (100 Bq/m3 action level) | Current smokers only | under £14,000 |
| Test and fix existing homes (100 Bq/m3 action level) | Never-smokers only | over £173,000 |
Source: Gray A et al., BMJ 338:a3110 (2009). The UK often treats £20,000–£30,000 per QALY as the limit of good value. Results are sensitive to the assumed risk and discount rates.
Remediating an existing home was likely to be highly cost-effective for current smokers and very poor value for households of never-smokers. That does not mean a never-smoker should ignore a very high reading; one home at 800 Bq/m3 is not a national programme. It does mean the biggest public-health returns come from new-build standards and from stopping smoking.
Questions people ask
Does radon at home cause lung cancer?
Yes. Pooled studies of people in ordinary homes found risk rising with long-term radon: 8.4% per 100 Bq/m3 as measured, 16% after correcting for measurement error.
Is radon dangerous if I have never smoked?
The risk is real but small in absolute terms. In the European model, risk by 75 rose from 0.41% to 0.67% between zero and 400 Bq/m3.
What radon level is safe?
No level is risk-free in the models. The EPA recommends fixing homes at 4 pCi/L (148 Bq/m3) or more; the WHO suggests 100 Bq/m3.
Is a short-term radon test enough?
It is a reasonable first step. Results near the action level are less certain, and a longer test comes closer to the annual average.
How well does radon mitigation work?
Sub-slab depressurisation usually cuts radon sharply; the EPA says by up to 99%. Fans can fail, so retesting matters.
The short version
- Pooling 13 European studies, lung cancer risk rose 8.4% per 100 Bq/m3 of measured radon, or 16% after correcting for measurement error. North American studies gave 11%.
- For a lifelong non-smoker, modelled risk of lung cancer by 75 moves from 0.41% to 0.67% between zero and 400 Bq/m3. For a smoker, it moves from 10.1% to 16.0%.
- The EPA’s 21,000 US deaths a year is a model, with a range of 8,000 to 45,000. About 2,900 are in people who never smoked.
- About one US home in 15 is estimated to be at or above the 4 pCi/L (148 Bq/m3) action level. The WHO suggests 100 Bq/m3.
- Sub-slab depressurisation usually cuts radon sharply, but fans fail and short tests can mislead. Protecting new homes looks cost-effective; fixing existing homes pays off mainly for smokers.
This article summarises published research and public-health guidance for general information. It is not medical advice. If you are worried about lung cancer, have symptoms such as a persistent cough, or want help to stop smoking, contact a doctor. Your national or local radiation or environmental health agency can advise on testing a particular home.
Further reading: Darby et al., BMJ 330(7485) (2005), for the European pooled analysis. Gray et al., BMJ 338:a3110 (2009), for the cost-effectiveness of radon policies. The EPA’s Health Risk of Radon page and the WHO radon fact sheet, for the official figures.
- The Art of Uncertainty, David Spiegelhalter (2024). A statistician on chance, risk and the limits of what we know. Useful for reading modelled estimates with wide ranges, such as the radon death toll; it is about risk in general, not radon.
- The Cigarette: A Political History, Sarah Milov (2019). A historian traces how American tobacco policy was fought over. Relevant because smoking drives most radon lung cancers; it is a political history rather than a health guide.
- Clearing the Air, Tim Smedley (2019). A journalist investigates air pollution and what has reduced it. Good context on risks we breathe but cannot see; its focus is air pollution broadly, not radon.
Sources
Darby S et al. BMJ 330(7485):223 (2005), doi:10.1136/bmj.38308.477650.63. — Krewski D et al. Epidemiology 16(2):137–145 (2005), doi:10.1097/01.ede.0000152522.80261.e3. — Turner MC et al. Cancer Epidemiology, Biomarkers & Prevention 20(3):438 (2011). — Lubin JH, Boice JD. Journal of the National Cancer Institute 89(1):49 (1997), doi:10.1093/jnci/89.1.49. — Lantz PM, Méndez D, Philbert MA. American Journal of Public Health (2013), doi:10.2105/AJPH.2012.300926. — Gray A, Read S, McGale P, Darby S. BMJ 338:a3110 (2009). — US EPA, Health Risk of Radon (accessed October 2026). — US EPA, Radon in Homes, Schools and Buildings, RadTown (accessed October 2026). — US EPA, Report on the Environment indicator: U.S. Homes At or Above EPA’s Radon Action Level. — World Health Organization, Radon and health, fact sheet (25 January 2023). — Marcinowski F. Radiation Protection Dosimetry (1992), doi:10.1093/oxfordjournals.rpd.a081573. — Suzuki G et al. Journal of Radiation Research (2010), doi:10.1269/jrr.10083. — Kim YH et al. Radiation Protection Dosimetry (2011), doi:10.1093/rpd/ncr094. — Kim JH, Ha M. Journal of Korean Medical Science 33(29):e223 (2018), doi:10.3346/jkms.2018.33.e223. — Ministry of Government Legislation (Korea), interpretation of the radon recommended level for new apartments under the Indoor Air Quality Control Act. — Seo S et al. Epidemiology and Health 41:e2019004 (2019). — Cohen BL, Gromicko N. JAPCA (1988), doi:10.1080/08940630.1988.10466359. — Barros N, Steck DJ, Field RW. Health Physics (2014), doi:10.1097/HP.0000000000000004. — White SB. Health Physics (1994), doi:10.1097/00004032-199408000-00010. — Groves-Kirkby CJ et al. Environment International 34(3):428–436 (2008), doi:10.1016/j.envint.2007.09.012. — Scott AG, Robertson AL. US EPA report, follow-up alpha-track monitoring in 40 eastern Pennsylvania houses with radon reduction systems (1990). — Ford ES et al. American Journal of Public Health 89(3):351 (1999), doi:10.2105/ajph.89.3.351. — Seoul Economic Daily, radon-tainted beds and recall rates (1 October 2026).