Cycling injuries, helmets, and the trade the numbers show
Key takeaways · 10 min read
- Cycling to work raised the risk of a first injury admission by 45% in 230,390 UK commuters; walking did not raise it at all.
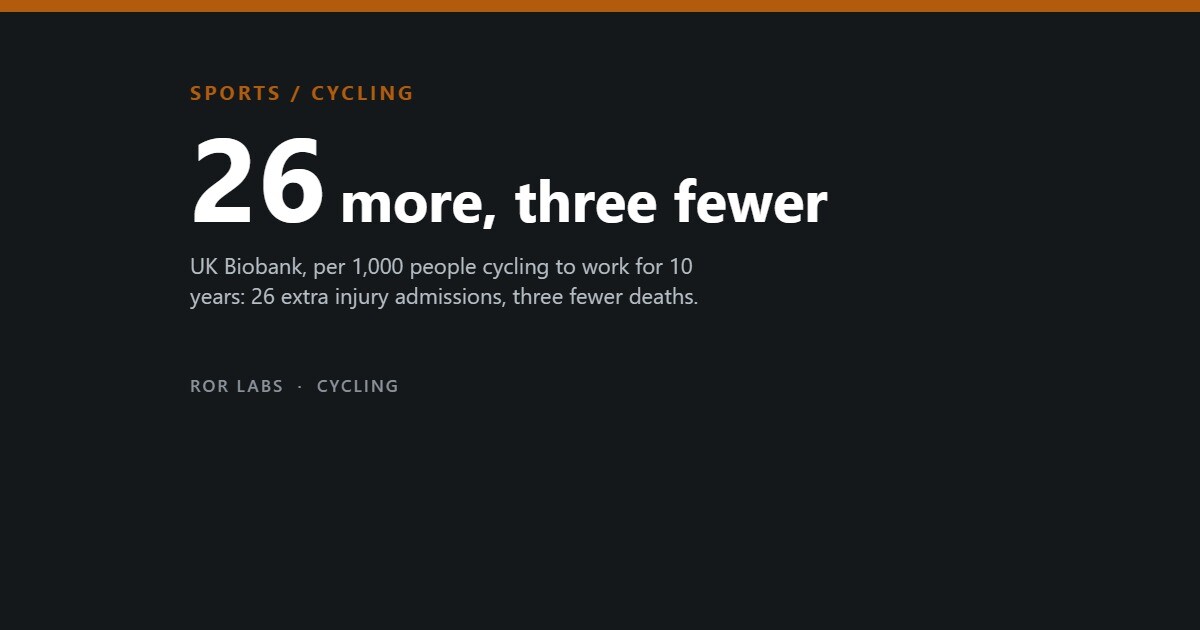
- The same authors priced the trade: per 1,000 people cycling for 10 years, 26 more injury admissions against 15 fewer cancers, four fewer cardiovascular events and three fewer deaths.
- Helmets cut the odds of serious head injury to 0.31 among cyclists who crashed — and do nothing about crashing, or about limbs.
- Risk concentrates at junctions, on main roads and in bus lanes. Painted cycle lanes raised injury odds by 54% in one national study.
When researchers followed 230,390 British commuters for nearly nine years, they found that the ones who cycled to work were admitted to hospital for injuries more often than the ones who drove or took the train. Then they did something unusual: they converted the finding into a number a person could weigh.
Per 1,000 people who take up cycling to work and keep it up for ten years, they estimated 26 additional hospital admissions for a first injury — and 15 fewer first cancer diagnoses, four fewer cardiovascular events, and three fewer deaths. That is the trade, stated by the people who found the harm, in the same paper.
This article is about what sits inside those two columns: what injures cyclists, where the risk concentrates, what has been measured to reduce it, and which part of the answer is still genuinely unsettled. That last part is more unsettled than a decade of cycling advocacy suggests.
What actually gets injured
The study, published in The BMJ in 2020, used the UK Biobank cohort. Of 230,390 commuters, 5,704 — about one in forty — named cycling as their main way to work. Over a median 8.9 years, 7.0 per cent of them had a first injury admission, against 4.3 per cent of those who commuted by car or public transport.
Hospital admission for a first injury, by how people commuted
UK Biobank, 230,390 commuters, median follow-up 8.9 years. Hazard ratios adjusted for sociodemographic, health and lifestyle factors, against non-active commuting.
Source: Welsh et al., BMJ 368:m336 (2020). Cycling 1.45 (1.30 to 1.61); mixed mode 1.39 (1.29 to 1.50).
The adjusted hazard ratio for people who cycled and nothing else was 1.45, interval 1.30 to 1.61; mixed-mode cyclists 1.39. Walkers showed no increase at all — worth noting before anyone concludes that active travel as a category is the risky thing. It is not. Cycling is.
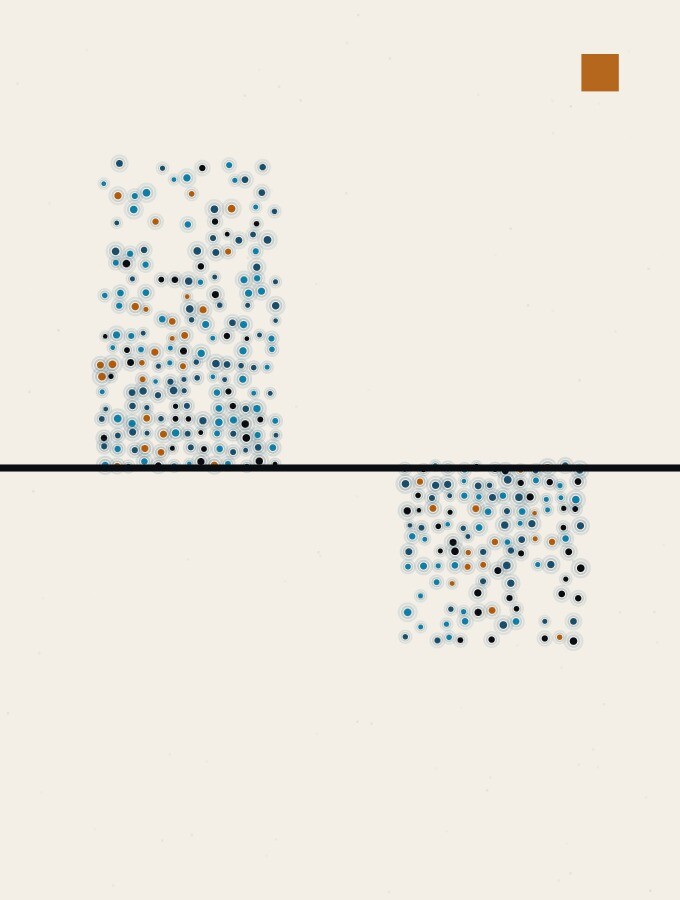
Narrow the outcome to injuries coded as transport incidents and the gap widens sharply: a 3.4-fold higher risk. The association was also stronger for head or neck injuries and for fractures than for injuries generally. That is the shape of it — not more illness, not more falls at home, but more collisions and more broken bones.
Head injury deserves its own line. In England between 2007 and 2012 it was the main cause of death for 269 cyclists killed while travelling — 46 per cent of cyclist road deaths, the commonest single cause, and the honest case for a helmet. The same analysis put it at 42 per cent of pedestrian deaths and 25 per cent of driver deaths. The cyclist figure is the highest, but it is not in a different category from walking, and nobody proposes helmets for pedestrians.
Where the risk concentrates
The most useful work on this uses a case-crossover design: take the place where a cyclist was injured, compare it against other points on routes that cyclists actually ride, and you control for exposure without needing to know how far anyone travelled. A 2021 study applied it to 3,341 injured commuter cyclists across Britain using 2017 data.
What raised the odds of being injured, per site
Case-crossover study of 3,341 injured morning-peak commuter cyclists in Britain, 2017. Injury sites compared with control sites on modelled cyclist routes.
Source: Aldred, Kapousizis and Goodman, Int J Environ Res Public Health 18(6):3060 (2021).
Main roads carried twice the injury odds of residential streets. Roundabouts, standard and mini alike, came out several times higher than other junction types. A London study by two of the same researchers put junctions at roughly three times the odds of non-junction locations. The pattern is consistent across both: the danger is not spread evenly along a ride, it is bunched at the places where traffic has to cross itself.
Both studies also found safety in numbers: where there are more cyclists, each one is safer. It is not a slogan here — it survives adjustment for exposure in study after study.
What the helmet evidence actually says
The best summary is a 2016 meta-analysis in the International Journal of Epidemiology covering 40 studies and more than 64,000 injured cyclists. It stratified by injury type and severity rather than pooling everything into one number, which is what makes it useful.
Odds of injury for helmeted cyclists, among cyclists who crashed
Meta-analysis of 40 studies, more than 64,000 injured cyclists. Below 1.00 means the helmeted group had lower odds.
Source: Olivier and Creighton, International Journal of Epidemiology (2016). Head 0.49 (0.42–0.57); serious head 0.31 (0.25–0.37); face 0.67 (0.56–0.81); fatal head 0.35 (0.14–0.88).

Those are large effects and the direction is not in doubt. Be precise about what they are effects on. Every study in that meta-analysis compares cyclists who had already crashed. A helmet changes what a crash does to a head. It does nothing about whether the crash happens, and nothing for the arms, the collarbone and the hip, where most cycling injuries land.
There has never been a randomised trial of bicycle helmets, and there is not going to be one. The evidence base is entirely case-control and cohort work, which carries the usual worry: people who choose helmets may differ from those who do not.
One older result is worth carrying because of how it aged. A 2001 meta-analysis found 0.40 for head injury and 0.27 for fatal injury, in line with the later work — but also 1.36 for neck injury, running from 1.00 to 1.86, which pointed the wrong way. The authors flagged that it might not hold for the lighter helmets then arriving. They were right: by the 2016 pooling and a 2020 meta-analysis of 55 studies the neck signal is gone, 0.98 with an interval of 0.82 to 1.17.
The infrastructure evidence contradicts itself
Here is where this article has to be more honest than the advocacy. In 2020 a case-crossover study of London found protected cycle infrastructure cut the odds of injury by 40 to 65 per cent in the morning commute, while advisory lanes — the painted kind — raised them by 34 per cent. That is the result that gets quoted.
In 2021, the same lead researcher applied the same method to Britain as a whole, using data from the same year, and did not find a protective effect from cycle infrastructure at all. Painted cycle lanes raised the injury odds by 54 per cent. Off-road tracks on their own showed nothing significant.
Two case-crossover studies, same method, different answers
Effect on the odds of a cyclist injury at a site, against no infrastructure.
Protected cycle infrastructure
40 to 65% lower odds
Advisory (painted) lanes: +34%
Cycle infrastructure overall
No protective effect found
Painted cycle lanes: +54%
Sources: Adams and Aldred, Findings (2020); Aldred, Kapousizis and Goodman, Int J Environ Res Public Health 18(6):3060 (2021).
The authors offer an explanation rather than a retraction, and a plausible one: most of what was on the ground across Britain in 2017 was not good infrastructure. London had been building to a better standard for years, and England issued its current design guidance, LTN 1/20, only afterwards. That may well be right. It is also the kind of after-the-fact sorting that should make a reader cautious, because as stated it is unfalsifiable — any facility that fails can be reclassified as a bad facility. The defensible summary is narrower than the campaign version: separation from traffic, done properly, looks protective; paint does not, and may be worse than nothing.
The e-bike numbers go both ways
Electric bikes are the live question, and the recent literature shows why raw counts mislead. A London emergency department reviewed 5,529 cycling-related visits from September 2022 to August 2025. E-bikes accounted for 564, and their share rose from 3.8 per cent in the first year to 16.0 in the third.
German trauma registry data from 2020 to 2023, covering 9,170 severely injured cyclists, found e-bike riders were older — a median of 63 against 57 — and more often had polytrauma (16.7 against 12.3 per cent) and head injuries (67.2 against 56.2). Read those two together and the conclusion writes itself: e-bikes are more dangerous.
The same question, counted two ways
E-bike injuries against conventional bicycle injuries.
Sources: Siswick et al., J Emerg Med (2026); Özman et al., Patient Saf Surg (2026); Verbeek et al., Emerg Med J (2021); Fyhri, Bjørnskau and Siverts, Findings (2026).
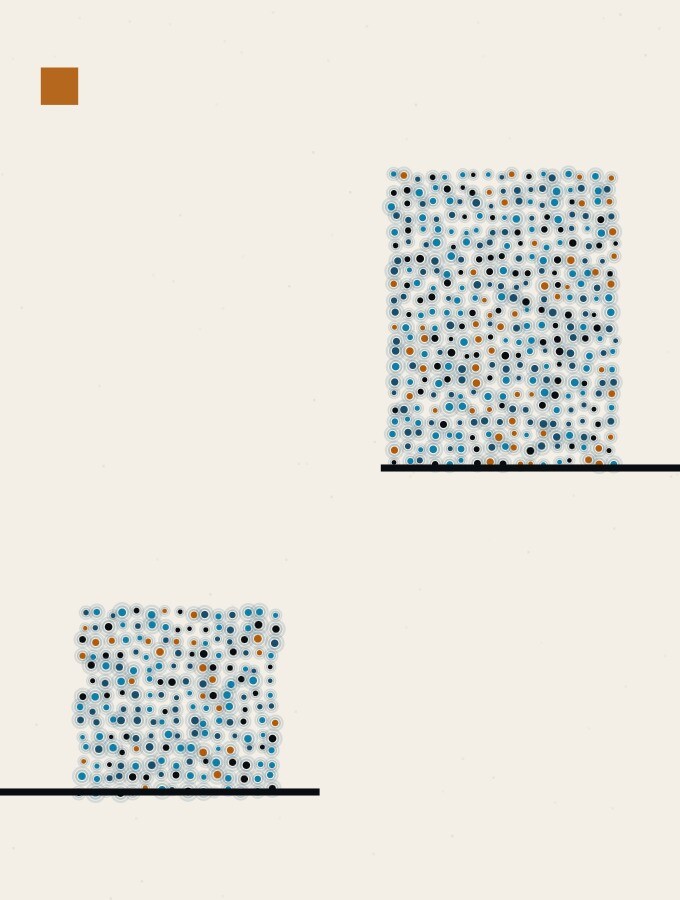
Except that a Norwegian study of 1,585 treated cyclist injuries in Oslo in 2023 divided them by distance travelled, using national travel-survey exposure data, and found injury risk was lower for e-bikes than for conventional bicycles. And a prospective Dutch study of 834 emergency patients found no significant difference in the frequency of traumatic brain injury between e-bike and classic bicycle riders: 15 per cent against 16, with a p-value of 0.61.
The two sets of findings are not in conflict once you see what each counts. Trauma registries count the severely injured, and e-bike riders are older, which by itself predicts worse outcomes from the same impact. Exposure-adjusted studies count injuries against kilometres, and e-bikes cover more kilometres per rider. Both are real; only one answers the question a rider is asking.
Why the answer is not to stop
The Scottish Longitudinal Study followed 82,297 people from the 2001 census through to 2018, linked to hospital, death and prescription records. Compared with non-active commuting, cycling to work was associated with an all-cause mortality hazard ratio of 0.53, with a confidence interval from 0.38 to 0.73.
It also found a lower risk of any hospitalisation among cyclist commuters — 0.90, interval 0.84 to 0.97 — which is the counterweight to the injury finding at the top of this article. Over eighteen years the people who rode to work ended up in hospital slightly less often, not more, once every cause was counted together. Both halves are observational, and the same objection applies to both: people who take up cycling may already be healthier. The Glasgow authors say so themselves.
What is not in dispute is where the modifiable risk sits. It is not mainly in the rider. It is in the junction, the main road, the bus lane and the painted strip that puts a cyclist in the door zone. A helmet is a cheap, well-evidenced precaution against one category of harm. It is not a road safety policy, and treating it as one has let a good deal of bad infrastructure go unexamined.
Questions people ask
Does a helmet make me less likely to crash?
No. Every study behind the helmet numbers starts from cyclists who had already crashed. The measured effect is on what the crash does to the head — large for serious head injury, absent for the neck, and irrelevant to the limb injuries that make up most of the count.
Should helmets be compulsory?
A policy question this article does not answer. New South Wales hospital data showed a drop in cyclist head injuries when its law took effect. Critics counter that enforced laws suppress cycling, and that the two published cost-benefit analyses found the cost of the helmets exceeded the savings.
Is an e-bike more dangerous than a normal bike?
Per injured rider in a trauma registry, e-bike injuries are more severe, largely because e-bike riders are older. Per kilometre travelled, one national study found the risk lower. Speed and rider age matter more than the motor.
The short version
- Cycling to work raised the risk of a first injury admission by 45% in 230,390 UK commuters; walking did not raise it at all.
- The same authors priced the trade: per 1,000 people cycling for 10 years, 26 more injury admissions against 15 fewer cancers, four fewer cardiovascular events and three fewer deaths.
- Helmets cut the odds of serious head injury to 0.31 among cyclists who crashed — and do nothing about crashing, or about limbs.
- Risk concentrates at junctions, on main roads and in bus lanes. Painted cycle lanes raised injury odds by 54% in one national study.
- Two case-crossover studies by overlapping teams disagree about whether cycle infrastructure protects. That disagreement is the current state of the evidence.
- E-bike injuries look worse in trauma registries and no worse once distance travelled is accounted for.
This is a summary of published research, not personal safety advice. Injury risk depends on where you ride, how far and in what traffic, and none of these studies can tell you about your own route. If you have a condition affecting balance, vision or cardiovascular fitness, discuss taking up cycling with a doctor first.
Further reading: Welsh et al., BMJ 368:m336 (2020), for the injury estimate and the authors’ own arithmetic on the trade. Olivier and Creighton, International Journal of Epidemiology (2016), for the helmet meta-analysis stratified by injury type. Aldred, Kapousizis and Goodman, Int J Environ Res Public Health 18(6):3060 (2021), for the national infrastructure result that did not replicate London.
- Two Wheels Good, Jody Rosen (2022). A history of the bicycle and the arguments that have followed it around for 150 years. Affectionate rather than analytical, and openly so.
- Killed by a Traffic Engineer, Wes Marshall (2024). On how little of standard road design rests on evidence. Written by an engineer about his own profession, which is both its strength and its bias.
- How to Talk to a Science Denier, Lee McIntyre (2021). Useful here for the opposite reason to the title: it is a good guide to when a disputed literature is genuinely unsettled rather than merely contested.
Sources
Welsh C, Celis-Morales CA, Ho FK, et al. Association of injury related hospital admissions with commuting by bicycle in the UK. BMJ 368:m336 (2020) — hazard ratios 1.45 and 1.39, 3.4-fold for transport incidents, and the per-1,000 estimate of 26 admissions against 15 cancers, four cardiovascular events and three deaths. — Olivier J, Creighton P. Bicycle injuries and helmet use: a systematic review and meta-analysis. International Journal of Epidemiology (2016), doi:10.1093/ije/dyw153; 40 studies, over 64,000 injured cyclists. — Attewell RG, Glase K, McFadden M. Bicycle helmet efficacy: a meta-analysis. Accident Analysis and Prevention (2001), for the earlier estimates including the neck result. — Aldred R, Kapousizis G, Goodman A. Int J Environ Res Public Health 18(6):3060 (2021). — Adams T, Aldred R. Findings (2020), doi:10.32866/001c.18226. — Martin A, Lloyd M, Sargent G, Feleke R, Mindell JS, on head injury as a cause of road travel death in England, 2007–2012. — Friel C, Walsh D, Whyte B, et al. BMJ Public Health 2(1):e001295 (2024). — Siswick J, et al. Journal of Emergency Medicine (2026). — Özman DD, et al. Patient Safety in Surgery (2026). — Fyhri A, Bjørnskau T, Siverts H. Findings (2026). — Verbeek AJM, et al. Emergency Medicine Journal (2021). — Walter SR, Olivier J, Churches T, Grzebieta R. Accident Analysis and Prevention (2011); Robinson DL. Accident Analysis and Prevention (2006).