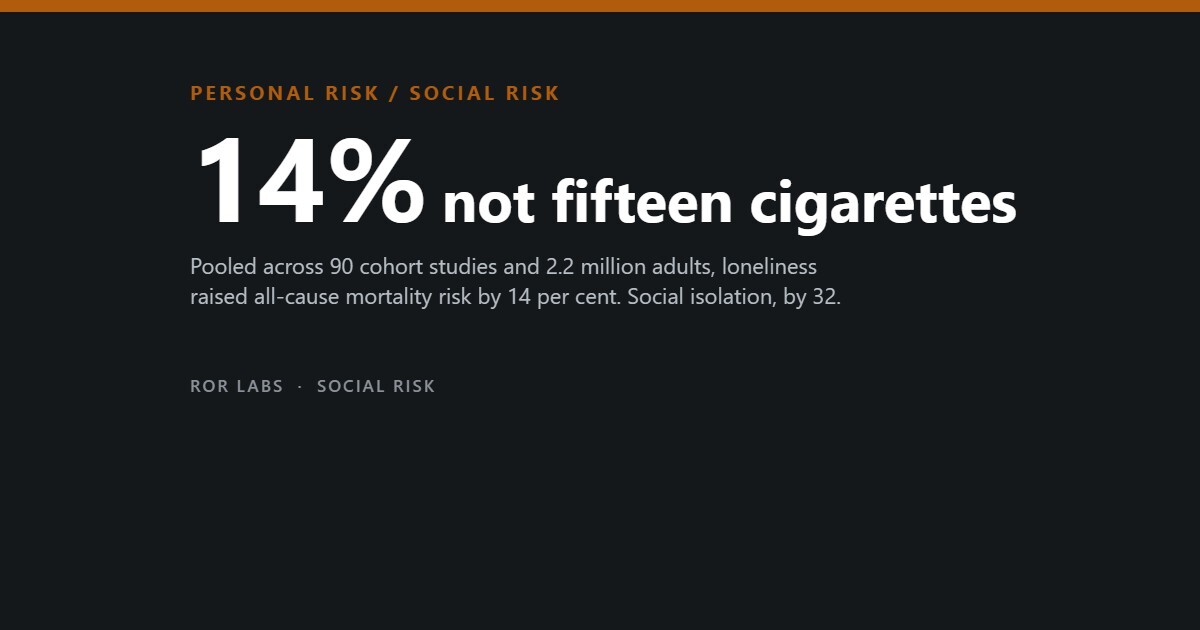
Loneliness Raises the Risk of Dying by Fourteen Per Cent. The Fifteen-Cigarettes Line Came From Somewhere Else.
In This Series: Healthy Ageing & Everyday Myths
- Two of the 14 Dementia Risk Factors Are Your Ears and Your Eyes
- The Wrong Cuff Turns 125 Into 144. Most People Have Never Had This Measured Properly.
- Every 3 Decibels Halves the Time. That Is the Whole Rule, and Almost Nobody Knows It.
- Sleep Regularity Beat Sleep Duration: What the Mortality Data Shows
- Sitting Is Not the New Smoking. The Standing Desk Did Not Help Either.
- Falls at Home: The Fixes With Evidence, and the One That Was Withdrawn
Key takeaways · 18 min read
- The famous 50 per cent figure is an average across measures that disagree. Composite social integration gave 1.91; living alone gave 1.19 and did not reach significance.
- “Fifteen cigarettes a day” is a media translation of a comparison of effect sizes. The same paper equally supported a comparison to more than six drinks a day.
- Isolation and loneliness are different exposures. Across 90 cohorts and 2.2 million adults: isolation 1.32, loneliness 1.14, both together 1.18 — lower than isolation alone.
- Every methodological improvement shrinks the estimate: validated scales, longer follow-up, higher study quality, adjustment for income or cognition.
In this article
- Where the fifteen cigarettes came from
- Isolation and loneliness are different variables and behave differently
- The estimate shrinks every time the study gets better
- How confident is the field in its own numbers
- Is loneliness actually increasing?
- Association, or cause?
- Where the deaths actually are
- Can anything be done about it?
- Questions people ask
- The short version
- Sources
In 2023 the South Korean government counted 3,661 people who died alone at home and were not found for some time afterwards. The category has a name in Korean — godoksa, lonely death — and a statistical definition: a person living alone, cut off from family, relatives, friends and neighbours, who died by suicide, illness or any other cause. The count has risen every year the ministry has published it, from 2,949 in 2019. It is a little under one per cent of all deaths in the country.
The striking part is not the total. It is who is in it. Men were 84.1 per cent of the 2023 cases. Men in their fifties and sixties alone were 53.9 per cent — more than half of every lonely death in the country, drawn from a single decade-and-a-half band of one sex. That is not the picture the phrase usually calls to mind, and it is not the picture the global campaign against loneliness has been built around.
The campaign has its own number. In June 2025 the World Health Organization’s Commission on Social Connection reported that one in six people worldwide are lonely and that loneliness and social isolation are linked to more than 871,000 deaths a year — about a hundred an hour. Beneath that sits a research literature that is genuinely large, genuinely consistent in direction, and much weaker in the specifics than the headline suggests. This article is about what the numbers measure, where they shrink, and which part of the finding is solid enough to act on.
Where the fifteen cigarettes came from
Almost every article you have read on this subject traces back, through however many intermediaries, to one paper: Julianne Holt-Lunstad, Timothy Smith and Bradley Layton’s 2010 meta-analysis in PLoS Medicine. It pooled 148 prospective studies covering 308,849 people, average age 63.9 at first assessment, followed for an average of 7.5 years. People with stronger social relationships had 1.50 times the odds of still being alive at follow-up — a 50 per cent increase in the odds of survival, with a confidence interval of 1.42 to 1.59.
The paper then compared that effect size to other established mortality risk factors and observed that it was of comparable magnitude to smoking. Somewhere between the paper and the press release, “comparable in magnitude to smoking” became “equivalent to fifteen cigarettes a day”, and that phrasing has been in circulation ever since. The comparison is not fabricated. But the same analysis put the effect in the same range as consuming more than six alcoholic drinks a day, and greater than physical inactivity or obesity — and nobody quotes those, because they do not land the same way.
The more useful thing in that paper is buried in its tables. The 1.50 is an average across wildly different ways of measuring social connection, and the measures do not agree with each other.
The same meta-analysis, split by what was actually measured
Odds of survival at follow-up, people with better social relationships versus worse, by type of measure. Holt-Lunstad et al., 2010, 148 studies.
Bars scaled from 1.00 to 2.00. Loneliness rested on 8 studies, social isolation on 8, living alone on 17, perceived support on 73. The living-alone estimate had a confidence interval of 0.99 to 1.44 — it did not reach significance. Complex integration indices rested on 30 studies and combined several measures at once.
Read that chart from the bottom and the story changes. Living alone, the single measure a government can count from a census, was the weakest predictor in the paper and its confidence interval touched 1.00. The strongest was a composite index built from several different questions at once. Whatever social connection is doing to mortality, it is not doing it through household size.
Isolation and loneliness are different variables and behave differently
The two words get used interchangeably in coverage and they mean different things in the research. Social isolation is structural: how many people you actually see, how often, whether you belong to anything. Loneliness is subjective: the gap between the relationships you have and the ones you want. They overlap only partly. You can be surrounded and lonely, or solitary and content.
The largest synthesis to date separated them. Fan Wang and colleagues, in Nature Human Behaviour in 2023, pooled 90 prospective cohort studies covering 2,205,199 adults. Social isolation was associated with a 32 per cent higher risk of death from any cause. Loneliness was associated with 14 per cent. Both were statistically significant. They were not the same size.
Two different exposures, two different numbers
Pooled hazard ratios for all-cause mortality in the general adult population. Wang et al., 2023, 90 cohorts, 2.2 million adults.
Wang, F. et al., “A systematic review and meta-analysis of 90 cohort studies of social isolation, loneliness and mortality”, Nature Human Behaviour, 2023. Heterogeneity was substantial throughout: I² = 77.8% for isolation, 91.1% for loneliness.
That third box is the one worth sitting with. If loneliness and isolation were two doses of the same poison, having both should be worse than having one. In the five studies that measured the combination, it was not. The authors’ own reading was that structural isolation is doing most of the work, and that people who feel lonely but still have a network around them may be buffered by that network even while they are unhappy inside it. Their explicit recommendation was that socially isolated people, not lonely people, should be the priority.
The estimate shrinks every time the study gets better
A separate 2025 meta-analysis by Anastasia Nakou and colleagues in Aging Clinical and Experimental Research restricted itself to older adults and pooled 86 studies. Its headline figures were close to Wang’s: loneliness 1.14, social isolation 1.35, living alone 1.21. What makes it more useful than the headline is that it published its subgroups. And in the subgroups, a pattern shows up that anyone who reads epidemiology will recognise immediately.
What happens to the risk estimate as the method improves
Subgroup hazard ratios for all-cause mortality, from the same pooled dataset. Nakou et al., 2025, 86 studies.
| Exposure | Weaker method | Stronger method |
|---|---|---|
| Loneliness — measurement | Single-item question 1.18 | Validated loneliness scale 1.10 |
| Loneliness — follow-up | Under 5 years 1.22 | 5 years or more 1.10 |
| Loneliness — adjustment | Cognitive function not adjusted 1.16 | Cognitive function adjusted 1.08 |
| Isolation — study quality | Newcastle-Ottawa ≤6 1.81 | Newcastle-Ottawa ≥7 1.31 |
| Isolation — follow-up | Under 5 years 1.46 | 5 years or more 1.31 |
| Living alone — adjustment | Income not adjusted 1.26 | Income adjusted 1.11 |
Nakou, A. et al., Aging Clinical and Experimental Research, 2025. Every contrast in this table was tested for subgroup difference; the loneliness follow-up, isolation quality, isolation follow-up and living-alone income contrasts were significant at p ≤ 0.05.
Every row moves in the same direction. Better instruments give smaller effects. Longer follow-up gives smaller effects. Adjusting for the confounders that plausibly cause both the isolation and the death — poor cognition, low income — gives smaller effects. Higher-quality studies give smaller effects.
That pattern does not mean the association is fake. Short follow-up picking up larger effects is exactly what you would expect if some of the isolated people were already sick and dying, which is reverse causation, and the fact that the effect survives at five years and beyond is meaningful. But it does mean the honest central estimate for loneliness is nearer 1.10 than 1.14, and nowhere near anything that deserves to be described in the language of cigarette packets.
Holt-Lunstad’s own 2010 paper found the same thing in miniature. In her meta-regression, effect sizes drawn from statistically controlled models were significantly smaller than those drawn from raw data. She read that as evidence that the true effect might be underestimated, since some of the pathway from social connection to death presumably runs through health behaviour and so gets adjusted away. That is a reasonable reading. It is not the only one.
How confident is the field in its own numbers
Wang and colleagues did something most coverage of their paper omitted: they graded their own evidence. Using the GRADE system, they assessed the certainty of all eighteen of their pooled estimates. Four came out low. Fourteen came out very low. Not one reached moderate. Every downgrade was for inconsistency between studies or for publication bias.
Four things the authors flagged in their own work
Limitations stated in the papers themselves, not by critics.
All four are quoted or paraphrased from the limitations sections of Wang et al. 2023 and Nakou et al. 2025.
None of this is a scandal. It is what observational epidemiology on a social exposure looks like when it is done honestly. But GRADE “very low” means the true effect is likely to be substantially different from the estimate, and that is the field’s own verdict on its own central finding.
Is loneliness actually increasing?
The word “epidemic” implies a trend. An epidemic is not a condition that exists; it is one that is spreading. This is the part of the story with the weakest evidence behind it, and in the wealthy countries where the campaign is loudest, several of the best datasets point the other way.
Studies that actually measured loneliness over historical time
Comparisons of the same age group at different points in history, or of birth cohorts at matched ages.
Amber marks a rise, blue a decline or no change. All five used the UCLA Loneliness Scale or a close variant, which is what makes them comparable across time in the first place.
The pattern that emerges is not “loneliness is not a problem”. It is that loneliness in stable rich democracies has been roughly flat or slowly falling for decades, and has risen sharply in societies undergoing fast structural change. The WHO’s own prevalence figures fit this: about 24 per cent of people in low-income countries reported feeling lonely against about 11 per cent in high-income countries. If loneliness were a modern Western affliction of smartphones and suburbs, the map would look the opposite way round.
It is worth being careful about the 871,000 deaths figure too. It is a modelled attribution — prevalence estimates multiplied through association estimates of the kind discussed above, most of which the underlying authors graded as low or very low certainty. It is a reasonable order-of-magnitude exercise. It is not a body count.
Association, or cause?
The strongest test available short of a randomised trial is triangulation: run the same question through several designs whose biases point in different directions, and see whether the answer survives. Darren Hilliard and colleagues did this in 2024 using UK Biobank and large genome-wide association datasets, combining conventional observational analysis, a sibling-control design that holds family background constant, and Mendelian randomisation, which uses genetic variants as a natural experiment.
Their result was split. There was consistent evidence that loneliness and social isolation causally worsen mental health and wellbeing, and that loneliness worsens general self-rated health. There was no evidence of effects on specific physical health outcomes — though the authors are careful to say such effects cannot definitively be ruled out. Evidence was generally stronger for loneliness than for isolation, which is the reverse of the mortality picture.
Depression is the obvious candidate for what is going on underneath. Loneliness predicts depression, depression predicts death, and the two are hard to separate with a questionnaire. Tjalling Holwerda’s meta-analysis found that when the pool was restricted to studies that treated depression as a covariate, the loneliness-mortality association was no longer significant. Nakou’s subgroup analysis found something structurally similar for cognition: adjusting for cognitive function dropped the loneliness estimate from 1.16 to 1.08, and the difference between those subgroups was itself significant.
The reasonable summary is that isolation and loneliness are markers of an underlying situation — illness, poverty, cognitive decline, depression, widowhood — that also kills people, and that they probably contribute something of their own on top. How much of each remains genuinely unresolved.
Where the deaths actually are
Return to the Korean figures, because they do something the meta-analyses cannot: they show you the people.
Recorded lonely deaths in South Korea, 2023
3,661 cases. Composition by sex and age band.
Ministry of Health and Welfare, Republic of Korea, lonely-death statistics. Sex was not recoverable for 61 of the 2023 cases. The ministry’s definition requires living alone and being disconnected from family, relatives, friends and neighbours; cause of death may be suicide, illness or anything else.
The same concentration shows up in the pooled data once you look for it. In Nakou’s meta-analysis, living alone was associated with a hazard ratio of 1.49 in men and 1.07 in women — and the women’s estimate, with a confidence interval of 0.91 to 1.26, did not reach significance at all. The subgroup difference between the sexes was significant. Living alone, for women, was not measurably associated with dying sooner.
Living alone, by sex
Pooled hazard ratio for all-cause mortality in adults over 50. Nakou et al., 2025, 17 studies, 86,553 participants for the all-cause analysis.
Subgroup difference p = 0.04. In the same paper, adjusting for income dropped the pooled living-alone estimate from 1.26 to 1.11, and the income contrast was itself significant (p = 0.03).
So the picture the evidence supports is narrower and more specific than the one in circulation. It is not that everyone is lonely and everyone is dying of it. It is that structural isolation — measured as an absence of actual contact, not as a reported feeling — carries a real excess mortality risk, that the risk lands heavily on men living alone in middle age and later, and that a good part of it travels with poverty, illness and cognitive decline rather than instead of them.
Can anything be done about it?
This is where the literature is thinnest, and where it matters most. A preregistered meta-analysis published in American Psychologist in 2025 by Mathias Lasgaard, Pamela Qualter and colleagues screened 312 studies and pooled 280. Across 122 randomised controlled trials, interventions reduced loneliness in the short term by a standardised mean difference of −0.50, with a confidence interval of −0.60 to −0.39. Psychological interventions worked best. There was no significant difference between age groups.
The authors graded the certainty of those estimates as low or very low. Long-term effects, measured in 72 studies, were weaker. And no trial in that literature was powered to detect a change in mortality, because none could be: you would need tens of thousands of participants followed for a decade, and nobody has run it.
Holt-Lunstad flagged the likely reason interventions underperform, back in 2010. Almost every trial supplies support from strangers — a visiting volunteer, a befriending service, a facilitated group. The mortality evidence comes almost entirely from naturally occurring relationships, and in her own tables, received support was the weakest functional measure at 1.22 while multi-component social integration was the strongest at 1.91. Providing company is not the same intervention as being embedded in a network, and the second is very hard to prescribe.
What the evidence does and does not support
If you want the one operational sentence the evidence will bear: the measurable risk sits with people who have nobody who would notice, not with people who feel unhappy about their relationships, and it sits disproportionately with men living alone after fifty. Regular contact that someone else initiates — a standing call, a fixed weekly appointment, membership of something with an attendance register — is closer to what the cohorts actually measured than any amount of encouragement to feel less lonely.
Questions people ask
Is loneliness really as bad as smoking?
No, and the original paper did not claim it. It compared effect sizes on mortality between social relationship measures and various risk factors, and found them of similar magnitude. Smoking’s dose-response relationship, its biological mechanism and its trial evidence are all vastly better characterised. The 2010 analysis also put social relationships in the same range as consuming more than six drinks a day and above physical inactivity and obesity — comparisons that are equally valid and never quoted.
I live alone. Should I be worried?
Living alone was the weakest predictor in the 2010 meta-analysis and its confidence interval crossed 1.00. In the 2025 older-adult meta-analysis it carried a hazard ratio of 1.21 overall, but 1.07 and non-significant in women, and it dropped to 1.11 once income was adjusted for. Living alone with an intact network is a very different exposure from living alone with none, and it is the second that the data is describing.
Which matters more, loneliness or isolation?
For mortality, isolation, by a clear margin: 1.32 against 1.14 in the largest pooled analysis, and the two together came to 1.18, which is lower than isolation alone. For mental health the ordering reverses — loneliness is the exposure with the better causal evidence behind it. They are different problems with different remedies.
Why are so many of the Korean lonely deaths middle-aged men?
The ministry publishes the counts, not the explanation. What the pooled data adds is that the sex difference is not a Korean artefact: living alone was associated with a 1.49 hazard ratio in men and a non-significant 1.07 in women across seventeen international studies. Men living alone appear to lose more contact when a household dissolves than women do. Whether that is about the composition of men’s networks, about who keeps the relationships after a separation, or about health behaviour, the mortality studies cannot tell you.
Does social media make it worse?
The best available review of that specific question, by Jeffrey Hall in 2024, found that social media use is only weakly related to trait loneliness, explains little variance relative to other predictors, and fails to explain change in loneliness over time. He states there is no evidence it causes loneliness. This is a narrower claim than either side of the public argument usually makes, and it is the one the data supports.
The short version
- The famous 50 per cent figure is an average across measures that disagree. Composite social integration gave 1.91; living alone gave 1.19 and did not reach significance.
- “Fifteen cigarettes a day” is a media translation of a comparison of effect sizes. The same paper equally supported a comparison to more than six drinks a day.
- Isolation and loneliness are different exposures. Across 90 cohorts and 2.2 million adults: isolation 1.32, loneliness 1.14, both together 1.18 — lower than isolation alone.
- Every methodological improvement shrinks the estimate: validated scales, longer follow-up, higher study quality, adjustment for income or cognition.
- The authors of the largest synthesis graded all eighteen of their own pooled estimates as low or very low certainty.
- Loneliness is not clearly rising in the developed world. US, Dutch, German and Swedish long-run data show declines or no change; the clear rise is in China.
- Triangulated causal analysis supports effects on mental health, but found no evidence of effects on specific physical health outcomes.
- The risk is concentrated. Living alone carried 1.49 in men and a non-significant 1.07 in women; in Korea, men in their fifties and sixties were 53.9% of lonely deaths.
- Interventions reduce loneliness in the short term at low or very low certainty. No trial has ever tested whether they reduce mortality.
This article summarises epidemiological research on populations. It is not medical advice and cannot tell you anything about your own risk. If you are struggling with isolation or with your mood, that is worth raising with a doctor, who has information about you that no cohort study does.
Further reading: the two central papers are both free to read in full. Holt-Lunstad, Smith and Layton 2010 is open access at PLoS Medicine, and its Table 4 — the breakdown by type of measure — is the single most useful page in this entire literature. The WHO Commission on Social Connection’s 2025 report is published at who.int.
- Together, Vivek Murthy (2020). The US Surgeon General on the health effects of isolation.
- The Scout Mindset, Julia Galef (2021). On reasoning to see clearly rather than to defend a position.
- How to Read Numbers, Tom Chivers & David Chivers (2021). Common statistical traps explained through news examples.
Sources
- Holt-Lunstad, J., Smith, T.B. and Layton, J.B., “Social Relationships and Mortality Risk: A Meta-analytic Review”, PLoS Medicine 7(7): e1000316, 2010. (148 studies, 308,849 participants, mean age 63.9, mean follow-up 7.5 years. Omnibus OR 1.50 [1.42–1.59], I² = 81%. By measure: complex integration index 1.91 [1.63–2.23, k=30], social integration 1.52, networks 1.45, loneliness inverted 1.45 [1.08–1.94, k=8], isolation inverted 1.40 [1.06–1.86, k=8], perceived support 1.35, married 1.33, received support 1.22 [0.91–1.63], living alone inverted 1.19 [0.99–1.44, k=17]. Metaregression: statistically controlled estimates significantly smaller, B = −0.147, p = 0.01.)
- Wang, F., Gao, Y., Han, Z. et al., “A systematic review and meta-analysis of 90 cohort studies of social isolation, loneliness and mortality”, Nature Human Behaviour, 2023. (90 cohorts, 2,205,199 individuals. All-cause mortality: isolation 1.32 [1.26–1.39], I² = 77.8%; loneliness 1.14 [1.08–1.20], I² = 91.1%; both together 1.18 [1.05–1.32] from 5 papers. CVD mortality: isolation 1.34; loneliness 1.14 [0.97–1.35], not significant. Cancer: isolation 1.24, loneliness 1.09. Publication bias for isolation, Egger p = 0.006. GRADE: 4 estimates low, 14 very low, none moderate or high.)
- Nakou, A., Dragioti, E., Bastas, N.-S. et al., “Loneliness, social isolation, and living alone”, Aging Clinical and Experimental Research 37, 2025. (86 studies. Loneliness 1.14 [1.10–1.18]; isolation 1.35 [1.27–1.43]; living alone 1.21 [1.13–1.30]. Subgroups: loneliness by validated scale 1.10 versus single item 1.18; follow-up under 5 years 1.22 versus 1.10, p = 0.01; cognition-adjusted 1.08 versus 1.16, p = 0.02. Isolation by NOS ≤6 1.81 versus NOS ≥7 1.31, p = 0.04; follow-up under 5 years 1.46 versus 1.31, p = 0.01. Living alone: men 1.49 [1.21–1.84] versus women 1.07 [0.91–1.26], p = 0.04; income-adjusted 1.11 versus 1.26, p = 0.03.)
- Hilliard, D.D., Wootton, R.E., Sallis, H., van de Weijer, M.P., Treur, J.L. and Qualter, P., “Investigating causal relationships between loneliness, social isolation and health”, medRxiv, 2024. (Triangulation of observational analysis, sibling control and Mendelian randomisation; UK Biobank N = 8,075–414,432, GWAS N = 17,526–2,083,151. Evidence for causal effects on mental health and wellbeing, and of loneliness on general health; no evidence of effects on specific physical health outcomes, which the authors say cannot definitively be ruled out.)
- Holwerda, T.J., Rhebergen, D., Comijs, H.C., Dekker, J. and Stek, M.L., “Loneliness and mortality in older adults and the role of depression”, International Psychogeriatrics 32(S1), 2020. (When restricted to studies treating depression as a covariate, the loneliness–mortality association was not significant.)
- Clark, D.M.T., Loxton, N.J. and Tobin, S.J., “Declining Loneliness Over Time”, Personality and Social Psychology Bulletin, 2015. (48 samples of US college students on the Revised UCLA scale, N = 13,041, 1978–2009, d = −0.26. Monitoring the Future high-school samples, N = 385,153, 1991–2012, also declining. Subjective isolation d = −0.20; network isolation d = 0.06.)
- Suanet, B. and van Tilburg, T.G., “Loneliness declines across birth cohorts”, Psychology and Aging, 2019. (Longitudinal Aging Study Amsterdam, 4,880 adults aged 55+, 1992–2016. Later cohorts less lonely, d = 0.11; the age effect was d = 0.83 comparing ages 75 and 95.)
- Suanet, B., Drewelies, J., Duezel, S. et al., “Historical change in trajectories of loneliness in old age”, Psychology and Aging, 2024. (Berlin Aging Study 1990, n = 257, versus Berlin Aging Study II 2010, n = 383, age-matched at about 79. Later cohort less lonely, d = −0.84; cohort accounted for over 14% of variance; age trajectories parallel.)
- Dahlberg, L., Agahi, N. and Lennartsson, C., “Lonelier than ever? Loneliness of older people over two decades”, Archives of Gerontology and Geriatrics 75, 2018. (Swedish Panel Study of Living Conditions of the Oldest Old, 1992–2014, n = 2,572 aged 77+. No increase over the period.)
- Yan, Z., Yang, X., Wang, L., Zhao, Y. and Yu, L., “Social change and birth cohort increase in loneliness among Chinese older adults”, International Psychogeriatrics, 2014. (25 studies, N = 13,280 aged 60+, 1995–2011. Loneliness rose 1.02 standard deviations, predicted by urbanisation, divorce rate, Gini coefficient and unemployment.)
- Lasgaard, M., Qualter, P., Løvschall, C. et al., “Are loneliness interventions effective for reducing loneliness? A meta-analytic review of 280 studies”, American Psychologist, 2025. (Preregistered; 122 RCTs gave a short-term SMD of −0.50 [−0.60, −0.39]; long-term effects from 72 studies were weaker; GRADE certainty low or very low.)
- Hall, J.A., “Loneliness and social media”, Annals of the New York Academy of Sciences, 2024. (Narrative review: social media use weakly related to trait loneliness, explains little variance, fails to explain change over time; the author states there is no evidence it causes loneliness.)
- World Health Organization, Commission on Social Connection, report and news release, 30 June 2025. (One in six people worldwide affected by loneliness; more than 871,000 deaths a year linked to loneliness and social isolation, about 100 an hour. 17–21% of those aged 13–29 reported loneliness; about 24% in low-income countries versus 11% in high-income. The report notes data on social isolation is more limited than data on loneliness.)
- Ministry of Health and Welfare, Republic of Korea, lonely-death statistics, reported October 2024. (2019: 2,949 cases; 2020: 3,279; 2021: 3,378; 2022: 3,559, 1.04% of all deaths; 2023: 3,661, 0.95% of all deaths. Men 84.1% of 2023 cases, sex unrecoverable for 61. In 2023, 31.6% were in their sixties and 30.2% in their fifties; men in their fifties and sixties were 53.9% of all cases.)